© 2015, IRJET ISO 9001:2008 Certified Journal Page
63
Earthquake Resistant Design of Open Ground Storey Building
Piyush Tiwari
1, P.J.Salunke
2, N.G.Gore
31 P.G Student (M.E), Civil Engineering Department, MGM College of Engineering and Technology, Maharashtra,
India.
2 Assistant Professor, Civil Engineering Department, MGM College of Engineering and Technology, Maharashtra,
India.
3Assistant Professor, Civil Engineering Department, MGM College of Engineering and Technology, Maharashtra,
India.
---***---Abstract -
Open ground building (OGS) has taken itsplace in the Indian urban environment due to the fact that it provides much needed parking facility in the ground storey of the building. Surveys of buildings failed in past earthquakes show that this types of buildings are found to be one of the most vulnerable. Presence of infill walls in the frame alters the behavior of the building under lateral loads. However, it’s common industry practice to ignore the stiffness of infill wall for analysis of framed building. Design based on such analysis results in under-estimation of building moments and shear forces in the columns of ground storey and hence it may be one of the reasons responsible for the failure observed. IS code 1893:2002 allows the analysis of open ground storey RC framed building without considering infill stiffness but with a multiplication factor of 2.5 in compensation for stiffness discontinuity. As per the code” The columns and Beams of soft storey building are to be designed for 2.5 times the storey shears and bending moments calculated under seismic loads of bare frames. However, as experienced by the engineer at design offices, MF of 2.5 in not realistic for low and mid rise buildings. This calls for assessment and review of the code recommended multiplication Factor for low rise and mid rise OGS buildings. Therefore objective of this study is to check the applicability of multiplication factor of 2.5 and to study the effect of infill strength and stiffness in seismic analysis of OGS buildings. Three Different models of existing RC framed building with open ground storey located in Seismic Zone V is considered for the study using commercial Etabs Software. Infill Stiffness with openings was modeled using a Diagonal Strut approach. Linear and Non-Linear analysis is carried out for these models and results were compared.
Key Words: Infill walls, Equivalent diagonal strut,
Open first storey, Response Spectrum analysis,
Equivalent Static analysis, Multiplication Factor,
Pushover analysis.
1. Introduction
Open ground storey (OGS) buildings are commonly constructed in populated countries like India since they provide much needed parking space in an urban environment. Failures observed in past earthquakes show that the collapse of such buildings is predominantly due to the formation of soft-storey mechanism in the ground storey columns. In conventional design practice, the contribution of stiffness of infill wall presents in upper storey of OGS framed buildings are ignored in structural modeling. From the past earthquakes it was evident that the major type of failure that occurred in OGS buildings included snapping of lateral ties, crushing of core concrete, buckling of longitudinal reinforcement bars etc. Due to the presence of infill walls in the entire upper storey except for the ground storey makes the upper storey much stiffer than the open ground storey. Thus, the upper storey move almost together as a single block and most of the horizontal displacement of the building occurs in the soft ground storey itself. In other words, this type of buildings sway back and forth like inverted pendulum during earthquake shaking, and hence the columns in the ground storey columns and beams are heavily stressed. Therefore it is required that the ground storey columns must have sufficient strength and adequate ductility. The vulnerability of this type of building is attributed to the sudden lowering of lateral stiffness and strength in ground storey, compared to upper storey with infill walls. A bare frame is much less stiff than a fully Infilled frame, it resists the applied lateral load through frame action and shows well-distributed plastic hinges at failure but when, frame is fully Infilled, truss action is introduced. A fully infilled frame shows less inter-storey drift, although it attracts higher base shear (due to increased stiffness).
© 2015, IRJET ISO 9001:2008 Certified Journal Page
64
7.10.3(a) states: “The columns and beams of the softstorey are to be designed for 2.5 times the storey shears and moments calculated under seismic loads of bare frames. This MF is supposed to be in compensation for the stiffness discontinuity. The conservative nature of this empirical recommendation of IS code was first pointed out by Kanitkar and Kanitkar (2001), Subramanian (2004) and Kaushik (2006). Hence the aim of this thesis is to check the applicability of the multiplication factor of 2.5 in the ground storey beams and column when the building is to be designed as open ground storey framed building and to study the effect of infill strength and stiffness in the seismic analysis of low and medium rise open ground storey building.
1.1 Aims and Objective of my work
The particular objectives of the study are:
1) To Study the applicability of the Multiplication Factor of 2.5 as given by IS Code 1893 Part-1(2002), for Low Rise and Medium Rise Open ground storey Building.
2) To study the effect of infill strength and stiffness (with infill Opening) in the seismic analysis of Open ground storey building.
1.2 Open Ground Storey Building
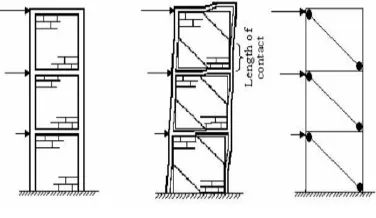
[image:2.595.320.562.58.218.2]The presence of infill walls in the upper storey of the OGS building increases the stiffness of the building, as seen in a typical Infilled framed building. Due to increase in the stiffness, the base shear demand on the building increases while in the case of typical Infilled frame building, the increased base shear is shared by both the frames and infill walls in all the storey. In OGS buildings, where the infill walls are not present in the ground storey, the increased base shear is resisted entirely by the columns of the ground storey, without the possibility of any load sharing by the adjoining infill walls. The increased shear forces in the ground storey columns will induce increase in the bending moments and curvatures, causing relatively larger drifts at the first floor level. The large lateral deflections further results in the bending moments due to the P-∆ effect. Plastic hinges gets developed at the top and bottom ends of the ground storey columns. The upper storeys remain undamaged and move almost like a rigid body. The damage mostly occurs in the ground storey columns which is termed as typical ‘soft-storey collapse’. This is also called a ‘storey-mechanism’ or ‘column mechanism’ in the ground storey as shown in the figures below. These buildings are vulnerable due to the sudden lowering of stiffness or strength (vertical irregularity) in the ground storey as compared to a typical Infilled frame building.
Fig. 1 Showing difference in Behavior between Bare, Infill OGS Building Frame
1.2 TYPICAL MASONRY INFILLED BUILDINGS
Typical masonry Infilled frames contain infill walls throughout the building in all storey uniformly. Although infill walls are known to provide the stiffness and strength to the building globally, these are considered as ‘non-structural’ by design codes and are commonly ignored in the design practice for more convenience. The presence of infill walls in a framed building not only enhance the lateral stiffness in the building, but also alters the transmission of forces in beams and columns, as compared to the bare frame. In a bare frame, the resistance to lateral force occurs by the development of bending moments and shear forces in the beams and columns through the rigid jointed action of the beam-column joints. In the case of Infilled frame, a substantial truss action can be observed, contributing to reduced bending moments but increased axial forces in beams and columns, (Riddington and Smith, 1977; Holmes, 1961).The infill in each panel behaves somewhat like a diagonal strut as shown in Fig. below.
Fig. 2 a) Infilled Frame b) Deformed Frame c) Equivalent Strut Model
Hence these infill walls are beneficial to the building, only when they are evenly placed in plan and elevation. These infill walls come to rescue the structure at worst lateral loads such as seismic loading and wind loading owing to its high stiffness and strength.
2. Structural Modeling
[image:2.595.339.527.489.598.2]© 2015, IRJET ISO 9001:2008 Certified Journal Page
65
various structural elements is very important in [image:3.595.37.296.175.304.2]non-linear analysis. In present study, frame elements were modeled with inelastic flexural hinges using point plastic model. Infill wall is modeled as equivalent diagonal strut elements.
Figure 3: Building model Plan
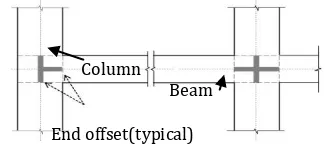
Beam and columns are modeled by 3D frame elements. Beams and columns are modeled by giving end-offsets to the frame elements, to obtain the bending moments and forces at the beam and column faces. Beams-Column joints are assumed to be rigid. Beams and columns in present study were modeled as frame elements with centre lines joined at the nodes using commercial Etabs Software. Rigid beam-column joints were modeled by using end offsets at the joints. Floor slabs were assumed to act as diaphragms, which ensure integral action of all vertical lateral load resisting elements.
Column
Beam
End offset(typical)
Figure 4: Use of end offsets at beam-column joint.
An existing RC framed Open ground storey building is considered in Seismic zone-V with Special Moment Resisting Frame (SMRF) is analyzed and Modeled in Etabs Software. Three Different models (G+10,G+7 & G+4)having Fixed End support condition with medium Soil is considered. The Concrete slab is 125mm thick at each floor level
Fig -5: Center Line plan Used in Etabs
Model A
Case 1: (G+4) storey building in which Ground storey is open and other stories are having infill wall,(Model A-1).
Case 2: (G+4) storey building in which all stories are open (Bare framed Building),(Model A-2).
Model B
Case 1: (G+7) storey building in which Ground storey is open and other stories are having infill wall,(Model B-1).
Case 2: (G+7) storey building in which all stories are open (Bare framed Building),(Model B-2).
Model C
Case 1: (G+10) storey building in which Ground storey is open and other stories are having infill wall,(Model C-1).
Case 2: (G+10) storey building in which all stories are open (Bare framed Building),(Model C-2).
Table no 1: Details of Building Models.
Type Of Structure Multi-storey Rigid Jointed
Plane Frame (SMRF)
Seismic Zone V
Number of Stories G+10 (34.2m),
G+7 (25.6m), and
G+4 (16.2m)
Floor Height Ground Floor=4.2m,
[image:3.595.70.234.473.547.2] [image:3.595.287.564.564.774.2]© 2015, IRJET ISO 9001:2008 Certified Journal Page
66
Infill Wall 230mm outer external wall,
120mm Internal wall,
150mm Parapet wall
Type of soil Medium
Size of Column G+10-(230x800)mm
G+7-(230x700)mm
G+4-(230x600)mm
Size of Beam 230mm x 600 mm
Depth of Slab 125 mm
Materials of Concrete Column and Beam: M30
Slab:M25
Damping of Structure 5%
Modulus of Elasticity of Concrete
M30-27386 N/mm2
M25-25000 N/mm2
Modulus of Elasticity of Brick
550*fm
Z 0.36
2.1 Loads Considered:
2.1.1 Wall Load:
Unit weight of brick wall = 20 KN/m2 a) External 230mm = 11.02KN/m2 b) Internal Wall 120mm =5.76 KN/m2 c) Parapet Wall 150mm = 3KN/m2
2.1.2 Live Load:
a) Intermediate floors = 2KN/m2 b) Terrace =1.5 KN/m2
2.1.3 Floor Finish
a) For Intermediate Floors: FF =1 KN/m2 b) For Terrace Floors: FF=1.5 KN/m2.
3. Design of Infill Strut
The simplest equivalent strut model includes a single pin-jointed strut. Holmes who replaced the infill by an equivalent pin-jointed diagonal strut made of the same material and having the same thickness as the infill panel suggest a width defined by,
Paulay and Priestley suggested the width of equivalent strut as,
Where,
d= Diagonal length of infill panel.
W=Depth of diagonal Strut.
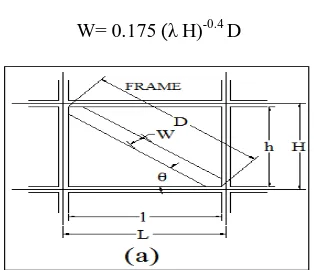
However, researchers later found that this model overestimates the actual stiffness of Infilled frames and give upper bound values. Another model for masonry infill panels was proposed by Mainstone in 1971 where the cross sectional area of strut was calculated by considering the sectional properties of the adjoining columns. The details of model are as shown in Figure 6.The strut area As
was given by the following equation.
Ae = W t
W= 0.175 (λ H)-0.4 D
[image:4.595.342.499.423.558.2]
Figure 6: Brick Infill Panel as Equivalent Diagonal Strut.
Where,
Ei = the modules of elasticity of the infill material, N/mm2
Ef= the modules of elasticity of the frame material, N/mm2
Ic= the moment of inertia of column, mm4 l = the width of infill
D = the diagonal length of infill panel
© 2015, IRJET ISO 9001:2008 Certified Journal Page
67
3.1 Infill Frame with openings:
Area of opening, Aopis normalized with respect to area of infill panel, Ainfilland the ratio is termed as opening percentage (%).
[image:5.595.375.469.155.398.2]
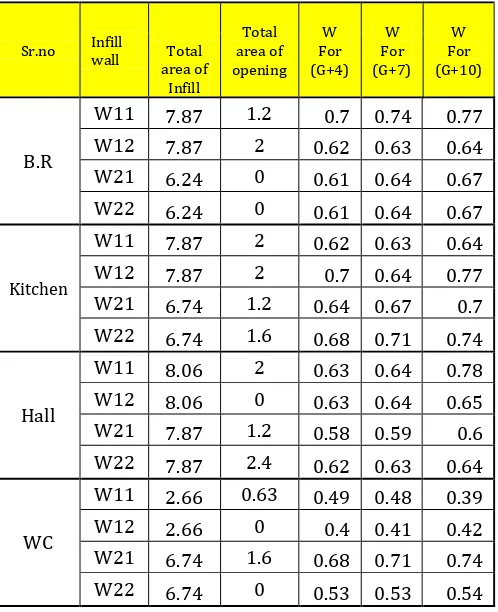
Openings For (G+10, (G+7) and (G+4) are calculated as below by Mainstone Equation:
Table 2: Width calculated as per Mainstone Equation.
Sr.no Infill
wall area of Total Infill
Total area of opening
W For (G+4)
W For (G+7)
W For (G+10)
B.R
W11 7.87 1.2 0.7 0.74 0.77
W12 7.87 2 0.62 0.63 0.64
W21 6.24 0 0.61 0.64 0.67
W22 6.24 0 0.61 0.64 0.67
Kitchen
W11 7.87 2 0.62 0.63 0.64
W12 7.87 2 0.7 0.64 0.77
W21 6.74 1.2 0.64 0.67 0.7
W22 6.74 1.6 0.68 0.71 0.74
Hall
W11 8.06 2 0.63 0.64 0.78
W12 8.06 0 0.63 0.64 0.65
W21 7.87 1.2 0.58 0.59 0.6
W22 7.87 2.4 0.62 0.63 0.64
WC
W11 2.66 0.63 0.49 0.48 0.39
W12 2.66 0 0.4 0.41 0.42
W21 6.74 1.6 0.68 0.71 0.74
W22 6.74 0 0.53 0.53 0.54
Openings of Doors and windows are deducted using the Equation given by Panagiotis:
λ = 1-2αw0.54+αw1.14
αw =Opening Percentage.
[image:5.595.37.286.273.579.2]Openings Reduces the Strut stiffness and hence Infill panel reduction (λ) factor is given by Panagiotis.Width from Maintone is multiplied by Reduction factor “λ”.
Table 3: Reduction factor is calculated from opening percentage
αw λ
0 1
0.17 0.36
0.19 0.33
0.26 0.25
0.28 0.23
0.33 0.18
0.9 0.004
1 0
Graph 1: Opening Percentage Graph for all Three Models.
Table 4: Reduced Width is as given below:
Descriptions Infill walls
Final width
for (G+4)
Final width for (G+7)
Final width
[image:5.595.307.564.437.621.2]© 2015, IRJET ISO 9001:2008 Certified Journal Page
68
BedroomW11 0.28 0.3 0.31
W12 0.16 0.16 0.17
W21 0.61 0.64 0.67
W22 0.61 0.64 0.67
Kitchen W11 0.16 0.16 0.17
W12 0.18 0.17 0.2
W21 0.22 0.23 0.25
W22 0.18 0.19 0.2
Hall
W11 0.16 0.16 0.2
W12 0.63 0.64 0.65
W21 0.23 0.24 0.24
W22 0.13 0.13 0.13
WC
W11 0.13 0.13 0.11
W12 0.4 0.41 0.42
W21 0.18 0.19 0.2
W22 0.53 0.53 0.54
4. Results
4.1.1 Comparision of Base Shear
[image:6.595.34.289.88.494.2]Base shear in case of Response Spectrum analysis is compared between Bare frame model and Infill model to See the difference between them and also to get the Multiplication Factor.
Table 5: Base Shear for (G+4) Building.
Model-(G+4) Storey With infill
Bare
Frame M.F
Base Shear
Along
X-Axis 1624 1108 1.47
Along
Y-Axis 1458 1020 1.43
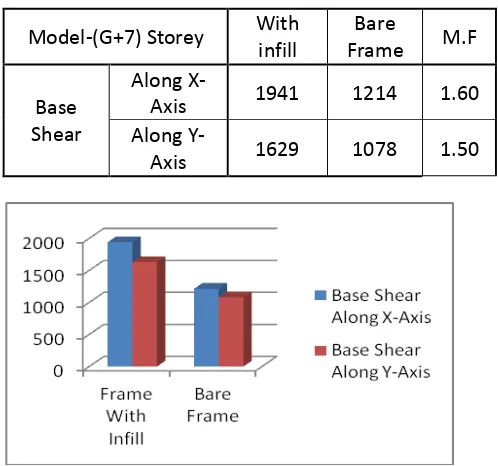
Table 6: Base Shear for (G+7) Building.
Model-(G+7) Storey With infill
Bare
Frame M.F
Base Shear
Along
X-Axis 1941 1214 1.60
Along
Y-Axis 1629 1078 1.50
Table 7: Base Shear for (G+10) Building.
Model-(G+10) Storey With Infill
Bare
Frame M.F
Base Shear
Along
X-Axis 2116 1252 1.69
Along
[image:6.595.306.555.354.587.2]© 2015, IRJET ISO 9001:2008 Certified Journal Page
69
[image:7.595.26.568.43.599.2]4.1.2 Comparison of ESA Results.
Table 8 : ESA Result for (G+4) Building.
ESA Result for (G+4) Storey Building Model
Model With
infill
Bare
Frame M.F
Column(G.S) Max.BM 212.81 189.07 1.16
Beam(G.S) Max.BM 1445.33 1298.92 1.11
Table 9 : ESA Result for (G+7) Building.
ESA Result for (G+7) Storey Building Model
Model With
infill
Bare
Frame M.F
Column(G.S) Max.BM 291.86 221.09 1.32
Beam(G.S) Max.BM 1711.87 1317.02 1.30
Table 10 : ESA Result for (G+10) Building.
ESA Result for (G+4) Storey Building Model
Model With
infill
Bare
Frame M.F
Column(G.S) Max.BM 379.27 242.92 1.56
Beam(G.S) Max.BM 1936.9 1328.29 1.46
[image:7.595.304.560.49.274.2]4.1.2 Comparison of RSA Results.
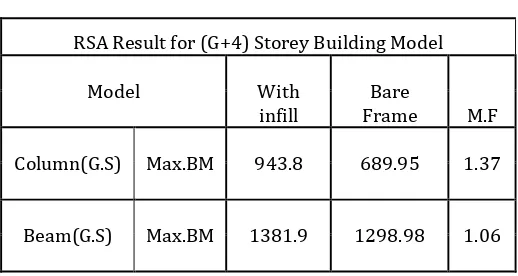
Table 11 : RSA Result for (G+4) Building.
RSA Result for (G+4) Storey Building Model
Model With
infill
Bare
Frame M.F
Column(G.S) Max.BM 943.8 689.95 1.37
Beam(G.S) Max.BM 1381.9 1298.98 1.06
Table 12 : RSA Result for (G+7) Building.
RSA Result for (G+4) Storey Building Model
Model With
infill
Bare
Frame M.F
Column(G.S) Max.BM 1213.76 832.06 1.46
Beam(G.S) Max.BM 1574.78 1239.23 1.27
Table 13 : RSA Result for (G+10) Building.
RSA Result for (G+10) Storey Building Model
Model With
infill
Bare
Frame M.F
Column(G.S) Max.BM 1532.44 978.93 1.57
[image:7.595.307.566.338.476.2]© 2015, IRJET ISO 9001:2008 Certified Journal Page
70
From the above analysis we conclude that M.F required for(G+4) storey model is in the range of (1.37-1.47) for column and (1.06-1.43) for beam, which is nearly 41.2% and 42.8% less than, which is prescribed by IS code. i.e 2.5. Similarly for (G+7) storey model,M.F is in range of (1.27-1.51) for beam and (1.46-1.60) for column,which is 36% and 40% less than value of 2.5.and for (G+10) Storey Model BM is in the range of (1.47-1.50) for beam and (1.57-1.69) for column which is again 32.4% and 40% less than 2.5.We also conclude that, Base shear demands for Infilled frame is higher than bare frame, which may be one of the possible mode of failure in Ogs building
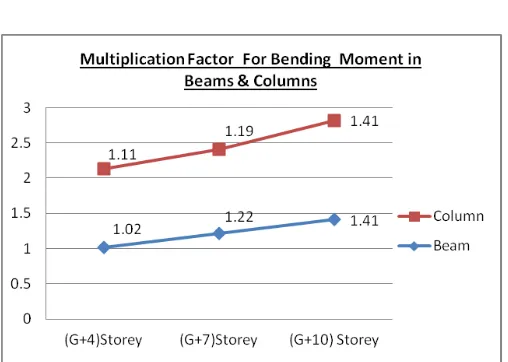
[image:8.595.234.555.52.489.2] [image:8.595.45.380.60.289.2]4.1.3 Pushover Analysis
Table 14 : POA Result for (G+4) Building.
POA Result for (G+4) Storey Building Model
Model With
infill
Bare
Frame M.F
Column(G.S) Max.BM 631.17 569.07 1.11
Beam(G.S) Max.BM 1043.31 1018.75 1.02
Table 15 : POA Result for (G+7) Building.
POA Result for (G+7) Storey Building Model
Model With
infill
Bare
Frame M.F
Column(G.S) Max.BM 874.89 735.11 1.19
[image:8.595.308.562.299.480.2]Beam(G.S) Max.BM 1174.37 960.57 1.22
Table 14 : POA Result for (G+10) Building.
POA Result for (G+10) Storey Building Model
Model With
infill
Bare
Frame M.F
Column(G.S) Max.BM 1155.82 820.61 1.41
Beam(G.S) Max.BM 1262.50 898.05 1.41
© 2015, IRJET ISO 9001:2008 Certified Journal Page
71
Similarly we can show for Y-Direction.This figure clearlyshows the global stiffness of an open ground storey building changes considerably when infill wall is ignored.There is also considerable change in stifness elastic base shear demand,if stiffness of wall is ignored.The varition of pushover analysis is an agreement with linear analysis result presented in previous section with regard to variation of elastic base shear demand for different Building models.
5. CONCLUSIONS
Following are the conclusions obtained from the present study.
1) Linear(Static/Dynamic) analysis shows that column forces at the ground storey increase for the presence of infill wall in upper storeys. But design force Multiplication factor found to be much less than 2.5.
2) Seismic analysis of Bare frame structure leads to under estimation of base shear. Under estimation of base shear leads to collapse of structure during earthquake shaking. Therefore its important to consider the infill walls in the seismic analysis of structure.
3) ESA and RSA results shows that, Multiplication factor for (G+4) varies 41.2 %( Column) and 42.8 %( Beam) less than what is prescribed by IS Code of 2.5 Value. Similarly For (G+7) its 36% and 40% and for (G+10) its 32.4 and 40% less value than which is given by IS Code of 2.5.
3) From Pushover analysis, its conclude that there is even no need for a MF of 2.5 for Low rise (G+4) structure. And for (G+7) its 52.4% (Beam) & 51.2%(Column) less than value which is given by IS Code 1893:2002 of 2.5,while for (G+10) it comes out to be 40% less than value given by IS Code.
4) Pushover curve shows that global stiffness and elastic base shear demand of OGS building changes considerably when infill wall is ignored.
ACKNOWLEDGEMENT
I am deeply indebted to Prof. P.J. SALUNKE, and Prof Tausif, Associate Professor, my advisor and guide, for the motivation, guidance, tutelage and patience throughout the research work. I am also thankful to Prof N.G. GORE for his valuable guidance and encouragement throughout the completion of my work.
REFERENCES
[1] Panagiotis G.Asteris et al (2012), “Modeling of Infilled Frames with Openings,” The Open Construction and Building Technology Journal, pp.81-91.
[2] Al-Chaar, G. (2002),"Evaluating strength and stiffness of unreinforced masonry infill Structures”. U.S. Army
Corps of Engineers. Technical Report NO.
ERDC/CERL TR-02-1. Construction Engineering
Research Laboratory. Campaign. USA.
[3] S. B. Smith and C. Carter, (1969).”A Method of Analysis for Infilled Frames. Proceedings of Institution of Civil Engineers”.pp.31-48.
[4] A. Asokan, (2008),"Modeling of Masonry Infill Walls for Nonlinear Static Analysis of Buildings under Seismic Loads”. Indian Concrete Journal.
[5] Dolsek M and P. Fajfar (2000),”On the seismic behavior and mathematical modeling of RC framed structures”. 12th World Conference on Earthquake Engineering. Auckland. New Zealand. 296-305. [6] Liauw, T. C. and K. H. Kwan (1983).”Plastic theory of
non-integral Infilled frames”. Proceedings of Institution of Civil Engineers. Part 2. Pp.379-396. [7] Scarlet, A. (1997),”Design of Soft Stories – A simplified
energy approach”. Earthquake Spectra.pp.305-315.
[8] Saneinejad, A. and B. Hobbs (1995),”Inelastic design of Infilled frames”. ASCE Journal of Structural Engineering,pp.634-650.