© 2015, IRJET ISO 9001:2008 Certified Journal
Page 1411
Effects of Fuel Injection Pressure on CRDI Diesel Engine Performance
and Emissions using CCD
C. Syed Aalam, C.G. Saravanan
Department of Mechanical Engineering, Faculty of Engineering and Technology
Annamalai University, Tamilnadu, India
---***---Abstract -
The influence of injection parameters like injection pressure and injection duration on performance and emission of a common rail direct injection system assisted diesel engine has been evaluated using central composite design (CCD). The tests have been carried out on a four stroke, single cylinder DI diesel engine. The fuel injection system of the diesel engine used was the high pressure common rail direct injection system. From the experiments, it is observed that the brake thermal efficiency (BTE) is improved and fuel consumption reduced due to better atomization. It is also observed that carbon monoxide (CO), unburned hydrocarbons (HC) and smoke emissions are reduced and NOx emissions increased when increasing the injection pressures. This is due to injected fuel droplets find smaller as the injection pressure increases, which leads to improve atomization of the fuel.Key Words:
Fuel injection pressure, Injection
duration, Central composite design, CRDI diesel
engine, Performance, Emission.
1. INTRODUCTION
Paragraph Nowadays an automobile engine has to fulfill all the satisfactory environmental constraints, So we have to follow every possible steps to increase the performance and decrease the emission quantity. CI engine is more efficient than spark ignition engine because it takes less fuel than spark ignition engines. Since the diesel engines are used in heavy vehicles because of their fuel efficiency, reliability, and durability. Performance of diesel engine usually depends on many factors like fuel injection pressure, injection duration, injection quantity, injection position, injection angle, nozzle size, air swirling etc. [1-5]. The fuel injection system is the most necessary component in the working of CI engine. In recent diesel engines, a fuel injection system has to be designed to obtain higher injection pressure. Fuel injection pressure plays an
important role for better atomization of injected fuel and allows it for complete combustion and to reduce the emission [6]. Fuel injection pressure will be low, fuel particle diameters will become wider and ignition delay period will increase during the combustion and engine performance will decrease and cause CO, HC and smoke emissions and the injection pressure increases than the fuel particle diameter decreases and the mixing of air with fuel becomes better during combustion, this leads to better engine performance and reduces smoke level and HC, CO emissions [7-9]. In this study, effect injection pressure on engine performance and emissions characteristics have been experimentally investigated in single cylinder diesel engine equipped with common rail direct injection (CRDI) fuel injection system.
2. EXPERIMENTAL DESIGN
© 2015, IRJET ISO 9001:2008 Certified Journal
Page 1412
the number of factors; and c is the number of center points. The experimental progression was randomized with the intention of minimizing the effects of unpredicted variability in the responses due to extraneous factors. A second-order polynomial equation was used with the intention of developing an experimental model which correlated the responses to the independent variables. The general form of the second order polynomial equation is
Where Y is the response; Xi and Xj are variables (i and j range from 1 to k); b0 is the model intercept coefficient; bj, bjj and bij are interaction coefficients of linear, quadratic and the second order terms, respectively; k is the number of independent parameters (k= 4 in this study); and ei is the error [13]. In the present study, two factors at three level central composite, face centered (CCFC) design used to study the influence of process variables such as injection pressure and injection quantity in CRDI system assisted diesel engine. The three dimensional response surface was constructed from the developed models. Response surface plots are graphical representations of a regression equation that illustrate the main and interactive effects of independent variables on a response variable. These graphs are simple to understand and symbolize the interactions between pairs of independent variables on the responses and also accustomed to locating their optimal levels.
3. EXPERIMENTAL SETUP
Paragraph The experiment is performed on a stationary single cylinder, 4 stroke, water cooled, Common rail direct ignition diesel engine. The fuel injected in standard injection timing (23° BTDC) and the fuel used is standard diesel. The fuel injection pressure in standard engines varies from 150-220 bars, but in this investigation pressure varied from 220-1000 bars to analyze the performance and emission on the CRDI diesel engine. This high pressure was achieved by using two pumps. The primary pump was used to increase the fuel pressure up to 5 bar for pump the fuel from the fuel tank to high pressure pump (secondary pump). The secondary pump is used to compress the fuel to very high pressure up to 1000bar.Common rail (accumulator) used to maintain the
[image:2.595.311.551.246.485.2]injector. The piezo injector is used to inject the fuel at high pressure into the combustion chamber. The engine is coupled to an eddy current dynamometer; the fuel is injected at high pressure with the help of high pressure fuel injection system. The pollutants like NOx, CO and HC are measured using AVL Di-gas analyzer and smoke is measured by using an AVL smoke meter. The technical specification of the tested engine is given in Table 1 and the injector specification is given in Table 2.
Fig. 1 Engine set up with common rail fuel injection system
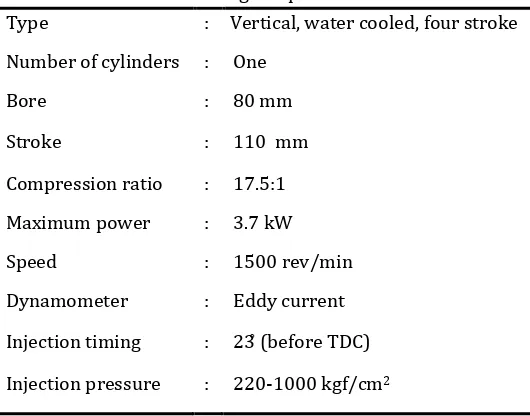
Table 1. Engine specification
Type : Vertical, water cooled, four stroke Number of cylinders : One
Bore : 80 mm
Stroke : 110 mm
Compression ratio : 17.5:1 Maximum power : 3.7 kW
Speed : 1500 rev/min
[image:2.595.302.567.542.750.2]© 2015, IRJET ISO 9001:2008 Certified Journal
Page 1413
Table 2. Injector fuel system specifications
Fuel fed Units Common rail
Injection pressure MPa 250-600 MPa
Number of nozzle
holes - 3
Nozzle hole
diameter mm 0.518
Start of injection - 23º Before top dead center (BTDC)
Injection duration µsec 750
Fuel injected g/cycle 0.168 (at full load)
3. EXPERIMENTAL SETUP
The results obtained at different injection pressures and injection durations are analyzed. Based on the output results, the discussions are represented with the help of central composite design (CCD) graphs.
4.1 FUEL CONSUMPTION (FC)
Fuel consumption plays a very important role in analyzing the performance of an engine. By the help of three dimensional response surface for fuel consumption, it is cleared that the injection pressure was increase; the amount of fuel consumption was reduced. So, increasing injection pressure helps in reducing fuel consumption. This is due to increased injection pressure reduces the fuel particle diameter and because of this, atomization occurs properly and causes better combustion.
DESIGN-EXPERT Plot
Fuel conumption X = A: injection pressure Y = B: injection duration
0.26046 0.309626 0.358793 0.40796 0.457126
F
ue
l c
on
um
pt
io
n
220.00 420.00
620.00 820.00
1020.00
600.00 750.00 900.00 1050.00 1200.00
A: injection pressure B: injection duration
Fig. 2 Three dimensional response surface for fuel consumption
4.2 BRAKE THERMAL EFFICIENCY (BTE)
Fig. 3 shows the three dimensional response surface for BTE by varying injection pressure and injection duration. From the response surface it is clear that increase in injection pressure results better BTE. BTE was increased up to 5% when the injection pressure was increased from 220bar to 1000 bar. On the other side, increase in injection duration does not seem pretty good for BTE, in comparison to injection pressure. So increase of injection pressure increases BTE better than standard working pressure.
DESIGN-EXPERT Plot
BTE
X = A: injection pressure Y = B: injection duration
23.8259 25.1759 26.5259 27.8759 29.2259
B
T
E
220.00 420.00
620.00 820.00
1020.00
600.00 750.00 900.00 1050.00 1200.00
A: injection pressure B: injection duration
[image:3.595.33.287.151.360.2] [image:3.595.318.546.524.721.2]© 2015, IRJET ISO 9001:2008 Certified Journal
Page 1414
Fig. 4 shows the response surface for Unburned Hydrocarbons (HC). From the figure it is clear that the increasing in injection pressure HC emission was reduced, it is due to the high injection pressure increases the rapid atomization and shorter ignition delay period, and this will cause better combustion of fuel. On the other hand increase in injection duration will increase the HC emission. When the HC emission was 90ppm on 220 bar injection pressure and it was 65ppm on 1000 bar injection pressure. So to reduce the HC emission, increase of injection pressure is the best way.
DESIGN-EXPERT Plot
HC
X = A: injection pressure Y = B: injection duration
65.0374 73.454 81.8707 90.2874 98.704
H
C
220.00 420.00
620.00 820.00
1020.00
600.00 750.00 900.00 1050.00 1200.00
A: injection pressure B: injection duration
Fig. 4 Three dimensional response surface for HC
4.4 CARBON MONOXIDE (CO)
Fig.5 shows three dimensional response surface for Carbon Monoxide (CO) emission. From the figure it is clear that the increasing the pressure, increases the amount of CO emission. Carbon-monoxide is a by-product of incomplete combustion and it is produced from the partial
oxidation of carbon-containing compounds; it forms when
there is not enough oxygen to produce carbon
dioxide (CO2). This condition is referred as a rich fuel
condition. Since CO emission occurs due to rich mixture and if injection pressure increases, the mixture gets leaner and easily mixes with the air. CO emission was 0.517% (by volume) when injection pressure was 220bar and it was reduced to 0.38% (by volume) on 1000bar. On other side,
emission was increased.
DESIGN-EXPERT Plot
CO
X = A: injection pressure Y = B: injection duration
0.387759 0.420259 0.452759 0.485259 0.517759
C
O
220.00 420.00
620.00 820.00
1020.00
600.00 750.00 900.00 1050.00 1200.00
[image:4.595.319.548.149.353.2]A: injection pressure B: injection duration
Fig. 5 Three dimensional response surface for CO
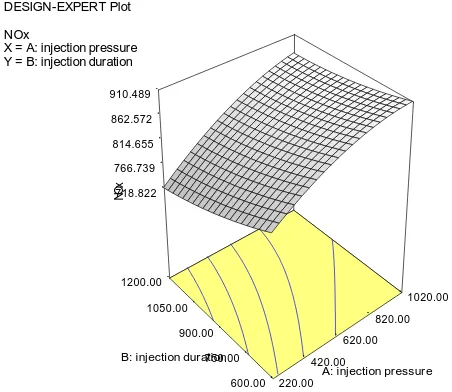
4.5 OXIDES OF NITROGEN (NOX)
[image:4.595.47.272.294.499.2]© 2015, IRJET ISO 9001:2008 Certified Journal
Page 1415
DESIGN-EXPERT Plot
NOx
X = A: injection pressure Y = B: injection duration
718.822 766.739 814.655 862.572 910.489
N
O
x
220.00 420.00
620.00 820.00
1020.00
600.00 750.00 900.00 1050.00 1200.00
[image:5.595.48.274.111.307.2]A: injection pressure B: injection duration
Fig. 6 Three dimensional response surface for NOx
[image:5.595.53.293.523.728.2]4.6 SMOKE
Fig.7 shows three dimensional response surface for smoke emission. When injection pressure increased the formation of mixing of fuel to air becomes better during ignition delay period and tends to complete combustion. So the injection pressure was increased, smoke emission gets decreased. From the figure, smoke emission was decreased from 64 HSU to 46 HSU by increasing the pressure up to 1000bar. In case of injection duration, smoke emission was dramatically increased.
DESIGN-EXPERT Plot
smoke
X = A: injection pressure Y = B: injection duration
46.6494 52.6114 58.5733 64.5352 70.4971
s
m
ok
e
220.00 420.00
620.00 820.00
1020.00
600.00 750.00 900.00 1050.00 1200.00
A: injection pressure B: injection duration
Fig. 7 Three dimensional response surface for smoke
5. CONCLUSION
Increasing the injector pressure i.e. 220 bar to 1000 bar using electronically controlled injection system resulted in a considerable enhancement in performance and emissions with due to better spray formation. The changes noted at maximum engine output were:
1. Brake thermal efficiency increases from 23.8% to 29.2%,
2. Hydrocarbon emission reduced from 90 to 65ppm,
3. NOx emission increases with increasing of injection pressure due to faster combustion and higher temperatures reached in the cycle.
4. Smoke emission reduced from 64HSU to 46HSU. Smoke levels gradually drop with increase in the injector pressure due to better mixture formation owing to well-atomized spray.
Overall a considerable enhancement in the performance and emissions can be realized by appropriately optimizing the injector pressure when a diesel engine.
REFERENCES
[1] Baumgarter, Carsten., 2006. Mixture Formation in Internal Combustion Engines, Spinger Berlin.
[2] Gui-hua, Wang, Zhang-tao, Yao., Na, Liu., Xuezheng, Huang., 2004. Theoretical Study on Tolerance of Fuel Injection System of Diesel Engine, SAE Technical Paper, 2004-01-1318.
[3] C. Syed Aalam, C.G. Saravanan, M. Kannan. Experimental investigations on a CRDI system assisted diesel engine fuelled with aluminium oxide nanoparticles blended biodiesel, Alexandria Engineering Journal, Volume 54, Issue 3, September 2015, Pages 351–358
[4] Celikten, Ismet., 2003. An experimental investigation of the effect of the injection pressure on engine performance and exhaust emission in indirect injection diesel engines, Applied Thermal Engineering 23, pp: 2051–2060.
© 2015, IRJET ISO 9001:2008 Certified Journal
Page 1416
pressure on the engine performance with Ricebran oil as Biodiesel”, XVIII NCICEC, pp.581-587, 2003. [7] Ismet Celikten. 2003. An experimental investigation
of the effect of the injection pressure on engine performance and exhaust emission in indirect injection diesel engine. Applied Thermal Engineering. 23: 2051-2060.
[8] Can Cinar, Tolga Topgul, Murat Ciniviz, Can Hasimoglu. 2005. Effects of injection pressure and intake CO
2 concentration of performance and emission parameters on an IDI turbocharged diesel engine. Applied Thermal Engineering. 25: 1854-1862. [9] Rosli Abu Baker, Semin, Abdul Rahim Ismail. 2008. Fuel injection pressure effect on performance of direct injection diesel engines based on experiments. American Journal of Applied Sciences. 5(3): 197-202. [10]Prakash Maran, J, Sivakumar, V, Sridhar, R., Prince
Immanuel, V. 2013. Development of model for mechanical properties of tapioca starch based edible films. Ind. Crop. Prod. 42, 159–168.