enriched human hair follicle bulge cells
Manabu Ohyama, … , Mark C. Udey, Jonathan C. Vogel
J Clin Invest.
2006;116(1):249-260. https://doi.org/10.1172/JCI26043.
The human hair follicle bulge is an important niche for keratinocyte stem cells (KSCs).
Elucidation of human bulge cell biology could be facilitated by analysis of global gene
expression profiles and identification of unique cell-surface markers. The lack of distinctive
bulge morphology in human hair follicles has hampered studies of bulge cells and KSCs. In
this study, we determined the distribution of label-retaining cells to define the human
anagen bulge. Using navigated laser capture microdissection, bulge cells and outer root
sheath cells from other follicle regions were obtained and analyzed with cDNA microarrays.
Gene transcripts encoding inhibitors of WNT and activin/bone morphogenic protein
signaling were overrepresented in the bulge, while genes responsible for cell proliferation
were underrepresented, consistent with the existence of quiescent noncycling KSCs in
anagen follicles. Positive markers for bulge cells included CD200, PHLDA1, follistatin, and
frizzled homolog 1, while CD24, CD34, CD71, and CD146 were preferentially expressed by
non-bulge keratinocytes. Importantly, CD200
+cells
(CD200
hiCD24
loCD34
loCD71
loCD146
lo) obtained from hair follicle suspensions
demonstrated high colony-forming efficiency in clonogenic assays, indicating successful
enrichment of living human bulge stem cells. The stem cell behavior of enriched bulge cells
and their utility for gene therapy and hair regeneration will need to be assessed in in vivo
assays.
Research Article
Dermatology
Find the latest version:
Characterization and isolation of stem cell–
enriched human hair follicle bulge cells
Manabu Ohyama,1 Atsushi Terunuma,1 Christine L. Tock,1
Michael F. Radonovich,2 Cynthia A. Pise-Masison,2 Steven B. Hopping,3
John N. Brady,2 Mark C. Udey,1 and Jonathan C. Vogel1
1Dermatology Branch and 2Laboratory of Cellular Oncology, Center for Cancer Research, National Cancer Institute, NIH, Bethesda, Maryland, USA. 3The Center for Cosmetic Surgery, Washington, DC, USA.
The human hair follicle bulge is an important niche for keratinocyte stem cells (KSCs). Elucidation of human
bulge cell biology could be facilitated by analysis of global gene expression profiles and identification of
unique cell-surface markers. The lack of distinctive bulge morphology in human hair follicles has hampered
studies of bulge cells and KSCs. In this study, we determined the distribution of label-retaining cells to define
the human anagen bulge. Using navigated laser capture microdissection, bulge cells and outer root sheath
cells from other follicle regions were obtained and analyzed with cDNA microarrays. Gene transcripts
encod-ing inhibitors of WNT and activin/bone morphogenic protein signalencod-ing were overrepresented in the bulge,
while genes responsible for cell proliferation were underrepresented, consistent with the existence of
qui-escent noncycling KSCs in anagen follicles. Positive markers for bulge cells included CD200, PHLDA1,
fol-listatin, and frizzled homolog 1, while CD24, CD34, CD71, and CD146 were preferentially expressed by
non-bulge keratinocytes. Importantly, CD200
+cells (CD200
hiCD24
loCD34
loCD71
loCD146
lo) obtained from hair
follicle suspensions demonstrated high colony-forming efficiency in clonogenic assays, indicating successful
enrichment of living human bulge stem cells. The stem cell behavior of enriched bulge cells and their utility
for gene therapy and hair regeneration will need to be assessed in in vivo assays.
Introduction
Hair follicles are self-renewing structures that cycle and reconsti-tute themselves throughout life because they contain keratinocyte stem cells (KSCs) (1, 2). In 1990, Costarelis et al. (3) demonstrat-ed that, in rodent hair follicles, label-retaining cells (LRCs), the slowly cycling keratinocytes that represent KSCs (3–7), localize to a region of the outer root sheath (ORS) surrounding the rodent hair shaft termed the “bulge.” The bulge approximates the attach-ment site for the arrector pili muscle and marks the bottom of the permanent portion of the follicle during cycling (8). Accumulated evidence subsequently confirmed that, in rodents, the bulge is the repository of multipotent stem cells that support hair follicle cycling and repopulate interfollicular epidermis and sebaceous epithelium (6, 7, 9–11).
Although several lines of evidence have suggested that the human bulge also provides a niche for KSCs (12, 13), anatomic boundar- ies, biochemical distinctiveness, and global gene expression pat-tern are ill defined. In contrast to the bulge of murine follicles, which can easily be outlined as a discrete projection, the human
adult anagen bulge does not possess distinctive morphological fea-tures (12, 13). In addition, although genes that are upregulated in mouse bulge cells have been identified, including the cell-surface marker CD34 (7, 10, 14), genes whose expression is upregulated in human bulge keratinocytes remain to be determined. More-over, the elegant transgenic approaches that allow viable murine bulge cells to be isolated (7, 10) cannot be applied to humans. Although several groups have attempted to isolate human bulge cells by manual (15, 16) or laser capture microdissection (LCM) (17), accurate and efficient isolation of human bulge cells has not yet been reported. Consequently, isolation of living human bulge cells required development of new methods.
Exploring the biology of enriched KSC populations requires ready access to living bulge cells. Multipotent and highly prolific bulge cells may also be an important source of stem cells for cuta-neous regenerative medicine (18). For gene therapy purposes, ex vivo gene delivery to KSC-enriched bulge cells may facilitate long-lasting gene expression and correction of congenital skin and hair disorders (19, 20). Finally, a better understanding of human bulge cells may provide important insights into the biol-ogy of stem cells of other human epithelial tissues (21), as well as epithelial cancer stem cells.
The goal of the present study was to delineate the biological distinctiveness of human hair follicle bulge cells by analyzing bulge global gene expression patterns. Identification of sur- face proteins that might constitute candidate stem cell mark-ers was a specific focus of our data analysis. In this study, we developed methods to precisely identify the anatomical location of the human bulge region and then collected bulge ORS cells by navigated LCM (N-LCM). The global gene expression profile of bulge ORS cells was determined by microarray analysis and compared with that of other defined ORS cell subpopulations to identify genes that were differentially expressed in the bulge
Nonstandard abbreviations used: ANGPTL2, angiopoietin-like 2; BMP, bone mor-phogenic protein; BNC, bulge-negative cocktail; CDC2, cell division cycle 2, G1 to S and G2 to M; DCT, dopachrome tautomerase; DIO2, deiodinase, iodothyronine, type II; DKK3, Dickkopf homolog 3; EDNR, endothelin receptor; FST, follistatin; FZD1, frizzled homolog 1; GPM6B, glycoprotein M6B; KRT15, keratin 15; KSC, keratinocyte stem cell; LCM, laser capture microdissection; LRC, label-retaining cell; MAS, Affyme-trix Microarray Suite; N-LCM, navigated LCM; ORS, outer root sheath; PHLDA1, pleckstrin homology-like domain, family A, member 1; PRC1, protein regulator of cytokinesis 1; TOP2A, topoisomerase (DNA) II alpha 170 kDa; WIF1, WNT inhibitory factor 1.
Conflict of interest: The authors have declared that no conflict of interest exists.
area. By combining positive and negative selection markers iden-tified on bulge cells by microarray analysis and confirmed by immunohistochemistry, we enriched living human bulge cells and assessed their biological behavior in an in vitro colony-form- ing KSC assay. This report describes the systematic transcription-al profiling of human bulge cells and the first demonstration to our knowledge of directed enrichment of putative human hair follicle stem cells.
Results
Localization of LRCs defines the human anagen hair follicle bulge region. Our initial goal was to isolate the KSC-enriched cell population from the bulge area of human hair follicles and compare global gene expression patterns to those of other defined regions of human follicles. Since slow-cycling LRCs are believed to represent stem cells and to be located in the bulge area of rodent follicles (3, 5–7), we used the distribution of LRCs in human follicles to define the boundaries of the human bulge. For the detection of LRCs in human hair follicles, human scalp samples were trans-planted onto the backs of nude mice and labeled by continuous BrdU administration (13). After completing the 4- to 6-week label- ing and 10- to 12-week washout periods, xenografts were har-vested, and serial transverse (horizontal) sections were prepared to accurately localize LRCs. LRCs were detected in the outermost
layer of the ORS above the arrector pili muscle insertion point and below the sebaceous gland (Figure 1, A and B). Thus, the location of the sebaceous gland defines the upper border and the arrector pili muscle insertion point defines the lower border of the human anagen bulge (Figure 1, B and D). We subsequently determined that the anatomical location of LRCs in human follicles could be defined in frozen sections using the mAb C8/144 (cross-reactive to keratin 15 [KRT15]) (13); the anti-desmin mAb D33, which detects the arrector pili muscle; and the location of the sebaceous gland (Figure 1, C and D). C8/144B stained KRT15 in the outermost layers of the ORS below the upper level of the sebaceous gland, but the staining did not always extend inferiorly to the arrector pili muscle insertion point (Figure 1D). Since LRCs were present in the ORS at the level of the arrector pili muscle insertion site in the xenografting study (Figure 1B), the anti-desmin mAb D33 was necessary to identify the insertion point and define the lower boundary of the human bulge (Figure 1C). For the purpose of this study, the human bulge corresponds to the KRT15+
ORS extend-ing precisely from the region of the sebaceous gland to the arrector pili muscle insertion site (Figure 1D). Approximately 20% of ORS cells in the bulge region were LRCs.
Isolation of total RNA from bulge ORS cells and other well-defined regions using N-LCM. Immunohistochemical detection of BrdU in LRCs requires fixation and cellular permeabilization, and intact RNA cannot be accurately recovered from permeabilized LRCs for microarray analysis. To overcome this problem, human bulge cells and hair follicle cells from other well-defined regions (Figure 2A) were collected by an N-LCM approach from fresh frozen sections (22), and gene expression was analyzed by microarray analysis. Serial transverse sections of 5-mm scalp punch biopsy specimens from healthy volunteers contained approximately 40–50 anagen follicles per section. Since immunohistochemistry and quantita- tive recovery of intact RNA cannot be performed on the same sec-tion, every fifth serial frozen section was stained with C8/144B and D33 to determine which transverse sections contained bulge regions of anagen follicles. Only hair follicles with the character-istics described above were sampled. In addition, only intervening unstained sections that were known to contain bulge regions were used for N-LCM (Figure 2, B and C).
[image:3.585.47.283.82.445.2]This approach allowed the maximum number of ORS cells to be isolated from each bulge on each slide. The standard method for the histopathological evaluation of follicles in human scalp by vertical sectioning would not have permitted N-LCM–microarray analysis because most follicles would be cut tangentially, with far fewer bulge ORS cells available for N-LCM isolation. This approach was also used to sample other anatomical regions from serial sections of the same follicle (Figure 2A).
Figure 1
Human anagen hair follicle bulge is defined by the distribution of LRCs. (A) Vertical section of human hair follicle. (B) In xenografted human scalp tissue, BrdU-labeled LRCs (arrowheads) were predominantly detected in the outermost layer of ORS between the insertion point of the arrector pili muscle (APM) and the sebaceous gland (SG) level. (C) The distribution of LRCs in the human hair follicle defines the bulge and can be detected immunohistochemically (arrows) by the cocktail of antibodies containing C8/144B (cross-reactive to KRT15 in ORS) and D33 (anti-desmin). Asterisks in the transverse sections in both B and
In initial experiments, bulge ORS cells were isolated, and gene expression profiles were compared with those of the outermost layer of ORS cells just below the bulge (below the arrector pili muscle attachment; referred to as sub-bulge ORS hereafter) (Fig-ure 2A). Three scalp biopsy specimens from different volunteers were processed, and total RNA (11.5–24.7 ng) was isolated from each N-LCM–captured ORS subset.
Micorarray data analysis and the confirmation of differential gene expres-sion in bulge ORS at the protein level . Three pairs of bulge versus sub-bulge ORS GeneChips (Affymetrix HG-U133A; 22,283 probe sets) representing gene expression patterns in hair follicles from indi-vidual donors were analyzed. GeneChip data was of high quality, with 38.4% ± 2.3% of transcripts detected as present on arrays (23). The average correlation coefficient within GeneChips represent-ing individual subpopulations was 0.96 ± 0.01, indicating that the isolated cell populations were precisely defined and comparable.
To detect differentially expressed genes in the bulge area, we first analyzed and compared bulge versus sub-bulge ORS chips with 2 individual algorithms, Affymetrix Microarray Suite version 5.0 (MASv5.0) and dChip 1.3 (Supplemental Figure 1; supple-mental material available online with this article; doi:10.1172/ JCI26043DS1). By MASv5.0 analysis, genes that were over- or underrepresented in all 3 pairs with at least 1.3-fold change were selected for further analysis. Ninety genes (101 probe sets) were overrepresented in the bulge (Supplemental Table 1), while 110 genes (119 probe sets) were underrepresented (Supplemental Table 2). Using dChip analysis, a model-based expression index (MBEI) was calculated for each probe set (24), and differentially expressed genes were identified by comparison analysis. Using fil-tering criteria of fold changes in expression of at least 1.3 and P values for paired t test of less than 0.05, we identified 78 genes (85 probe sets) that were overrepresented in bulge ORS (Supplemental Table 3) and 106 genes (112 probe sets) that were underrepresent-ed (Supplemental Table 4). When MASv5.0 and dChip analyses
were compared, 27 common genes (36 probe sets) were detected as overrepresented and 43 common genes (56 probe sets) were identi-fied as underrepresented in the bulge ORS cells compared with the sub-bulge control ORS cells.
To identify transcripts that were selectively over- and underrep- resented in bulge ORS cells and not in other anatomical hair folli-cle locations, we performed additional sets of N-LCM–microarray experiments to determine the global gene expression patterns in ORS cells from the 2 different locations within the bulge, the upper bulge and the bulge ORS, and 3 different non–bulge ORS locations: the sub-bulge ORS, the ORS above the bulb (suprabul-bar ORS), and the inner layers of the ORS at the level of the bulge (inner-bulge ORS) (Figure 2A). By comparing gene expression pro- files from these different ORS locations, genes that were specifical- ly over- and underrepresented only in bulge ORS would be identi-fied. For example, 5 transcripts that were overrepresented in bulge ORS compared with sub-bulge ORS were also highly expressed in inner-bulge ORS and, thus, were not specific to bulge ORS. After removing such genes from the compiled list, we concluded that 21 transcripts (28 probe sets) were overrepresented (Table 1) and 37 genes (48 probe sets) were underrepresented (Table 2) selectively in the human hair follicle anagen bulge ORS cells (Supplemen-tal Table 5). Of note, KRT15 mRNA was overrepresented in bulge ORS cells, consistent with the increase in KRT15 protein detected in the region that we defined as the human anagen bulge (Table 1). The raw chip data files are available at http://www.ncbi.nlm.nih. gov/geo/query/acc.cgi?acc=GSE3419.
[image:4.585.57.533.79.272.2]To determine whether our microarray data accurately pre-dicted differences in protein expression, we performed immunohistochemistry and FACS analysis of human hair follicle samples and cells. Five proteins corresponding to overrepresented transcripts and 3 underrepresented transcripts (see Tables 1 and 2) were evaluated by immunohistochemical staining of transversely sectioned bulge and sub-bulge ORS regions of the same follicle. All
Figure 2
6 overrepresented proteins (KRT15; frizzled homolog 1 [FZD1]; follistatin [FST]; Dickkopf homolog 3 [DKK3]; WNT inhibitory factor 1 [WIF1]; pleckstrin homology-like domain, family A, mem-ber1 [PHLDA1]) and 2 of 3 underrepresented proteins (CD146; endothelin receptor [EDNR]) were differentially expressed in the bulge ORS as compared with the sub-bulge ORS cells (Figure 3A). In addition, localization of positive staining for KRT15, FST, FZD1, and PHLDA1 on vertical sections correlated well with the RNA expression patterns defined in the second N-LCM experi-ment (Supplement Figure 2). KRT15-, FST-, and PHLDA1-positive staining was limited to the outermost ORS. KRT15 and FST stain-ing extended beyond the defined bulge boundary, while PHLDA1 precisely localized to the defined bulge, providing the best single immunohistochemical marker for bulge ORS cells. FZD1 staining was globally expressed in the ORS but was most highly expressed in the defined bulge.
To facilitate isolation of living human bulge cells, we devel- oped a methodology to efficiently generate single-cell suspen-sions from the mid-portions of isolated hair follicles (mid-follicle suspension; see Methods). In an attempt to validate microarray data, we performed FACS analysis of a fixed mid-follicle suspen-sion with anti-KRT15 and -FST mAbs, since the anti-PHLDA1 mAb was not suitable for flow cytometry. As expected, KRT15- and FST-positive populations were detected in fixed mid-fol-licle cell suspensions, and KRT15hiFSThi cells were present,
suggesting they were derived from the bulge ORS (Figure 3B).
Immunohistochemical staining indicated that FST was more closely localized to the defined bulge (Supplemental Figure 2) than was KRT15. Consistent with this, fewer FST-positive cells were detected in mid-follicle suspensions than KRT15-positive cells. Thus, FST was selected as the best marker of bulge ORS cells in FACS studies of fixed mid-follicle suspensions.
Transcriptional profiles of the bulge ORS cells suggest a slow-cycling phenotype. Genes that were differentially expressed in human bulge regions were categorized with regard to their involvement in specific signaling pathways or biological processes (Figure 4). Overrepresented transcripts (Table 1) included those involved in WNT signaling (DKK3, WIF1, FZD1), activin/bone morphogenic protein (activin/BMP) signaling (FST), TGF-β signaling (TGFβ2) and organogenesis (KRT15; decorin [DCN]; dopachrome tautomerase [DCT]; glycoprotein M6B [GPM6B]; dihydropyrimidinase-like 2 and 3 [DPSYSL2 and DPSYSL3]; serine (or cysteine) proteinase inhibitor, clade F, member 1 [SERPINF1]). A growth factor (angiopoietin-like 2 [ ANG-PTL2]) and an enzyme for thyroid hormone activation (deiodinase, iodothyronine, type II [DIO2]) were also included. Of note, DKK3,
WIF1, and FST are inhibitors of signaling, and TGFβ2 is a nega-tive regulator of keratinocyte proliferation. Transcripts that were underrepresented included those corresponding to genes involved in cell division (tissue inhibitor of metalloproteinase 3 [TIMP3]; cell divi-sion cycle 2, G1 to S and G2 to M [CDC2]; vav 3 oncogene [VAV3]; protein regulator of cytokinesis 1 [PRC1]; glypican 4 [GPC4]; syndecan 2 [SDC2]) or DNA replication/repair (ribonucleotide reductase M2 polypeptide [RRM2]; flap structure-specific endonuclease 1 [FEN1]; topoisomerase (DNA) II alpha 170 kDa [TOP2A]; thymidylate synthetase [TYMS]) (Table 2). These observations are compatible with enrichment of slow-cycling cells in the bulge of human anagen follicles and the concept that this region represents a stem cell niche.
Identification of cell-surface markers for human hair follicle bulge cells. A major goal of our studies was to identify cell-surface markers for candidate stem cells in the human bulge. Putative bulge markers such as FST or PHLDA1 cannot be detected without fixation and thus cannot be used for enrichment and purification of living cells. The WNT receptor FZD1 was detected on human ORS and was over-represented in the bulge (Figure 3A and Supplemental Figure 2). Anti-FZD1 antibody reacted with 70% of all cells in fixed mid-fol-licle cell suspensions (Supplemental Figure 3A), and FZDhiFSThi
bulge cells were detected in FZD+ cell populations (Supplemental
Figure 3B). Unfortunately, anti-FZD1 antibody did not react with living ORS cells to a significant degree (Supplemental Figure 3C), suggesting that detection of the FZD1 epitope recognized by this antibody requires fixation. Thus, anti-FZD1 cannot be used for the isolation of living bulge cells.
We could not study other membrane proteins listed in Table 1, such as DIO2, GPM6B, and DCT, because appropriate anti-bodies were not readily available. Therefore, we reanalyzed the microarray data to identify additional candidate surface mark-ers for bulge cells. Differentially expressed genes identified by MASv5.0 and dChip algorithms were analyzed separately to increase the likelihood that membrane proteins that were selectively overrepresented in bulge ORS could be detected. We focused on CD antigens, because well-characterized antibodies that are useful for analytical and preparative flow cytometry already exist. Using this strategy, CD59 and CD200 were selected as proteins of interest for further studies.
Analysis of microarray data using dChip software revealed that
[image:5.585.53.275.112.425.2]CD59 was highly expressed in both bulge and sub-bulge ORS, but
Table 1
Genes selectively upregulated in the human anagen HF bulge
Gene dChip MAS
fold fold change change Trinucleotide repeat containing 9 (TNRC9) 5.01 23.90
DIO2 4.71 5.71
PHLDA1 3.56 3.80
ANGPTL2 2.78 2.95
WIF1 2.77 5.72
Regulated in glioma (RIG) 2.48 1.72 Dickkopf homolog 3 (Xenopus laevis) (DKK3) 2.45 4.65 Calcium/calmodulin-dependent protein 2.27 3.74 kinase ll (CaMKllNalpha)
Dihydropyrimidinase-like 2 (DPYSL2) 2.26 2.53
GPM6B 2.12 1.95
Dihydropyrimidinase-like 3 (DPYSL3) 2.08 2.37
Decorin (DCN) 1.97 2.15
Serine (or cysteine) proteinase inhibitor, 1.91 2.37 clade F, member 1 (SERPINF1)
Ca2+-dependent activator protein 1.87 2.12
for secretion 2 (CADPS2)
Transforming growth factor, beta 2 (TGFB2) 1.79 2.24
KRT15 1.75 2.07
Frizzled homolog 1 (Drosophila) (FZD1) 1.58 1.54 Nuclear factor of activated T cells, cytoplasmic, 1.51 1.39 calcineurin-dependent 1 (NFATC1)
FST 1.49 1.80
Calmodulin 1 (phosphorylase kinase, delta) 1.4 1.36 (CALM1)
Dopachrome tautomerase (dopachrome delta- 1.34 3.62 isomerase, tyrosine-related protein 2) (DCT)
its expression was 1.38-fold higher in bulge ORS than sub-bulge ORS (Supplemental Table 3). Using immunohistochemistry, we determined that CD59 was diffusely positive in ORS cells, although slight upregulation in bulge ORS was noticeable (Figure 5A). By FACS analysis, almost all viable FSThi bulge cells were also
CD59hi, but more than 80% of mid-follicle cells were also CD59+
(Figure 5A). Thus, CD59 has limited utility for selective enrich-ment of living bulge cells.
Expression of CD200 was determined to be increased 1.98-fold in bulge ORS as compared with sub-bulge ORS by MASv5.0 analy- sis (Supplemental Table 1). In addition, anti-CD200 mAb stain-ing was restricted to the outermost layer of the ORS between the arrector pili muscle insertion point and the level of the sebaceous gland, corresponding precisely to our defined bulge (Figures 5B and 6A). However, the antibody also stained the companion layer between the upper bulge and suprabulbar level. Approximately 15–20% of living mid-follicle cells were CD200 positive in flow cytometry experiments, and 40% of all CD200hi cells also expressed
the bulge marker FST (Figure 5B). Living CD200hi
cells in mid-follicle cell suspension were almost exclusively CD45lo and c-Kitlo,
indicating they were neither bone marrow–derived cells nor mela-nocytes (Supplemental Figure 4, A and B). In addition, CD200hi
mid-follicle cells expressed high levels of α 6 integrin (Supplemen-tal Figure 4C), a putative marker for KSCs (25). Thus, CD200 is a promising positive selector for living KSC-enriched bulge cells. Interestingly, approximately 1–2% of cells obtained from foreskins were CD200hi, and based on their CD45lo, c-Kitlo, and α6 integrinhi
phenotype, a subpopulation of those cells was presumably kerati-nocytes (data not shown).
Identification of negative CD markers for human hair follicle bulge cells. Additional microarray analysis identified the CD antigens CD24, CD34, and CD71 as surface proteins that were overrepresented in non-bulge ORS (in addition to CD146 described above; Figure 3A). The utility of these CD proteins as selectors for bulge ORS was evaluated by immunohistochemistry and FACS analysis.
In MASv5.0 analysis, CD24 RNA expression was remarkably upregulated in the inner-bulge ORS compared with other ORS regions (Supplemental Figure 5). Immunohistochemical analy-sis confirmed that CD24 protein expression was highest in the non-bulge inner ORS (including the companion layer) and clear-ly spared the outermost layer of bulge ORS (Figure 6A). FACS analysis of mid-follicle suspensions demonstrated that CD24hi
cells were distinct and nonoverlapping with FSThi bulge ORS
cells (Figure 6B). Thus, anti-CD24 negative selection might enrich for bulge ORS cells by selectively removing inner-layer ORS cells, including the CD200hi companion layer cells, from
mid-follicle suspensions.
CD34 expression is low or absent in human bulge ORS cells (absent in 2 of 3 bulge chips) and is most highly expressed in the suprabulbar ORS region (Supplemental Figure 5). Consistent with this, anti-CD34 antibody stained suprabulbar ORS but did not stain bulge ORS cells at or above the level of the arrector pili mus-cle insertion (Figure 6A). Moreover, FACS analysis of mid-follicle suspensions demonstrated that CD34hi cells were FSTlo, indicating
they were not bulge cells (Figure 6B). The expression of CD34, a marker for hematopoietic stem cells in humans (but not in mice), has been reported in mouse bulge cells (14), and the absence of CD34 expression in human bulge has been previously noted (26). Our data indicated that CD34 is not present on bulge ORS cells in human hair follicles.
[image:6.585.54.276.107.663.2]Decreased expression of CD71 was also detected by MASv5.0 analysis in 2 of 3 pairs of bulge versus sub-bulge ORS GeneChips. Additional GeneChip analysis demonstrated the highest level of expression of CD71 in suprabulbar ORS cells of human follicles (Supplemental Figure 5). By immunohistochemistry, CD71 was
Table 2
Genes selectively downregulated in the human anagen HF bulge
Gene dChip MAS
fold fold change change Cartilage oligomeric matrix protein (COMP) –4.87 –15.53
ANGPTL7 –3.03 –9.11
Tripartite motif-containing 9 (TRIM9) –2.72 –3.96 Aminolevulinate, delta-, dehydratase (ALAD) –2.62 –4.35 Protocadherin 8 (PCDH8) –2.6 –4.45 Tissue inhibitor of metalloproteinase 3 –2.39 –3.55 (Sorsby fundus dystrophy,
pseudoinflammatory) (TIMP3)
Nucleolar and spindle associated –2.33 –2.44 protein 1 (NUSAP1)
Platelet-derived growth factor C (PDGFC) –2.3 –2.81 Solute carrier family 4, sodium bicarbonate –2.19 –2.08 cotransporter, member 7 (SLC4A7)
Laminin, beta 1 (LAMB1) –2.11 –2.47 Ets variant gene 5 (ets-related molecule) (ETV5) –2.04 –2.59
CDC2 –2.04 –2.73
Phospholipase A2, group IVA –2.02 –2.01 (cytosolic, calcium-dependent) (PLA2G4A)
PRC1 –1.88 –1.64
Glypican 4 (GPC4) –1.88 –2.13 Ribonucleotide reductase M2 –1.87 –1.91 polypeptide (RRM2)
Vav 3 oncogene (VAV3) –1.83 –1.71 ZW10 interactor (ZWINT) –1.83 –1.96 Phosphorylase, glycogen; liver (Hers disease, –1.82 –2.20 glycogen storage disease type VI) (PYGL)
Syndecan 2 (heparan sulfate proteoglycan 1, –1.81 –2.59 cell surface-associated, fibroglycan) (SDC2)
Karyopherin alpha 2 (RAG cohort 1, –1.79 –1.97 importin alpha 1) (KPNA2)
Protein phosphatase 1, regulatory –1.79 –2.15 (inhibitor) subunit 3C (PPPR3C)
Flap structure-specific endonuclease 1 (FEN1) –1.76 –1.54 Retinoic acid induced 14 (RAI14) –1.76 –1.84
TOP2A –1.76 –6.10
Solute carrier family 1 (glutamate/neutral –1.75 –1.76 amino acid transporter), member 4 (SLC1A4)
Fibroblast growth factor 18 (FGF18) –1.68 –3.72 Thymidylate synthetase (TYMS) –1.65 –1.49 Rac GTPase activating protein 1 (RACGAP1) –1.64 –2.07 Collagen, type XI, alpha 1 (COL11A1) –1.63 –2.28 Melanoma cell adhesion molecule –1.59 –1.90 (CD146) (MCAM)
Latent transforming growth factor –1.59 –1.71 beta binding protein 2 (LTBP2)
consistently expressed below the sub-bulge level of ORS (Figure 6A). In addition, CD71hi cells were FSTlo
in FACS analysis of mid-fol-licle cells, indicating that CD71hi cells are distinct from bulge ORS
cells (Figure 6B). Reduced expression of CD71 along with high expression of α6 integrin has been reported to be a property of KSCs (25). Thus, CD71 could also be used as a negative marker for human bulge cells. Overrepresentation of CD146 in sub-bulge ORS had already been confirmed immunohistochemically (Figure 3A and Figure 6A), and, as expected, CD146hi cells were FSTlo in FACS
analyses of mid-follicle suspensions (Figure 6B).
Thus, a cocktail of CD24, CD34, CD71, and CD146 mAbs (bulge-negative cocktail [BNC]) could be used to remove non-bulge cells in living mid-follicle suspension, including CD200hi cells located
in the companion layer (Figure 5B and Figure 7A).
Enrichment of living human hair follicle bulge cells by selection with posi-tive and negaposi-tive cell-surface markers. Human bulge cells have been reported to be highly proliferative in in vitro assays, with higher col-ony-forming efficiency than other follicle cells (16). To determine whether selection using the positive and negative markers described above could enrich for living human bulge cells with stem cell prop-erties, cells were isolated from a mid-follicle cell suspension and analyzed for their colony-forming efficiency (Figure 7A).
On average, 26.4% ± 2.0% of living mid-follicle cells were stained with BNC (Figure 7B). First, BNChi
cells were removed from mid-follicle suspension by magnetic bead negative selection. Then, CD200hi cells were positively selected with magnetic beads.
CD59, which is diffusely expressed in ORS cells (Figure 5A), was used as a control for the magnetic bead isolation procedure. Microscopic observation and FACS analysis demonstrated that isolated living CD200hiBNClo
cells were morphologically uni- form, relatively compact, and round when compared with unfrac-tionated mid-follicle or CD59hi cells (Supplemental Figure 6,
A and B). When identical numbers of living cells were seeded onto irradiated NIH 3T3 feeder layers, CD200hiBNClo cells formed
significantly more colonies than mid-follicle cells (Figure 7C). The average increase observed in colony-forming efficiencies in CD200hiBNClo cells as compared with mid-follicle cells was
2.0-fold (Figure 7D). These results demonstrate that hair fol-licle cells with a CD200hiCD24loCD34loCD71loCD146lo surface
phenotype are enriched for cells with KSC properties.
Discussion
[image:7.585.46.543.84.358.2]In this study, we localized LRCs in human anagen hair follicles, thereby defining the human bulge as an identifiable region of the ORS. Thereafter, we designed and implemented a strategy to iso-late intact RNA from anatomically distinct regions (including the bulge ORS) by N-LCM of transverse sections of human scalp fol-licles. GeneChip microarray studies provided a 3D view of global
Figure 3
gene expression patterns in human hair follicles, enabling identi-fication of genes that were differentially and selectively expressed in the bulge ORS. To the best of our knowledge, this is the first description of global gene expression patterns in the KSC-enriched bulge and other regions of human follicles.
We are aware that although captured bulge ORS cells were enriched for LRCs, they do not represent a pure population of KSCs or even LRCs. Thus, some overrepresented genes may not be expressed in KSCs, and some genes that are selectively
upregulated in KSCs may not have been detect- ed. In addition, although keratinocytes predom- inate in the bulge, other cell types such as mela-nocyte stem cells (27) or Merkel cells (28) are also reported to reside in this area, and upregulation of a gene in bulge ORS could reflect highly ele-vated gene transcription in non-keratinocytes. For example, overrepresentation of DCT , a mela-nocyte lineage marker (29), in the bulge ORS may reflect presence of melanocyte stem cells or progenitor cells in the bulge region.
Immunohistochemical confirmation of dif-ferential protein expression predicted from microarray analyses validated our approach. Interestingly, subtle differences in mRNA expres-sion resulted in marked differences in protein expression, a finding observed with regard to FST
expression, for example. Recent microarray stud-ies have employed quantitative RT-PCR to confirm the accuracy of microarray data. Considering that Affymetrix microarrays tend to underestimate gene expression differences (10, 30), validation of microarray data at protein level appears to be critical.
Transcripts overrepresented in the human bulge include genes of important biological pathways. The WNT signaling pathway plays an important role in hair follicle morphogenesis and cycling (2, 31), being activated at anagen onset (32, 33). Increased expression of the WNT inhibitors WIF1 and DKK3 in the bulge ORS during anagen is consistent with the anticipated quiescent state of hair follicle stem cells. Activin/BMP signaling and TGFβ/BMP signaling pathways also regulate hair follicle development and cycling (19, 34, 35). The activin/BMP signaling antagonist FST was selectively overrepre-sented in the bulge ORS. The blockade of activin signaling by FST may also promote maintenance of KSC quiescence.
Several genes upregulated in the bulge may promote survival of bulge ORS cells and KSCs. PHLDA1 was preferentially local- ized in the bulge ORS cells both at the mRNA and protein lev-els and has been reported to mediate the effects of insulin-like growth factor 1 and prevent apoptosis (36). The expression of
[image:8.585.47.284.81.250.2]DIO2, which was significantly elevated in bulge ORS (MASv5.0,
Figure 4
Summary of the genes differentially expressed in the human anagen hair follicle bulge ORS.
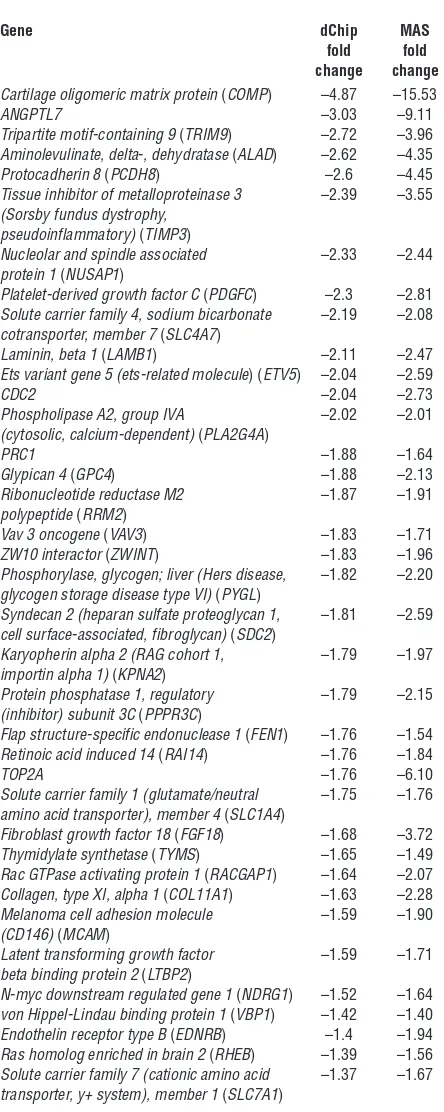
Figure 5
CD59 and CD200 are expressed in human anagen hair follicle, and CD200 is a positive cell-surface marker for the bulge ORS cells. (A) Immunohisto-chemically, CD59 was globally expressed at all ORS levels (vertical section) and upregulated in the bulge ORS (transverse sections). Scale bars: 50 µm. In FACS analysis, most mid-follicle cells were CD59+,
and FSThi bulge cells were CD59+ (CD59
stain-ing prior to fixation). (B) CD200 was preferentially expressed on the defined bulge ORS and the com-panion layer of human anagen hair follicles. Scale bars: 50 µm. By FACS analysis, CD200 was detect-able on the mid-follicle cells, and approximately 40% of CD200hi cells were FST-double-positive bulge
[image:8.585.239.540.390.739.2]5.71-fold; dChip, 4.71-fold), enhances the local bioavailability of 3,3′,5-triiodothyronine, an active form of thyroid hormone (37), and the hair loss associated with hypothyroidism suggests that upregulation of DIO2 may play an important role in supporting human bulge ORS cells. Another upregulated transcript, angio-genic factor ANGPTL2 , may also support development of vascu-lature and nutrition of bulge ORS cells (38).
Many of the transcripts that are underrepresented in bulge ORS cells are involved in cell cycling or DNA replication/repair, such as CDC2, PRC1, and TOP2A. High-level expression of these genes in slow-cycling KSCs would not be expected. Most of the bulge-underrepresented genes were expressed in a gradient that increased from the sub-bulge to the suprabulbar ORS, consis- tent with the active proliferation that occurs in the lower por-tion of the anagen follicle.
Upregulation of WNT and TGFβ/BMP pathways was a common characteristic of human bulge and mouse bulge cells (summarized in Supplemental Tables 1 and 3) (7, 10), supporting our conten-tion that the defined bulge region is also the stem cell niche in human hair follicles. On the other hand, elevation of DIO2 and
ANGPTL2 were only observed in human bulge. In addition, a number of genes were divergently regulated in mouse bulge and
human bulge. These include latent TGFβ binding protein 2, FGF18, and, importantly, CD34 (7, 10, 11). Divergent CD34 expression has also been noted on murine and human hematopoietic stem cells, with high levels expressed on human stem cells and barely detect-able levels present on murine hematopoietic stem cells (39). These findings suggest that important structural and/or biological dif-ferences between human and mouse bulge ORS may exist.
[image:9.585.88.502.84.402.2]It has been reported that application of different bioinfor-matic algorithms to the same microarray data can yield quite different outcomes (40). In fact, we observed that only about 25–40% of differentially expressed genes were detected by both algorithms (MASv5.0 and dChip 1.3; Supplemental Figure 1). Combining different algorithms to analyze microarray data (10) may provide greater confidence that detected differences are meaningful. However, such an approach does risk missing important biological findings. For example, with the exception of CD146, none of the bulge-positive or -negative markers that we ultimately utilized were predicted when both algorithms were combined. By reanalyzing microarray data and focusing on membrane proteins, we eventually found CD200 as the best positive marker and CD24, CD34, CD71, and CD146 as useful negative selection markers for human bulge ORS cells.
Figure 6
Expression of CD200 has previously been detected in the mouse hair follicle ORS (10, 41), but to our knowledge, its expression in human hair follicles has never been described. Microarray analy-sis of mouse bulge cells suggested the upregulation of CD200 at the mRNA level (10). However, at the protein level, CD200 was predominantly detected in the outermost layer of ORS through-out the length of the mouse hair follicle and did not localize in the bulge area (41). CD200 is a type-1 transmembrane glycopro-tein that delivers a negative immunoregulatory signal though the CD200 receptor (CD200R) (42, 43). CD200-CD200R interac- tion is thought to play a role in restricting tissue-specific auto-immunity (44). When CD200–/– mouse skin was grafted onto
wild-type mice, dense inflammation developed around grafted hair follicles and led to hair loss, suggesting that CD200 may be involved in maintaining immune tolerance or regulating some other aspect of inflammation (41). Expression of CD200 by human bulge cells may play a crucial role in affording immune privilege to KSCs and other supporting cells. Presence of CD200 may also explain why the bulge area is well protected from inflammation that impinges on follicles in alopecia areata, an autoimmune disease that results in hair loss. CD200 mRNA has also been detected in human foreskin epidermis, but the pres-ence of CD200 protein has not been demonstrated (41). We have identified a small subpopulation (∼2%) of CD200+CD45–c-Kit–
cells in human neonatal foreskin (data not shown), and charac-terization of these cells is in progress.
Among bulge-negative markers, CD24 may be especially impor-tant for the bulge cell enrichment because it facilitates removal of CD200-positive cells that are also present in the companion layer. CD24 is a glycoprotein that is thought to be involved in cell adhe-sion and signaling in lymphocytes or neural cells and that has
been reported to be expressed in human follicle ORS and inter-follicular epidermis (45). CD24-positive epidermal cells were not clonogenic (45), supporting the use of this marker for negative selection in bulge cell preparation. In addition, the observation that CD24-negative cells in breast cancer epithelium contained cancer stem cells (46) is consistent with downregulation of CD24 in the hair follicle stem cell niche.
Enrichment of human KSCs by isolation of CD200hiBNClo bulge
cells was supported by the following observations. First, CD200hi
cells represented a fraction of α6 integrinhi
cells in mid-follicle sus-pension. Consequently, CD200hiBNClo bulge cells should be α6
integrinhiCD71lo, a cell-surface phenotype previously suggested
for putative KSCs (25). Second, isolated bulge cells were relatively small and round, additional proposed KSC characteristics (25, 47). Finally, isolated bulge cells demonstrated high colony-forming efficiency (10, 11, 15).
The isolated CD200hiBNClo cells exhibited a 2-fold increase
in colony-forming efficiency compared with mid-follicle cells, a seemingly modest enrichment of clonogenic KSCs. However, mid-follicle suspensions were generated from mechanically dis-sected middle portions of hair follicles that were subsequently trypsinized, and bulge ORS cells are already enriched in this pop- ulation, representing about 10–20% of all living cells in mid-fol-licle suspensions. Efficient generation of single-cell suspensions from intact hair follicles without compromising cell viability has not yet been possible. Thus, the colony-forming efficiencies of CD200hiBNClo bulge cells cannot be compared directly with those
of hair follicle keratinocytes.
New insights into hair follicle biology that result from our work may also facilitate development of novel therapies for impor- tant dermatologic disorders. Accumulation of human hair fol-licle microarray data may also lead to an understanding of how upregulated gene products such as DKK3, WIF1, and FST could be used for the maintenance of isolated bulge cells ex vivo, an important requirement for regenerative medicine. Growth fac-tors that are upregulated in suprabulbar ORS (e.g., FGF18 and PDGFC) may enhance hair shaft growth and may have therapeu-tic efficacy in alopecia. Thus, the precise transcription profiles of human ORS subsets obtained in this study, together with the cell surface markers of bulge ORS cells that we identified, should be useful tools for studies of human hair follicles and epidermal stem cell biology as well as regenerative medicine.
Methods
[image:10.585.50.281.82.369.2]Human scalp samples. For N-LCM–microarray study, 5-mm punch biopsy samples (n = 5, 1 sample per healthy volunteer) were taken from the tem-poral region of the scalp and immediately embedded into OCT compound
Figure 7
Selection for CD200+ highly clonogenic living human hair follicle bulge
cells. (A) The expression pattern of CD200 (orange) and CD24, CD34, CD71, and CD146 (light green) in the mid-portion of the human hair follicle. Antibodies against CD24, CD34, CD71, and CD146 constituted the BNC. The panel on the upper left demonstrates an example of the mid-portion of a hair follicle freshly isolated from a human scalp sam-ple. (B) FACS analysis of mid-follicle cell suspension with anti-CD200 antibody and BNC (living 7-AAD–negative cells were gated). (C and
D) Isolated CD200hiBNChi bulge cells formed a greater number of
(Sakura Finetek Co.) at –80°C until sectioned. For mid-follicle suspension, surgical scalp specimens were kept at 4°C in DMEM (Invitrogen Corp.) containing antibiotics (Cambrex) for no more than 3 days. Protocols for processing human specimens were approved by the Institutional Review Board of the National Cancer Institute.
Detection of LRCs in human hair follicles. To define the precise distribution of LRCs in human anagen follicles, full-thickness human scalp tissues were grafted onto nude mice and labeled with BrdU. All animal experiments were approved by the Animal Care and Use Committee of the National Cancer Institute. Three weeks after grafting, 2 ALZET osmotic pumps (model 1002; DURECT) were implanted subcutaneously every 2 weeks, and 100 µM BrdU solution was delivered continuously for 4–6 weeks at 0.4 mg/d (total dose, 11.2–16.8 mg). The grafts (n = 4) were harvested after a 10- to 12-week chase period. Frozen serial transverse sections were stained for BrdU with anti–BrdU-peroxidase Fab fragments (Roche Diagnostics Corp.) according to previously described techniques (48).
Immunohistochemical staining. To detect the LRC distribution, frozen scalp biopsy sections were defrosted, air dried for 3 hours, and fixed with acetone for 10 minutes at –20°C. They were then incubated with a 2:1 cocktail of mouse C8/144B mAb (cross-reacts with KRT15; DakoCytomation) and mouse anti-human desmin D33 mAb (DakoCytomation) for 2 hours, fol-lowed by staining with the EnVision peroxidase system (DakoCytomation). To confirm microarray results, we used mouse anti-human FST and rat anti-mouse/human FZD1 mAbs (clone 85918 and clone 162531; R&D Sys-tems), mouse anti-human PHLDA1 mAb (clone 2X113; Novus Biologicals Inc.), goat anti-human WIF1, DKK3, and EDNR polyclonal Abs (cross-reactive to type A and B) (sc-15666, sc-14959, and sc-21194; Santa Cruz Biotechnology Inc.), mouse anti-human CD146 (clone P1H12; Chemicon International), CD24, CD34, CD71 (clone ML5, 563, M-A712; BD Biosci-ences — Pharmingen), and CD59, CD200 mAbs (clone MEM-43, MRC OX104; Serotec). Human scalp sections were air dried for 1 hour, fixed with acetone at –20°C, and incubated with primary antibodies (diluted 1:10–1:500) for 1.5–4 hours at room temperature or overnight at 4°C. Sub-sequent reactions were performed using a mouse or goat ImmunoCruz staining system (Santa Cruz Biotechnology Inc.) with DAB as an HRP sub-strate. Slides were mounted with Permount or Crystal/Mount (Biomeda Corp.) and photographed with a microscope (Axioskop; Zeiss) connected to a digital camera system (DEL-750; Optronics). All experiments were per-formed at least twice using specimens from different individuals.
Transverse serial sectioning for LCM. Scalp biopsy samples (n = 5) were embedded into OCT compound and, beginning on the subcutaneous side, 8-µm frozen serial transverse sections were prepared from each sample using a cryostat thoroughly wiped with RNase AWAy (Molecular BioProd- ucts) and 100% ethanol. Collection of tissue slices started when the major-ity the hair follicles on the section were at the suprabulbar level. With every second tissue slice collected, 100 serial sections encompassed the suprabul-bar area to the upper isthmus of hair follicles.
N-LCM and RNA isolation. A N-LCM approach developed by Wong et al. (22) was modified to avoid mRNA degradation during LCM. Every fifth section was stained with C8/144B and D33 mAbs (guiding sections), while the 4 intervening sections were kept at –80°C to preserve RNA integrity. Guiding sections were individually photographed to generate serial navi- gation maps for LCM. Each individual follicle was traced from the supra-bulbar to upper isthmus, and the anatomical level of each anagen follicle was determined based on the staining pattern. When a hair follicle on 2 consecutive guiding sections satisfied the bulge criteria, the 4 intervening sections of the same follicle were used to isolate bulge cells.
In the first set of N-LCM experiments (n = 3), the 10 serial slides with the highest number of bulge-containing hair follicles (19–30 follicles/slide) were selected using the navigation maps, and the defined bulge ORS cells
on unstained sections (8 sections) were LCM captured from selected fol-licles (Figure 2C). The cells in the outermost layer of ORS just below the insertion point of arrector pili muscle (sub-bulge ORS) were also collected from the same selected hair follicles.
In the second N-LCM experiment, the anatomical location of the serial section was determined by the level represented by the majority of fol-licles on the stained guiding sections, and the desired ORS subsets were captured from the 4 intervening sections (40–50 follicles/slide). ORS cell populations collected were: those of the outermost layer of ORS on the upper border of bulge (upper-bulge ORS); the main body of bulge; the sub-bulge ORS (as defined above); the outermost layer of ORS just above the bulb (suprabulbar ORS); and the inner layers of ORS at the bulge level (inner-bulge ORS) (Figure 2A).
All N-LCM sections were stained with HistoGene LCM frozen sec-tion staining kit (Arcturus) according to the manufacture’s protocol and kept desiccated until used. The target ORS cells were captured with PixCell ll system using Capsure LCM Macro caps (Arcturus). The laser spot size was 7.5 µm. Pulse power was 75–100 mW, and pulse width was 1.0–1.8 ms, depending on the LCM condition. Total RNA was isolated from the captured cells by Picopure RNA isolation kit (Arcturus) and DNase digestion (QIAGEN).
Microarray generation. RNA quality and quantity were assessed with an Agilent 2100 bioanalyzer and a RNA 6000 Pico LabChip kit (Agilent Technologies). We used a T7-primer–based 2-round linear RNA ampli-fication protocol: GeneChip Eukaryotic Small Sample Target Labeling Assay Version II (https://www.affymetrix.com/support/downloads/man-uals/expression_s2_manual.pdf, equivalent to the GeneChip Two-Cycle cDNA Synthesis kit; Affymetrix). Fifteen micrograms of biotin-labeled cRNA from each individual sample was fragmented and first hybridized with Affymetrix T3 test array for quality assessment and then rehybrid-ized to an Affymetrix high-density oligonucleotide array for human genes (HG-U133A containing 22,283 probe sets). All arrays were stained, washed, and scanned following the manufacturer’s protocol.
differentially expressed both by MAS and dChip were obtained by com-piling the results of 2 analyses. Then, individual genes were evaluated for their RNA expression pattern in different follicle regions by a second N-LCM data set analysis. Upper-bulge, bulge, inner-bulge, sub-bulge, and suprabulbar GeneChips were normalized by MAS according to the described parameters. Genes that had the highest expression in either inner-bulge or suprabulbar ORS or in either upper-bulge or inner-bulge chips were removed from the bulge upregulated or downregulated gene list, respectively, to obtain the final list of the genes specifically up- or downregulated in bulge ORS. The function and ontology of listed genes were assessed by Entrez Gene (http://www.ncbi.nlm.nih.gov/entrez/ query.fcgi) linked with GOA@EBI (http://www.ebi.ac.uk/GOA/). The raw chip data files are available at http://www.ncbi.nlm.nih.gov/geo/ query/acc.cgi?acc=GSE3419.
Preparation of cell suspensions from the mid-portion of human hair follicles (mid-follicle suspensions). Scalp tissue (approximately 5–6 cm2) was washed
with PBS 3 times to remove clots. Hairs were shaved, and the epider-mis and subcutaneous fat were removed using a scalpel. The remaining dermal tissue contained the mid-portion of hair follicles between the isthmus and suprabulbar area. The tissue was cut into several pieces and incubated overnight in 1:1 mixture of HBSS (Invitrogen Corp.) and dispase (BD Biosciences) at 4°C. After washing with PBS, individual follicles were gently pushed out the scalp with fine forceps. Isolated follicles were incubated with 0.05% trypsin (USB) at 37°C for 45 min-utes and neutralized by an equivalent volume of PBS containing 0.05% DNase (Sigma-Aldrich)/5% FBS and HBSS. After filtering the suspen-sion 2 times through 100 µmnylon mesh filters, mid-follicle cells were collected by centrifuging at 200 g for 5 minutes and resuspending in PBS containing 5% FBS (mid-follicle suspension).
FACS analysis of mid-follicle suspensions. Unless noted, FACS analysis of the mid-follicle suspension utilized the same mAbs described above for immunohistochemistry. Hair follicle cells were incubated with primary antibodies for 20 minutes at 4°C and washed. If primary antibodies were not directly conjugated, hair follicle cells were incubated with secondary antibodies such as the FITC-conjugated mouse anti-rat IgG1/2a mAb (BD Biosciences — Pharmingen) or PE-conjugated rat anti-mouse IgG1 or IgG2a+b mAb (BD Biosciences — Immunocytometry Systems) for another 20 minutes. For double staining with bulge markers, PE-stained cells were fixed and permeabilized with Cytofix/Cytoperm buffer (BD Biosciences — Pharmingen), washed and incubated with Alexa Fluor 488–conjugated mouse anti-human KRT15 (clone LHK15; Lab Vision Corp.) or FST antibodies for 30 minutes at room temperature. Zenon mouse IgG2a labeling kit (Invitrogen Corp.) was used for the conjugation of Alexa Fluor 488 to those antibodies. Mouse anti-human CD24 (clone SN3; Serotec) and CD71 (clone DF1513; Lab Vision Corp.) mAbs were used for this double staining analysis. Purified FITC- or PE-conjugated rat IgG2a (CALTAG Laboratories), mouse IgG1, and mouse IgG2a (BD Biosciences) were used as the isotype controls. The stained follicle cells were incubated with 7-AAD (BD Biosciences —Pharmingen) and analyzed with a FACSCalibur flow cytometer equipped with CellQuest software (BD Biosciences) for 10,000–25,000 events.
Isolation of bulge cells with magnetic beads systems. Two magnetic beads systems were combined to isolate bulge ORS cells from the mid-follicle
suspension. First, hair follicle cells were stained with the cocktail of PE-conjugated anti-human CD24, CD34, CD71, and CD146 antibodies (BNC) for 20 minutes at 4°C. After washing, follicle cells were incubated with anti-PE microbeads (Miltenyi Biotec) for 25 minutes at 4°C. Then, PE-positive non-bulge cells were removed with the magnetic separations using mini-MACS MS columns (Miltenyi Biotec). The removal proce- dures were repeated 3–5 times to ensure maximum depletion. Next, mid-follicle cells were incubated with purified anti-human CD200 mouse mAb at 4°C for 20 minutes, washed, and incubated with Dynabeads M-450 sheep anti-mouse IgG magnetic beads (Dynal Biotech) at 4°C for 30 minutes with tilting. Then, positive selection was performed with MPC-L magnetic particle concentrator (Dynal Biotech) to obtain CD200-positive cells. CD59-positive cells were similarly collected as the positive selection control.
Colony-forming assay. To determine whether CD200+ hair follicle cells
had a higher colony-forming efficiency than control mid-follicle sus-pension cells, we performed an in vitro colony-forming assay originally described by Rheinwald and Green (49). Equivalent numbers of living CD200+BNC– bulge cells and mid-follicle cells (5,000 cells/flask) were
prepared and seeded into T-25 flasks (Corning) onto a lethally irradiated NIH 3T3 cell feeder layer. Hair follicle cells were cultured in a 3:1 mix-ture of DMEM and Ham’s F12 medium (Invitrogen Corp.) supplemented with 10% FBS, 180 µM adenine, 5 µg/ml insulin, 0.5 µ g/ml hydrocor-tisone, 0.1 nM cholera toxin (Sigma-Aldrich), and 10 ng/ml epidermal growth factor (Invitrogen Corp.) for 2 weeks. The colonies were fixed with paraformaldehyde (Electron Microscopy Sciences) and stained with the 1:1 mixture of Rhodamine B and Nile blue sulfate solution (Sigma-Aldrich), and the number of colonies was counted for each individual flask and analyzed with Excel software (version 11.0 for Macintosh; Microsoft). Experiments were performed in triplicate and repeated 3 times, using scalp samples from different individuals.
Statistics. For this assay, 2-tailed Student’s t test was used. A P value less than 0.05 was considered statistically significant.
Acknowledgments
We thank Maria C. Turner, Laura Musse, and Susan Boohner of the Dermatology Branch, Center for Cancer Research (CCR), National Cancer Institute (NCI), NIH, for their help in the vol-unteer recruitment and scalp biopsies; and Leonard C. Sperling of the Uniformed Services University of the Health Sciences for many helpful discussions and suggestions. We also thank Jana Koeppl-Ritter and all the staff of the Center for Cosmetic Sur- gery for their help in sample collection. This research was sup-ported by the Intramural Research Program of the NIH, NCI, CCR. M. Ohyama received financial support from the Uehara Memorial Foundation.
Received for publication June 22, 2005, and accepted in revised form October 11, 2005.
Address correspondence to: Jonathan C. Vogel, Dermatology Branch, Center for Cancer Research, National Cancer Institute, National Institutes of Health, Building 10 Room 12N238, 10 Cen-ter Drive, MSC 1908, Bethesda, Maryland 20892, USA. Phone: (301) 496-9002; Fax: (301) 496-5370; E-mail: jonvogel@mail.nih.gov.
1. Paus, R., and Cotsarelis, G. 1999. The biology of hair follicles. N. Engl. J. Med. 341:491–497. 2. Fuchs, E., Merrill, B.J., Jamora, C., and DasGupta,
R. 2001. At the roots of a never-ending cycle. Dev. Cell. 1:13–25.
3. Cotsarelis, G., Sun, T.T., and Lavker, R.M. 1990. Label-retaining cells reside in the bulge area of
pilosebaceous unit: implications for follicular stem cells, hair cycle, and skin carcinogenesis. Cell.
61:1329–1337.
4. Bickenbach, J.R., McCutecheon, J., and Mackenzie, I.C. 1986. Rate of loss of tritiated thymidine label in basal cells in mouse epithelial tissues. Cell Tissue Kinet. 19:325–333.
5. Morris, R.J., and Potten, C.S. 1999. Highly per-sistent label-retaining cells in the hair follicles of mice and their fate following induction of anagen.
J. Invest. Dermatol. 112:470–475.