Preventive Maintenance and Breakdown Reduction of Critical
Machines
Sathish Kumar .N
1, Dr.H.Yogish
2,
1
PG student, M .Tech (Maintenance Engineering) SJCE, Mysuru Karnataka, India
2
Associate Professor Dept. of Mechanical Engineering, SJCE, Mysuru Karnataka, India
---***---Abstract -
Manufacturing industries are facing a greatercompetition in the market because of various factors like technology, standardization, quality, etc. to name a few. This drives companies to work hard on systems of the company to improve and increase both quality and productivity continuously. One of the ways to increase the productivity is to increase the availability of existing machines. More the machine availability more is the scope for increase in productivity keeping other functional aspects of management is rest assured. Total productive maintenance (TPM) aims to increase the availability of existing equipment.TPM can be defined in terms of overall equipment effectiveness (OEE). Availability of machines can be increased by reducing the downtime or breakdowns of the machines. Main objective is to improve the machine performance by finding out the major breakdowns causing production losses to the company and arriving & executing the counter measures by which these problems can be reduced.
In this project, preventive maintenance and a breakdown reduction methodology is adopted to improve the machine performance. Root cause analysis is conducted to find the root cause of breakdowns and some parallel improvement opportunities were also identified for implementation so as to reduce the downtime. The project thus aims to minimize downtime, maximize availability, minimize maintenance cost and maximize profit. The project work concludes that this will help the maintenance department to increase equipment availability. Finally suggestion was given for future work.
Key Words
:
Preventive Maintenance, Total Productive Maintenance, Overall Equipment Effectiveness, Breakdown Reduction Methodology, Root Cause Analysis, Downtime.
1.
INTRODUCTION
[1]Machine maintenance is gaining importance in industry because of the need to increase reliability and to decrease the possibility of production loss due to machine breakdown. Schedule preventive maintenance reduces the regular breakdowns and increases the availability of machine. [2]Maintenance is an activity to ensure that equipment is in a satisfactory condition and reliable. The goal of maintenance is to ensure that equipment is satisfactory. [4]There is an intense need for manufacturing industries to reduce unexpected breakdowns and remain
competitive, and motivating maintenance operations should be integrated into production scheduling models.
Dew (1991) and Sproull (2001) state that identifying and eliminating root causes of any problem is of utmost importance .Root cause analysis is the process of identifying causal factors using a structured approach with techniques designed to provide a focus for identifying and resolving problems .tools that assist groups and individuals in identifying analysis tools (3).
Maintenance literature is rich with studies concerning the development and implementation of mathematical models for maintenance planning in deteriorating systems. Surveys conducted by authors (4), and an in-depth mathematical analysis by (5), comprehensively document the various approaches to modelling maintenance. Many researchers have developed models to address systems that operate continuously, as well as system that operates intermittently. The latter case assumes the system to age or deteriorate only durin
g the
operating periods (6).
This project deals with the identifying the critical machines of an automotive plant based on production, quality, environment and safety criteria. Troubleshooting on critical machines which has the highest breakdown hours and breakdown occurrence, In this project, preventive maintenance and breakdown reduction methodology is adopted to improve the machine performance.
Root cause analysis is conducted to find the root cause of breakdowns and some parallel improvement opportunities were also identified for implementation so as to reduce the downtime. Few points were added in the preventive maintenance checklist. The availability is increased considerably following the breakdown reduction & preventive maintenance methodology. The main objective of the project is to minimize downtime and maximize availability of the machines.
1.1 Methodology of Work
breakdown occurrence, MTTR, MTBF are collected & studied.
Selecting the critical machine i.e., “Shot Blast & Cold Swage for the analysis.
Studying the type of failures occurred & frequently repeating failures.
Following the breakdown reduction methodology.
Performing root cause analysis to reduce the recurrence of failures.
Performing WHY-WHY analysis.
Replace the defective parts of the machine.
Implementing the corrective steps.
Monitoring and verifying the results
2
. ROOT CAUSE ANALYSIS & IMPLEMENTATION
1. Break down Description– Component is not moving
Root cause – Rollers getting jammed
Physical phenomenon –Roller End support bearing jammed
Root Cause from Why-Why Analysis
Corrective counter measure –
Roller bearing is greased during preventive maintenance
Roller bearing plate is tightened
Plumber block bearing is replaced
Benefits/Results after implementation- Roller end support bearing are free from getting jammed; now the roller is rotating & components are moving.
2. Break down Description– Table tilting is not working
Root cause – Limit switches not working
Physical phenomenon – Limit switch cable got cut
Root Cause from Why-Why Analysis
Corrective counter measure –
Table tilting Limit switches all no’s not working
Cable to be checked & replaced.
Problem Component is not moving
Why? Roller getting jammed
Why? Roller end support bearing jammed
Why? Bearing worn out due to deterioration
Why? Bearing not replaced periodically
Problem Table tilting is not working
Why? Table tilting Limit switches all no’s not working
Why? Limit switch cable got cut
Why? Cable to be checked & rejoined
Why? Cable to be replaced on Time Based Maintenance
Roller end support bearing
is jammed
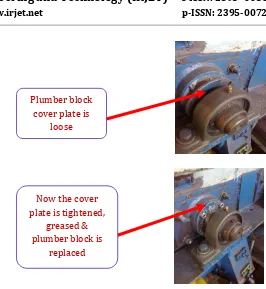
Plumber block cover plate is
loose
Now the cover plate is tightened,
greased & plumber block is
[image:2.595.291.557.58.347.2]Benefits/Results after implementation- After cable replacement, limit switches all no’s now working hence the table tilting problem is eliminated, & cold swage operation is further proceeded.
3. RESULTS AND DISCUSSION
3.1 Process Parameters of Disa Shot Blast Machine
before
the Implementation of Counter Measures
1. Total downtime of Disa Shot blast machine in the period Oct-2015 to Jan-2016 = 138 hours
2. Total available time for Disa Shot blast machine in the period Oct-2015 to Jan-2016 = 2288 hours (22hours×26 Days, 26Days×4Months = 572×4=2288) Excluding Sundays, holidays, & lunch time.
3. Total number of breakdowns in the period Oct-2015 to Jan-2016= 39
Availability =
Availability = − = 0.9396 2288
Availability = 93.96%
Loss of availability = 1- 0.9396 = 0.0604
= 6.04%
MTBF =
= − = 55.12 39
= 55.12 hours
MTTR =
= 138 = 3.53 39
= 3.53 hours
3.1.1 Process Parameters of Disa Shot Blast
Machine
after
the Implementation of Counter
Measures
1. Total downtime of Disa Shot blast machine in the period Feb-2016 to Apr-2016 = 48 hours
2. Total available time for Disa Shot blast machine in the period Feb-2016 to Apr-2016 = 1716 hours (22hours×26 Days, 26Days×3Months = 572×3=1716) Excluding Sundays, holidays, & lunch time.
3. Total number of breakdowns in the period Feb-2016 to Apr-2016= 18
Availability =
Availability = − = 0.9720 1716
[image:3.595.36.554.53.569.2] [image:3.595.39.290.90.556.2]Availability = 97.20%
Table tilting is not working, cable got cut
Cable is replaced, Limit switches all
no’s now
working
Loss of availability = 1- 0.9720 = 0.028
= 2.8%
MTBF =
= − 18
= 92.66 hours
MTTR =
= 48 18
= 2.66 hours
[image:4.595.301.565.67.313.2]Table 1: Comparison of results before and after implementation of counter measures of a Disa Shot Blast Machine
Fig .1 Graph Showing Comparison of Availability before and after implementation of counter measures
55.12 Hrs
92.66 Hrs
0
10
20
30
40
50
60
70
80
90
100
MTBF BEFORE IMPLEMENTATION IN (Hrs)
MTBF AFTER IMPLEMENTATION IN (Hrs) MTBF BEFORE AND AFTER IMPLEMETATION
[image:4.595.42.246.98.312.2]OF COUNTER MEASURES
Fig .2 Graph Showing Comparison of MTBF before and after implementation of counter measures
Fig .3 Graph Showing Comparison of MTTR before and after implementation of counter measures
3.2 Process Parameters of BFW Cold Swage
Machine
before
the Implementation of Counter
Measures
1. Total downtime of BFW Cold Swage machine in the period Oct-2015 to Jan-2016 = 134 hours
2. Total available time for BFW Cold Swage machine in the period Oct-2015 to Jan-2016 = 2288 hours (22hours×26 Days, 26Days×4Months = 572×4=2288) Excluding Sundays, holidays, & lunch time.
3. Total number of breakdowns in the period Oct-2015 to Jan-2016= 34
Availa bility before
imple mentat
ion
(%)
Availa bility after imple menta tion
(%)
MTBF before implem entatio
n
(hours)
MTBF after implem entatio
n
(hours)
MTTR before implem entatio
n
(hours)
MTTR after implem entatio
n
(hours)
[image:4.595.312.559.353.558.2] [image:4.595.28.307.372.712.2] Availability =
Availability = − = 0.9414 2288
Availability = 94.14%
Loss of availability = 1- 0.9414 = 0.0586
= 5.86%
MTBF =
= − = 63.35 34
= 63.35 hours
MTTR == 134 = 3.94 34
= 3.94 hours
3.2.1 Process Parameters of BFW Cold Swage
Machine
after
the Implementation of Counter
Measures
1. Total downtime of BFW Cold Swage machine in the period Feb-2016 to Apr-2016 = 46 hours
2. Total available time for BFW Cold Swage machine in the period Feb-2016 to Apr-2016 = 1716 hours (22hours×26 Days, 26Days×3Months = 572×3=1716) Excluding Sundays, holidays, & lunch time.
3. Total number of breakdowns in the period Feb-2016 to Apr-2016= 17
Availability =
Availability = − = 0.9731 1716
Availability = 97.31%
Loss of availability = 1- 0.9731 = 0.0269
= 2.69%
MTBF =
= − 17
= 98.23 hours
MTTR =
= 46 17
= 2.70 hours
Table 2: Comparison of results before and after implementation of counter measures of BFW Cold Swage Machine
94.14%
97.31%
92
93
94
95
96
97
98
AVAILABILITY BEFORE COUNTER MEASURE IN (%)
[image:5.595.33.561.46.443.2]AVAILABILITY AFTER COUNTER MEASURE IN (%) AVAILABILTY BEFORE AND AFTER IMPLEMENTATION OF COUNTER MEASURES
Fig .4 Graph Showing Comparison of Availability before and after implementation of counter measures
Availa bility before
imple mentat
ion
(%)
Availa bility after imple menta tion
(%)
MTBF before implem entatio
n
(hours)
MTBF after implem
entatio n
(hours)
MTTR before implem entatio
n
(hours)
MTTR after implem
entatio n
(hours)
[image:5.595.309.566.495.706.2]63.35 Hrs
98.23 Hrs
0
20
40
60
80
100
120
MTBF BEFORE IMPLEMENTATION IN
(Hrs)
MTBF AFTER IMPLEMENTATION IN
(Hrs)
[image:6.595.38.294.100.318.2]MTBF BEFORE AND AFTER IMPLEMETATION OF COUNTER MEASURES
Fig .5 Graph Showing Comparison of MTBF before and after implementation of counter measures
Fig .6 Graph Showing Comparison of MTTR before and after implementation of counter measures
4. CONCLUSION
The use of root cause analysis helped to identify the correct causes of failures by which the suitable countermeasures are developed and implemented. The process measurable such as Availability, MTBF, and MTTR are calculated before and after the implementation of counter measures. Continuous monitoring of processes is done after the implementation of counter measures and following conclusions are drawn:
The Breakdowns such as Rollers problem, Spout unit problem, Impeller problem in Disa Shot Blast Machine is completely eliminated.
The availability of Disa Shot Blast Machine is increased from 93.96% to 97.20%.
The MTBF of Disa Shot Blast machine is increased from 55.12 hours to 92.66 hours.
The MTTR of Disa Shot Blast machine is decreased from 3.53 hours to 2.66 hours.
The Effectiveness of preventive maintenance of Disa Shot Blast machine is improved.
The Breakdowns such as Table tilting problem, Deep Pressmark on job, Proximity Sensors problem in BFW Cold Swage Machine is completely eliminated.
The availability of BFW Cold Swage Machine is increased from 94.14% to 97.31%.
The MTBF of BFW Cold Swage Machine is increased from 63.35 hours to 98.23 hours.
The MTTR of BFW Cold Swage Machine is decreased from 3.94 hours to 2.70 hours.
The Effectiveness of preventive maintenance of BFW Cold Swage Machine is improved.
ACKNOWLEDGEMENT
I extend sincere thanks to Dr. H. Yogish, Associate Professor, Department of Mechanical Engineering, SJCE, Mysuru, for lending his esteemed guidance and his indefatigable knowledge in the field of productive systems which helped a lot in completing this project work.
I sincerely thank Mr. Jayaramegowda K H, Deputy Manager General maintenance, plant engineering department, of automotive axle limited, Mysuru, for his extremely valuable time, guidance, Support and helping us in familiarizing with the plant and completing the project work.
I extend sincere thanks to Mr. Dhanashekar, Manager Training, Automotive Axles Limited, Mysuru, for Giving Me Project Placement in the Organization
.
REFERENCE
[1].
"
Management of industrial maintenance" - Anthony Kelly and M.J. Harris. Butterworth and Co. Ltd., 1978. [2]."Maintenance planning and control" - Anthony Kelly.East west press Pvt. Ltd., 1984
[3]."Root cause analysis in aircraft final assembly" - Brown J I. Master abstract international.1994
[4].Engineering maintenance by B.S Dhillon, Ph.D. [5].Zero Breakdown Strategies by Terry
Wireman-Hanser Gardner Publications. 3.94Hrs
2.70 Hrs
0
0.5
1
1.5
2
2.5
3
3.5
4
4.5
MTTR BEFORE IMPLEMENTATION IN (Hrs)
MTTR AFTER IMPLEMENTATION IN (Hrs) MTTR BEFORE AND AFTER IMPLEMETATION
[image:6.595.35.289.371.576.2]Articles
(1) Sergio Rossi [ lean manufacturing ].in early ’’s,
http; //www.relableplant.com/authors
(2) Dew, J. R. (1991) – in search of the Root Cause. Quality progress,24(3),pp97-107,
(3) Sproull, B (2001).Process Problem Solving: A guide for maintenance and Operations. Teams. Portland: Productivity Press
(4) Gits, C.W., On the Maintenance Concept for a Technical System: A Framework for Design , Ph.D. Thesis, Eindhoven University of Technology, 1984.
(5) Sherif, Y.S., and Smith, M.L, Optimal Maintenance Models for Systems Subject to Failure: A Review , Naval Research logistics quarterly, volume 28, pp.47-74, 1981.
(6) Flores, and Feldman, RM., A Survey of Preventive Maintenance Models for Stochastically Deteriorating Single- Unit Systems , Naval Research logistics quarterly, volume 36, No. 4 pp.419-446, 1989.
(7) Y. Sherif, M.L. Smith, - Optimal maintenance models for systems subject to failure-A review||, Naval Research logistics quarterly, volume 28, March 1988, pp.47-74.
(8) Li, C. H., & Chang, S. C. (2002). Model for preventive maintenance operations and forecast method for interval triggers. Semiconductor Manufacturing Technology workshop 2002, 10-11Dec.2002, pp., 275-277.
(9) ACMP 706-132, Engineering Design Handbook: Maintenance Engineering Techniques, Department of Defence, Washington DC, (1975).
BIOGRAPHIES
Sathish Kumar .N
1,
1PG student, M .Tech(Maintenance Engineering) SJCE, Mysuru Karnataka, India He also presented this paper in National Conference on Emerging
Trends in Mechanical Engineering at AIT, Chikkamagaluru.