© 2016, IRJET | Impact Factor value: 4.45 | ISO 9001:2008 Certified Journal | Page 325
Laboratory investigation on Black cotton soils and
Red soil stabilized using Enzyme
Priyanka M Shaka
1, Surekha M Shaka
2.
1
PG Student, Civil Engineering, Basaveshwar Engineering College, Bagalkot, India
E-mail:[email protected]
2
Asst. Professor,Civil Engineering, Bheemanna Khendre Institute Of Technology, Bhalki, India
E-mail:[email protected]
---***---Abstract -
The most important aspect in any project is its durability and economic criteria. Recently many bio-enzymes have come into existence and these were used in many constructions works. The areas of Bagalkot are covered with Black cotton soil and few areas with Red soil which have less bearing capacity. The present paper describes a study carried out for improving of geotechnical properties of soils. The collected soil samples were treated with the commercially available Enzyme and were cured for 7, 14 and 21days. The results of Consistency limits, Compaction test, Free swell index (FSI), Unconfined Compressive Strength (UCS and California Bearing Ratio (CBR) of untreated soils are presented in this paper. The engineering properties obtained for different mix proportions of soil and curing period were studied. The Free swell index (FSI) and the soaked CBR tests were conducted for the stabilized soil at different curing period.Key Words: Soil stabilization, Terra-Zyme, Free swell index (FSI) and Soaked CBR
1.
INTRODUCTION
The soil is the only material which supports the structural foundation of buildings, dams and roads. In About one third of Indian areas are covered with black cotton soil, which occurs in western and central parts of India. Many areas are covered with silt and clay soils as these possess poor bearing capacity problems during the construction or during the life service of structures. For the poor engineering properties of these soils it has forced Engineers to improve the bearing capacity problem by improving the engineering properties of soil by using different soil stabilization methods. These methods of soil stabilization involves of replacing of soil or using complex methods of chemical stabilization [5]. The clay of medium to high compressibility characterized by high swelling and shrinkage properties which covers the area of north Karnataka regions has become a challenge to the engineers in construction.
This soil when becomes dry is very hard but loses its strength properties completely when it is in wet condition [7]. Therefore, it is very important to know various properties of soil such as physical and engineering properties. Soil can be stabilized by chemically or mechanically. The chemical stabilizers are the substances that can enter in the natural reactions of the soil and control the moisture which is getting into the clay particles. Chemical stabilizers are divided into three groups they are as follows;
1) Traditional stabilizers (hydrated lime, Portland cement and fly ash),
2) Non- Traditional stabilizers (sulfonated oils, ammonium chloride, enzymes, polymers and potassium compounds) and
3) By-product stabilizers (lime kiln dust, cement kiln dust) [10].
© 2016, IRJET | Impact Factor value: 4.45 | ISO 9001:2008 Certified Journal | Page 326 et al. 2009) [6]. The mineralogical properties like
Cat-ion exchange capacity for exchangeable Cat-Cat-ion properties were studied under X-Ray diffraction (Sureka Naagesh et al. 2011) [7]. The durability tests of soil by using enzyme as Terra-Zyme (Lekha B. M et al. 2013) [9]. Many tests were carried out to study the effect of enzyme on lateritic soil and blended with sand in terms of permeability, compaction, UCS, CBR characteristics. It has been observed that the enzyme treated soil showed significant improvement in UCS, CBR for longer curing period, but it is not much effective on cohessionless soil.
2. EXPERIMENTAL METHODOLOGY
Various laboratory and experimental work have been carried out in the present investigation. The work includes four different soils with different liquid limit, different quantity of clay content and one additive. Specimens were prepared at three different dosages of the additive and cured up to 7, 14 and 21days. The tests on stabilized soil were conducted at 7 day intervals. All experiments were carried out as per the standard procedures described in the Bureau of Indian Standards.
Material Characterization
SOIL
The locally available four different types of soils from four different places were procured and used for the present study i.e. three black cotton soils and one red soil and they are as follows.
1. Navalgund taluk (Anigere chanammana keri), Dharwad district (S1).
2. Navalgund taluk (Benihala), Dharwad district (S2). 3. Nargund taluk (Kalikere) Gadag district (S3), and 4. Red soil Badami taluk (Mutulgere), Bagalkot district (S4).
TERRA-ZYME
A commercially available Enzyme is used. The cementious property is obtained when the enzyme is mixed with water and applied this enzyme solution combines the organic and inorganic material present in the soil through catalytic bonding process [16]. Enzyme promotes the development of cementious compounds using the following reaction.
H2O+Clay+Terra-Zyme = Calcium Silicate Hydrates A commercially available bio-enzyme under the trade name of Terra-Zyme is used for the present study. Properties of Terra-Zyme as per the laboratory study are as given in Table 1.
Table -1: Properties of Terra-Zyme (supplied by manufacturer)
Identity (As It Appears
On Label) N-Zyme
Hazardous Components None
Boiling Point 100 Degree
Celsius
Specific Gravity 1.05
Melting Point Liquid
Evaporating Rate Same as Water
Solubility in Water Complete
Appearance/Odor Brown liquid,
Non obnoxious
Dosage of enzyme
The dosage recommended by the supplier of enzyme and based on literature works, different studies carried out by using enzyme are selected. In the present study the dosages selected are as follows 200ml/0.5m3,200ml/0.75m3 and
200ml/1m3 is carried out with and without the Terra-Zyme
to study the variation in the geotechnical properties.
Methodology
Dosage of Terra-Zyme and curing period Dosage specified by company for Black cotton soil and red soil 200ml for bulk volume 0.5m3 to 3m3 of soil quantity. The
[image:2.595.339.525.138.341.2]above dosages are used for the present study. The example of calculation for Terra-Zyme quantity for mixing into the soil is as shown below.
Table-2: Dosage of Terra-Zyme and curing period Dosage 200ml/m3 of soil Curing period in
days
1. 200ml/0.5m3
7days, 14 days and 21days
2. 200ml/0.75m3
3. 200ml/1m3
Soil sample S1
Bulk density soil= 1.944gm/cc or 19.07kN/m3
Bulk density= Weight/Volume Weight = Bulk density X Volume For Dosage 1
200ml for 0.5 m3 of soil = 1.944X0.5X1000
= 972kg of soil
© 2016, IRJET | Impact Factor value: 4.45 | ISO 9001:2008 Certified Journal | Page 327 The tests conducted at laboratory to know the
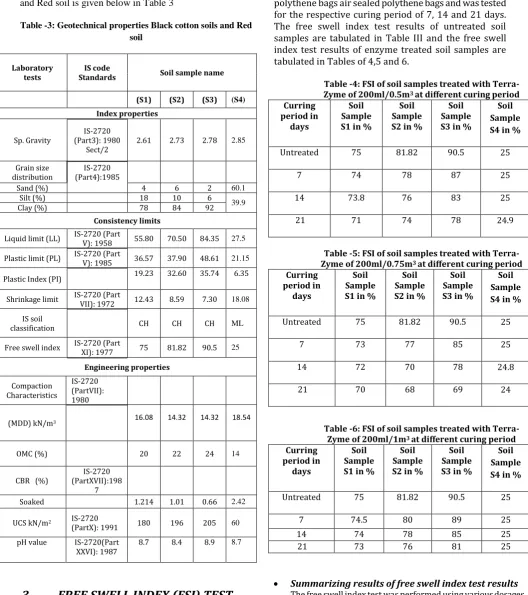
[image:3.595.34.563.132.728.2]various Geotechnical properties of Black cotton soils and Red soil is given below in Table 3
Table -3: Geotechnical properties Black cotton soils and Red soil
Laboratory
tests Standards IS code Soil sample name
(S1) (S2) (S3) (S4)
Index properties
Sp. Gravity (Part3): 1980 IS-2720
Sect/2 2.61 2.73 2.78 2.85
Grain size
distribution (Part4):1985 IS-2720
Sand (%) 4 6 2 60.1
Silt (%) 18 10 6
39.9
Clay (%) 78 84 92
Consistency limits
Liquid limit (LL) IS-2720 (Part V): 1958 55.80 70.50 84.35 27.5
Plastic limit (PL) IS-2720 (Part V): 1985 36.57 37.90 48.61 21.15
Plastic Index (PI) 19.23 32.60 35.74 6.35
Shrinkage limit IS-2720 (Part VII): 1972 12.43 8.59 7.30 18.08
IS soil
classification CH CH CH ML
Free swell index IS-2720 (Part XI): 1977 75 81.82 90.5 25
Engineering properties
Compaction Characteristics
IS-2720 (PartVII): 1980
(MDD) kN/m3 16.08 14.32 14.32 18.54
OMC (%) 20 22 24 14
CBR (%) (PartXVII):198IS-2720
7
Soaked 1.214 1.01 0.66 2.42
UCS kN/m2 IS-2720
(PartX): 1991 180 196 205 60
pH value IS-2720(Part
XXVI): 1987 8.7 8.4 8.9 8.7
3.
FREE SWELL INDEX (FSI) TEST
RESULTS
The Enzyme was concentrated with water at the respective soils optimum moisture content obtained
from the standard proctor test and mixed with the soils. The stabilized soil was prepared and kept in the polythene bags air sealed polythene bags and was tested for the respective curing period of 7, 14 and 21 days. The free swell index test results of untreated soil samples are tabulated in Table III and the free swell index test results of enzyme treated soil samples are tabulated in Tables of 4,5 and 6.
Table -4: FSI of soil samples treated with Terra-Zyme of 200ml/0.5m3 at different curing period
Curring period in
days
Soil Sample S1 in %
Soil Sample S2 in %
Soil Sample S3 in %
Soil Sample S4 in %
Untreated 75 81.82 90.5 25
7 74 78 87 25
14 73.8 76 83 25
21 71 74 78 24.9
Table -5: FSI of soil samples treated with Terra-Zyme of 200ml/0.75m3 at different curing period
Curring period in
days
Soil Sample S1 in %
Soil Sample S2 in %
Soil Sample S3 in %
Soil Sample S4 in %
Untreated 75 81.82 90.5 25
7 73 77 85 25
14 72 70 78 24.8
21 70 68 69 24
Table -6: FSI of soil samples treated with Terra-Zyme of 200ml/1m3 at different curing period
Curring period in
days
Soil Sample S1 in %
Soil Sample S2 in %
Soil Sample S3 in %
Soil Sample S4 in %
Untreated 75 81.82 90.5 25
7 74.5 80 89 25
14 74 78 85 25
21 73 76 81 25
Summarizing results of free swell index test results The free swell index test was performed using various dosages of Terra-Zyme such as 200ml/0.5m3, 200ml/0.75m3 and
200ml/1m3 with the local soils and cured for 7, 14 and 21days
© 2016, IRJET | Impact Factor value: 4.45 | ISO 9001:2008 Certified Journal | Page 328 200ml/0.75m3 at the 21days of curing gave the values of soil
sample S1 to S4 70%, 68%, 69% and 24%. As reduction percentage of FSI are S1 to S4 as 6.66%, 16.89%, 23.75% and 4%. This little improvement may be due to chemical constituent of the soil, which has low reactivity with Bio-enzyme Film of adsorbed water is greatly reduced for treated soil and these soil particles acquire a tendency to agglomerate. As a result of relative movement, the surface area get reduced which in turn reduces the swelling capacity. This causes decrease of FSI values with increase in curing period.
4.
CALIFORNIA BEARING RATIO (CBR)
TEST RESULTS
Soaked CBR test was conducted by mixing the soils at soaked condition. Predetermined quantity of water is mixed with Terra-Zyme at different dosages of enzyme i.e. 200ml/0.5m3,
200ml/0.75m3 and 200ml/1m3 was added corresponding to
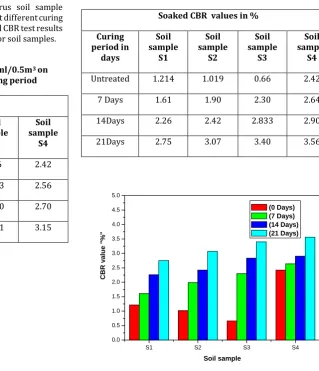
[image:4.595.322.547.115.292.2]optimum moisture content by standard proctor’s test for the mix, mixed thoroughly. These mixes were compacted in CBR mould to maximum proctor’s density. Two identical specimens which were prepared as per IS code 2720- PART XVI, kept in air tight bags for testing 7, 14 and 21 days curing and was soaked in water for 96hours before testing of curing period, then tested for CBR. The following Fig. 2graph of soaked CBR (%) virus soil sample represents effect of enzyme reacting on the soils at different curing period. The Table -7 provides the details of soaked CBR test results of effect of Terra-Zyme dosage of 200ml/0.5m3 for soil samples.
Table -7:Effect of Terra-Zyme dosage 200ml/0.5m3 on
Soaked CBR values with respect to curing period
Soaked CBR values in %
Curing period in
days
Soil sample
S1
Soil sample
S2
Soil sample
S3
Soil sample
S4
Untreated 1.214 1.019 0.66 2.42
7 Days 1.500 1.618 2.053 2.56
14Days 2.023 2.137 2.620 2.70
21Days 2.420 2.590 3.121 3.15
S1 S2 S3 S4
0.0 0.5 1.0 1.5 2.0 2.5 3.0 3.5 4.0
CB
R v
a
lue
"%
"
Soil sample
(S1) (S2) (S3) (S4)
Fig-1: Effect of Terra-Zyme dosage of 200ml/0.5m3 of soil
sample at varying curing period
Table -8: Effect of Terra-zyme dosage 200ml/0.75m3 on
Soaked CBR values with respect to curing period
Soaked CBR values in %
Curing period in
days
Soil sample
S1
Soil sample
S2
Soil sample
S3
Soil sample
S4
Untreated 1.214 1.019 0.66 2.42
7 Days 1.61 1.90 2.30 2.64
14Days 2.26 2.42 2.833 2.90
21Days 2.75 3.07 3.40 3.56
S1 S2 S3 S4
0.0 0.5 1.0 1.5 2.0 2.5 3.0 3.5 4.0 4.5 5.0
CB
R v
a
lue
"%
"
Soil sample
(0 Days) (7 Days) (14 Days) (21 Days)
Fig-2: Effect of Terra-Zyme dosage of 200ml/0.75m3 of soil
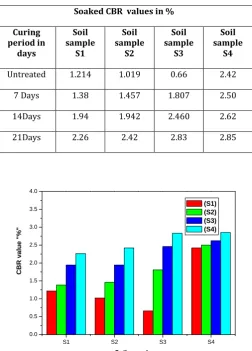
[image:4.595.224.544.360.732.2]© 2016, IRJET | Impact Factor value: 4.45 | ISO 9001:2008 Certified Journal | Page 329 Table -9: Effect of Terra-Zyme dosage 200ml/1m3 on Soaked
CBR values with respect to curing period
Soaked CBR values in %
Curing period in
days
Soil sample
S1
Soil sample
S2
Soil sample
S3
Soil sample
S4
Untreated 1.214 1.019 0.66 2.42
7 Days 1.38 1.457 1.807 2.50
14Days 1.94 1.942 2.460 2.62
21Days 2.26 2.42 2.83 2.85
S1 S2 S3 S4
0.0 0.5 1.0 1.5 2.0 2.5 3.0 3.5 4.0
CB
R v
a
lue
"%
"
Soil sample
(S1) (S2) (S3) (S4)
Fig-3: Effect of Terra-Zyme dosage 200ml/1m3 on
Soaked CBR values with respect to curing period
Summarizing results of soaked CBR test
Above Fig-1, 2 and 3 represents the results soaked CBR test performed using various dosages of Terra-Zyme such as 200ml/0.5m3, 200ml/0.75m3 and 200ml/1m3 at different curing
period of 7, 14 and 21 days the results of 200ml/0.75m3 dosage of
Terra-Zyme at 21 days for soil sample S1, S2, S3 and S4 was 2.420%, 2.59%, 3.45% and 3.56%. Soil sample S3 shows maximum increase of CBR % values as that of other three soils and soil sample S4 shows the marginal increase in of CBR % values. The percentage increase in CBR values for soil samples S1, S2, S3 and S4, 126.52%, 238.56%, 365.15% and 47.10% respectively. This is because soil treated with enzyme renders improved density values by reducing void ratios. This tendency may be due to effective cat-ion exchange process which generally takes longer period in the absence of such stabilisers.
5.
CONCLUSIONS
With the application of Terra-Zyme best result for FSI values was observed with the dosage 200ml/0.75m3 of Terra-Zyme
at curing period of 21 days the value of FSI decreased for soil sample S1 to S4 6.66%, 16.89%, 23.75% and 4%.
After 21 Days of stabilization with Terra-Zyme dosage of
200ml per 0.75m3 the soaked CBR value for the local soil Samples
S1, S2, S3 and S4 was 2.75%, 3.45%, 3.07% and 3.56%.
Best result for soaked CBR value was observed with
dosage 200ml per 0.75m3 the percentage increase for soil sample S1, S2, S3 and S4, 126.52%, 238.56%, 365.15% and 47.10% respectively.
6.
ACCOKNOWLEGDEMENT
Dr. Savita Shaka who has helped me with her guildlines for completing this project successfully.
REFERENCES
1. Hitam, A. and Yusof, A. (1998): “Soil stabilizers for plantation road”, Proceedings, National seminar on Mechanization in Oil Palm Plantation, Selangor, Malaysia, pp.124-138.
2. Brazetti, R. and Murphy, S.R. (2000): “General usage of
Bio-Enzyme stabilizers in Road Construction in Brazil”, 32nd annual meeting on paving Brazil, October 2000.
3. Bergmann, Roger (2000), “Soil Stabilizers on Universally
Accessible Trails”, Technical Report 0023-1202-DTDC, San Dimas, Ca: U.S. Department of Agriculture, Forest Service, San Dimas Technology and Development Center, p. 10.
4. Milburn, J. P. & Parsons, R.(2004). "Performance of Soil Stabilization Agents". Kansas Department of Transportation.
5. Ganesh, C. (2008): “ Fatigue Behavior of enzyme stabilised soil “,M.Tech. Thesis, National Institute of Technology, Srinivasanagar, Karantaka ,India.
6. A.U Ravi Shankar, Harsha Kumar Rai Ramesh A
Mithanihaya.(2009):“Bio Enzyme stabilized lateritic soil as a highway material” Indian Road Congress 2009; 143-151.
7. Sureka Naagesh and Gangadhara.S.( 2011):“Swelling
Properties of Bio –enzyme Treated Expansive soil”, International Journal of Earth Sciences and Engineering 2011; 4(3): 555-560
8. C.Venkatasubramanian and G. Dhinakaran, (2011):“Effect
of Bio-Enzymatic Soil stabilization on unconfined compressive strength and california bearing ratio”, Jornal of Engineering and Applied Sciences 6(5): 295-298.
9. Lekha B. M et al.(2013):“ Laboratory Investigation On Black Cotton Soil Stabilized With Non Traditional Stabilizer” IOSR Journal of Mechanical and Civil Engineering(IOSR-JMCE) e-ISSN : 2278–1684 p-ISSN :2320-334X, pp07-13
10. Puneet Agarwal and Suneet Kaur(2014) “Effect Of
© 2016, IRJET | Impact Factor value: 4.45 | ISO 9001:2008 Certified Journal | Page 330
11. Purnima Bajpai(2014): “Non-conventional soil
stabilization techniques The way forward to an aggregate free pavement And a Cost effective method of Road Construction” International Journal of Scientific & Engineering Research, Volume-5.
12. Nway nway nilar myint And than mar swe(2014):“
Investigation into Soil Stabilization with Enzyme” International Journal of Scientific Engineering and Technology Research Volume.03, IssueNo.08, May-2014, Pages: 1491-1495
13. Greeshma Nizy Eujine et al.(2014):“Enzyme Stabilization
of High Liquid Limit Clay” Vol.19 6995, Electronic Journal of Geotechnical Engineering.
14. Vijay Rajoria, et al.(2014):“A review on stabilization of soil using bio-enzyme” IJRET: International Journal of Research in Engineering and Technology Volume: 03 Issue: 01 ,2014
15. Venika Saini and Priyanka Vaishnava(2015):“Soil
stabilization by using terrazyme” International Journal of Advances in Engineering & Technology, Aug., 2015. Vol. 8, Issue 4, pp. 566-573.
16. Nandini D N and Vinoda Amate,(2015),: “Compaction and
strength characteristics of terra-zyme stabilized red soil” International Journal Of Research Publications In Engineering, Technology And Management, Volume 1, Issue 1, July-2015.
17. Swathy M Muraleedharan And Niranjana.K(
2015):“Stabilisation Of Weak Soil Using Bio-Enzyme” International Journal Of Advanced Research Trends In Engineering And Technology (ijartet) vol.II, special issue x, march 2015 in association with holy grace academy of engineering organizes national level conference on innovative engineering (16-20th march 2015).
18. IS 2720 (Part III) (1980) “Determination of Specific gravity” Bureau of Indian Standards, Manak Bhavan, New Delhi.
19. IS 2720 (Part IV) (1975) “Determination of Grain Size”
Bureau of Indian Standards, Manak Bhavan, New Delhi.
20. IS 2720 (Part V) (1985) “Determination of Liquid and Plastic limit” Bureau of Indian Standards, Manak Bhavan, New Delhi.
21. IS 2720 (Part VII) (1980) “Determination of Moisture content and Dry density” Bureau of Indian Standards, Manak Bhavan, New Delhi
22. IS 2720 (Part X) (1991) “Determination of Unconfined
Compressive Strength” Bureau of Indian Standards, Manak Bhavan, New Delhi.
23. IS 2720 (Part XVI) (1987) “Determination of California
Bearing Ratio”Bureau of Indian Standards, Manak Bhavan, New Delhi.
24. IS 2720 (Part XXVI) (1987) “Determination of pH
value”Bureau of Indian Standards, Manak Bhavan, New Delhi.
25. IS 2720 (Part XI) (1977) “Determination of Free swell index of soils”Bureau of Indian Standards, Manak Bhavan, New Delhi.