www.impactjournals.com/oncotarget/ Oncotarget, Vol. 6, No. 18
Dual regulation by microRNA-200b-3p and microRNA-200b-5p
in the inhibition of epithelial-to-mesenchymal transition in
triple-negative breast cancer
Lyndsay V. Rhodes4,*, Elizabeth C. Martin1,*, H. Chris Segar1, David F. B. Miller3, Aaron Buechlein5, Douglas B. Rusch5, Kenneth P. Nephew3, Matthew E. Burow1,2, Bridgette M. Collins-Burow1
1Department of Medicine-Section of Hematology and Medical Oncology, Tulane University, New Orleans, LA, USA 2Department of Pharmacology, Tulane University, New Orleans, LA, USA
3 Medical Sciences and Department of Cellular and Integrative Physiology, Indiana University School of Medicine, Bloomington,
IN, USA
4Department of Biological Sciences, Florida Gulf Coast University, Fort Myers, FL, USA 5Indiana University Center for Genomics and Bioinformatics, Bloomington, IN, USA *These authors have contributed equally to this work
Correspondence to:
Bridgette M. Collins-Burow, e-mail: bcollin1@tulane.edu
Keywords: triple negative breast cancer, RHOGDI, miRNA biogenesis, star strand, isomiRs
Received: November 20, 2014 Accepted: January 23, 2015 Published: March 21, 2015
ABSTRACT
Epithelial to mesenchymal transition (EMT) involves loss of an epithelial phenotype and activation of a mesenchymal one. Enhanced expression of genes associated with a mesenchymal transition includes ZEB1/2, TWIST, and FOXC1. miRNAs are known regulators of gene expression and altered miRNA expression is known to enhance EMT in breast cancer. Here we demonstrate that the tumor suppressive miRNA family, miR-200, is not expressed in triple negative breast cancer (TNBC) cell lines and that miR-200b-3p over-expression represses EMT, which is evident through decreased migration and increased CDH1 expression. Despite the loss of migratory capacity following re-expression of miR-200b-3p, no subsequent loss of the conventional miR-200 family targets and EMT markers ZEB1/2 was observed. Next generation RNA-sequencing analysis showed that enhanced expression of pri-miR-200b lead to ectopic expression of both pri-miR-200b-3p and pri-miR-200b-5p with multiple isomiRs expressed for each of these miRNAs. Furthermore, miR-200b-5p was expressed in the receptor positive, epithelial breast cancer cell lines but not in the TNBC (mesenchymal) cell lines. In addition, a compensatory mechanism for miR-200b-3p/200b-5p targeting, where both miRNAs target the RHOGDI pathway leading to non-canonical repression of EMT, was demonstrated. Collectively, these
data are the first to demonstrate dual targeting by miR-200b-3p and miR-200b-5p
and a previously undescribed role for microRNA processing and strand expression in EMT and TNBC, the most aggressive breast cancer subtype.
INTRODUCTION
Breast cancer can be classified into distinct sub-types, including luminal and basal subsub-types, based on molecular markers that define their phenotype and predict therapeutic response [1]. The triple-negative sub-type is characterized by loss of estrogen receptor, progesterone receptor, and Her2/Neu, and therefore is not responsive to
the heterogeneity of this subtype. Although molecular subtyping has begun to elucidate the signaling events regulating this aggressive form of breast cancer, much remains to be investigated. RNA based next generation deep sequencing for both large and small RNAs allows for great depth in investigating differences in gene expression profiles for breast cancer subtypes.
miRNA mediated regulation of breast cancer has received considerable attention due to evidence of miRNA regulation of drug resistance, metastasis, receptor status, and the epithelial-to-mesenchymal transition (EMT) [4–6]. The expression of the miR-200 family cohort of miRNAs is lost in mesenchymal breast cancer subtypes compared to epithelial subtypes [7]. This miRNA family exists in two clusters: one on chromosome 1 (200b-3p, miR-200b-5p, miR-200a-3p, miR-200a-5p, and miR-429) and the other on chromosome 12 (3p, miR-200c-5p, miR-141-3p, and miR-141-5p) [8, 9]. Conventionally the miR-200 family is a regulator of epithelial–cadherin (CDH1) expression through the direct targeting of zinc finger E-box-binding homeobox 1 (ZEB1) and 2 (ZEB2) [10]. However, canonical signaling of miR-200 family and ZEB1/2 demonstrates an inhibitory mechanism where ZEB1 and ZEB2 can repress miR-200 family expression [11]. Collectively a negative feedback loop has been established for the miR-200 family and ZEB1/2 which ultimately leads to the regulation of CDH1 and EMT/MET. The increased expression of ZEB1/2 leads to the loss of miR-200 and CDH1, while the increased expression of miR-200 leads to loss of ZEB1/2 and increased CDH1 [11]. Although this has been the dogma for miR-200 regulation of EMT, recent studies suggest non-canonical mechanisms for miR-200 family regulation of EMT independent of ZEB1 and ZEB2, as well as miR-200 family as regulators of EMT through both canonical and non-canonical ZEB/ miR-200/CDH1 mechanisms and through interactions with TGF-β, hedgehog, and RHO signaling pathways [12–14].
Here we demonstrate through next generation sequencing analysis miR-200b-3p regulation of EMT in the TNBC subtype through inhibition of the RHO signaling cascade. Additionally, through the enforced expression of pri-miR-200b we demonstrate altered processing and enhanced expression of miR-200b-5p. Furthermore we demonstrate a compensatory mechanism where both 200b and miR-200b-5p target the RHO signaling cascade. These results demonstrate a novel mechanism for miR-200 family in the regulation of EMT, highlighting the importance of miRNA processing and miRNA strand expression in breast cancer.
RESULTS
MiR-200 family is differentially expressed across breast cancer cell lines
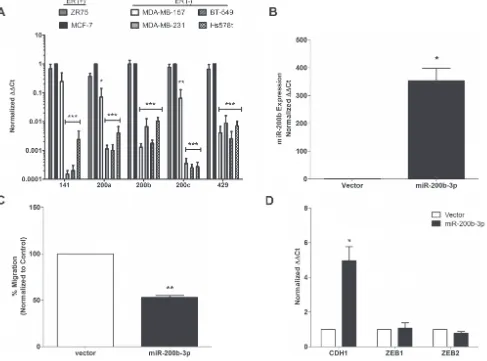
qPCR analysis of a panel of breast cancer cell lines revealed suppressed expression of all miR-200
family members in cell line models of the TNBC subtype (Figure 1A). However, only repression (~100-fold) of miR-200b-3p was consistently observed in all TNBC cell lines tested. While there has been a clear association of miR-200 members in regulation of EMT, cell motility and metastasis, the role of miR-200b-3p in this process has not been fully established [15, 16]. As a recent report using computational modeling of miRNA and mRNA expression data from patient samples demonstrated a loss of miR-200b-3p expression and activity that specifically correlated to the basal breast cancer sub-type [17], we chose to further examine the specific effects of miR-200b-3p on the TNBC sub-type.
miR-200b-3p expression suppresses TNBC cell migration and EMT-gene expression
To directly assess the sub-type specific effects of miR-200b-3p, the TNBC cell line, MDA-MB-231, was transfected with pLEmiR-tRFP-miR-vector or – pri-miR-200b expression plasmids. Following stable selection, expression of mature processed miR-200b-3p was confirmed by qPCR. Expression of mature miR-200b-3p increased 353.5-fold in MDA-MB-231 cells (Figure 1B), compared to corresponding vector control cell lines.
As previous studies have shown that miR-200 family regulates the metastatic potential of cancer cells [12], we examined the effect of miR-200b expression on TNBC cell migration using in vitro transwell migration assays, which have been correlated with metastatic potential [18]. MDA-MB-231-miR-200b cells showed a 50% reduction in migration capacity than their vector counterparts (Figure 1C), indicating that miR-200b-3p plays a role in migration suppression and in agreement with a previous study [19].
miR-200b expression induces global gene expression changes
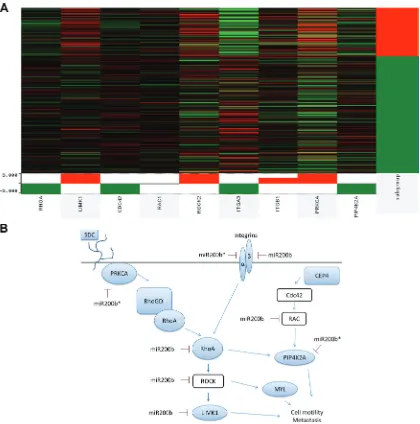
Due to the lack of ZEB1 and ZEB2 repression in MDA-MB-231-miR-200b cell line, we evaluated global transcriptome changes invoked through pri-miR-200b overexpression using next generation RNA-sequencing of the MDA-MB-231-miR-200b versus vector control cells. Prior to sequencing, RNA libraries were fractioned by size to generate full length and small RNA libraries, which were analyzed independently. Gene expression analysis of the full length data set revealed expression levels of 1831 genes that were significantly ( p < 0.05) altered following pri-miR-200b overexpression, with 824 genes upregulated and 1007 genes downregulated (Figure 2A).
[image:3.612.70.557.53.414.2]Some genes associated with EMT were demonstrated to be both significantly enhanced and repressed (Supplemental Table 1). However, these genes showed only minimal changes in expression level. Pathways significantly downregulated in the MDA-MB-231-miR-200b cells included many pathways associated with cell motility and cancer metastasis, such as axonal guidance, chemokine, epithelial adherens junction, and actin cytoskeleton signaling (Figure 2B). Of particular interest was the down-regulation of RHO signaling, given the widely known role of RHO dysregulation in cancer [29]. On the other hand, the most upregulated pathway in the miR-200b stable cells was the stabilization and expansion of E-cadherin adherens junction (Figure 2C), a critical pathway known to be deregulated in invasive cancer [30, 31] and a key
player in EMT [23]. Interestingly, classical EMT signaling events were not predicted to be regulated in our 200b cells by pathway analysis. Overall, pathway analysis of these up and down regulated genes indicates inhibition of the invasive phenotype of TNBC by miR-200b expression, through non-canonical signaling.
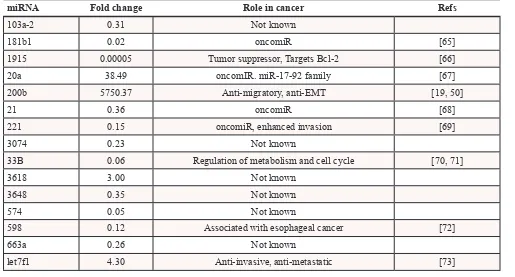
[image:4.612.68.548.141.343.2]Analysis of the small RNA fraction revealed significant alteration in expression of 1363 transcripts, of which 503 were upregulated and 859 were downregulated (Figure 2D). Interestingly, only 15 miRNA were included in these significantly altered transcripts, including miR-200b-3p (Table 1).
Figure 2: Overexpression of miR-200b-3p Induces Global Gene Expression Changes in the MDA-MB-231 Cell Line. (A) Heat map representation of global RNA expression changes in the MDA-MB-231-miR-200b cell line versus –vector. (B) and (C) represent pathways associated with genes that are significantly downregulated (B) or upregulated (C) in the MDA-MB-231-miR-200b cell line compared to –vector control. Pathway analysis was performed using QIAGEN’s Ingenuity® Pathway Analysis (IPA). (D) Heat map
representation of global miRNA expression changes in the MDA-MB-23-miR-200b cell line versus –vector.
Table 1: microRNA with significantly altered expression in MDA-MB-231-miR-200b cells
compared to vector control
miRNA Fold change Role in cancer Refs
103a-2 0.31 Not known
181b1 0.02 oncomiR [65]
1915 0.00005 Tumor suppressor, Targets Bcl-2 [66] 20a 38.49 oncomIR. miR-17-92 family [67] 200b 5750.37 Anti-migratory, anti-EMT [19, 50]
21 0.36 oncomiR [68]
221 0.15 oncomiR, enhanced invasion [69]
3074 0.23 Not known
33B 0.06 Regulation of metabolism and cell cycle [70, 71]
3618 3.00 Not known
3648 0.35 Not known
574 0.05 Not known
598 0.12 Associated with esophageal cancer [72]
663a 0.26 Not known
[image:4.612.55.570.458.735.2]RNA-sequencing indicates differential regulation of gene expression by miR-200b-3p and
miR-200-5p
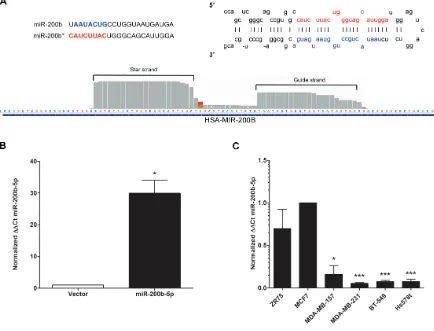
Since there was no observed significant change in ZEB1 or ZEB2 in our MDA-MB-231-miR-200b cell line, we next sought to determine if any alterations were made to the miR-200b-3p transcript. As miR-200b-3p was induced as a precursor miRNA, alterations to the 5’ end of the miRNA may have been induced during maturation. This would then account for the loss of ZEB targeting. Surprisingly, upon validation of miR-200b expression in our whole transcriptome analysis as observed in the Integrative Genomics Viewer (IGV), expression of both the mature 3p (guide strand) and miR-200b-5p (the star strand/passenger) was enhanced in MDA-MB-231-miR-200b (Figure 3A). Additionally there was no observed loss of 5’ heterogeneity in either miRNA strand (Figure 3A). Recent reports have shown that
[image:5.612.88.522.301.632.2]miRNA processing can favor strand selection, with the star strand or passenger strand being expressed at equal or higher levels than the conventional guide strand [32, 33]. Additionally, isomiRs, a miRNA transcript that differs from the primary transcript by one or two nucleotides, exist and demonstrate altered expression between cellular systems [34–36]. Since our miR-200b construct was expressed as pri-miR-200b, we evaluated previously published deep sequencing data to determine if miR-200b-5p can exist with physiologically relevant expression levels or if our enhanced miR-200b-5p expression was merely an artifact of enforced expression. As seen in miRBase, miR-200b-5p isomiRs are documented and can occur at physiologically relevant levels [37–40] and can be expressed at detectable levels (data not shown) [41–45]. qPCR validation for miR-200b-5p in our MDA-MB-231-miR-200b over expressing cell line revealed a significant increase in miR-200b-5p expression levels (Figure 3B). To examine if miR-200b-5p has a significant role in TNBC,
Figure 3: miR-200b-5p is Differentially Regulated between ER+ and Triple Negative Breast Cancer Subtypes. (A) Representative graphical analysis of reads for miR-200b-3p and miR-200b-5p expression in the MDA-MB-231-miR-200b cell line as viewed in Integrative Genomics Viewer (IGV). (B) qPCR for stable expression of miR-200b-3p in the MDA-MB-231 cell line following transfection with the pLEmiR-tRFP-miR-vector or –pri-miR-200b expression plasmids. U6 internal normalization and comparison to the MDA-MB-vector (designated as 1). (C) A cohort of ER+ (ZR75, MCF-7) and ER- (MDA-MB-157, MDA-MB-231, BT-549, Hs578t)
we then examined miR-200b-5p expression across a panel of breast cancer cell lines. Similar to the pattern observed in miR-200b-3p expression (Figure 1A), miR-200b-5p demonstrated substantially reduced expression in TNBC versus ER+/luminal cell lines (Figure 3C). Although
the -5p strand by convention represents the previously designated star strand is generally thought to have low to no basal expression, the relative expression of miR-200b-5p in the ER+ cell lines tested was at physiologically
robust levels (similar to that of miR-200b-3p; Figure 1A).
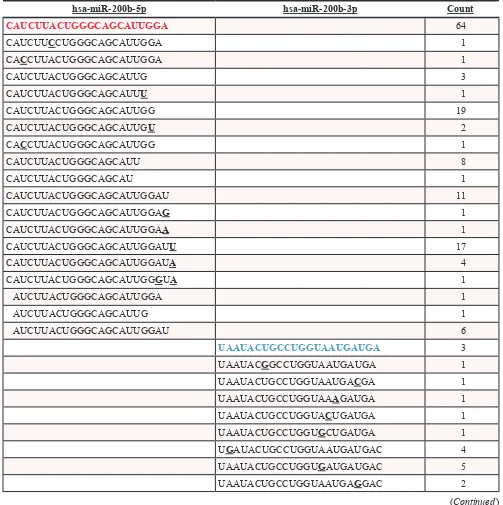
Since miR-200b-3p and miR-200b-5p were both expressed in our MDA-MB-231-miR-200b cell line and expression of both -3p and -5p were observed at physiologically relevant and similar endogenous levels in ER+ breast cancer cell lines, we next sought to
[image:6.612.56.559.221.726.2]evaluate the preference for isomiR expression for both of these miRNAs in our deep sequencing analysis. Relative counts of expressed isomiRs for both miRNAs are shown in Table 2. Notably, miR-200b-3p demonstrates greater variance on the 3’ end than miR-200b-5p, and as
Table 2: Prevalence of miR-200b-3p and miR-200b-5p IsomiRs in MDA-MB-231-miR-200b
Cell Line
hsa-miR-200b-5p hsa-miR-200b-3p Count
CAUCUUACUGGGCAGCAUUGGA 64
CAUCUUCCUGGGCAGCAUUGGA 1
CACCUUACUGGGCAGCAUUGGA 1
CAUCUUACUGGGCAGCAUUG 3
CAUCUUACUGGGCAGCAUUU 1
CAUCUUACUGGGCAGCAUUGG 19
CAUCUUACUGGGCAGCAUUGU 2
CACCUUACUGGGCAGCAUUGG 1
CAUCUUACUGGGCAGCAUU 8
CAUCUUACUGGGCAGCAU 1
CAUCUUACUGGGCAGCAUUGGAU 11
CAUCUUACUGGGCAGCAUUGGAG 1
CAUCUUACUGGGCAGCAUUGGAA 1
CAUCUUACUGGGCAGCAUUGGAUU 17
CAUCUUACUGGGCAGCAUUGGAUA 4
CAUCUUACUGGGCAGCAUUGGGUA 1
AUCUUACUGGGCAGCAUUGGA 1
AUCUUACUGGGCAGCAUUG 1
AUCUUACUGGGCAGCAUUGGAU 6
UAAUACUGCCUGGUAAUGAUGA 3
UAAUACGGCCUGGUAAUGAUGA 1 UAAUACUGCCUGGUAAUGACGA 1 UAAUACUGCCUGGUAAAGAUGA 1 UAAUACUGCCUGGUACUGAUGA 1 UAAUACUGCCUGGUGCUGAUGA 1 UGAUACUGCCUGGUAAUGAUGAC 4 UAAUACUGCCUGGUGAUGAUGAC 5 UAAUACUGCCUGGUAAUGAGGAC 2
stated above, there were little alterations in the 5’ end of either miRNA.
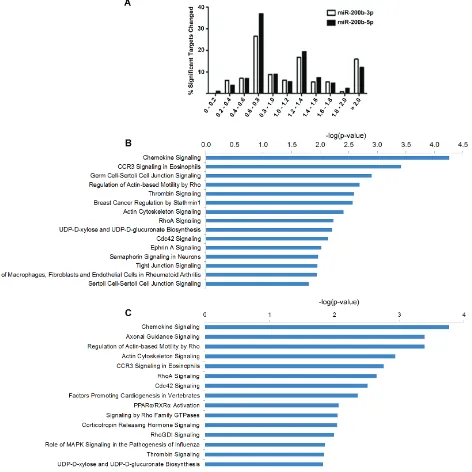
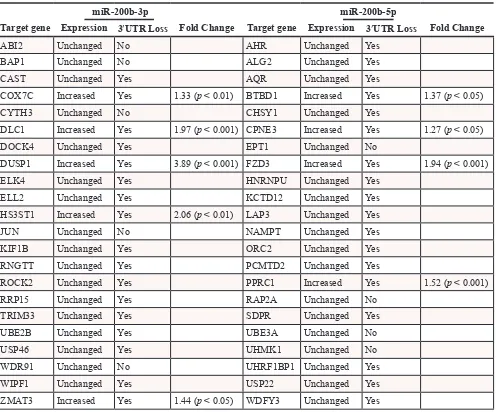
To evaluate the effects of 200b-3p and miR-200b-5p on gene expression we analyzed expression changes in genes predicted to have a seed site to either miR-200b-3p or miR-200b-5p. Seed sites for miR-miR-200b-3p and miR-200b-5p were generated using an in house algorithm, Seedfinder, to identify all 7-mer and 8-mer seeds throughout the human genome; from this data seed sites found in the 3’UTR of transcripts were analyzed. As seen in Figure 4A, miR-200b-3p and miR-200b-5p significantly repressed predicted target genes similarly, with only a slight increase in the repression of miR-200b-5p targets. Unexpectedly, our deep sequencing analysis revealed that some miRNA targets were not repressed. Furthermore some predicted miR-200-5p and miR-200b-3p targets demonstrated significantly enhanced expression. Due to this, we next chose to evaluate alterations in the MDA-MB-231-miR-200b transcriptome to better determine a mechanism for loss of targeting by miR-200b-3p/200b-5p in the MDA-MB-231 cell line. Predicted targets were evaluated for alterations in mRNA 3’UTR architecture and mRNA isoform variance. Due to the large number of predicted targets that were not changed or increased in our MDA-MB-231-miR-200b cell line, genes demonstrating low basal levels of expression or those that did not contain an 8-mer miR-200b-3p/200b-5p seed site were not evaluated. Table 3 demonstrates the mRNAs that were predicted to be targeted by miR-200b-3p or miR-200b-5p with increased expression levels
and describes if alterations in mRNA 3’UTR or isoform expression was observed. Interestingly, many of the genes predicted to be targeted by miR-200b-3p or miR-200b-5p demonstrated loss of 3’UTR. Some EMT associated genes demonstrating loss of 3’UTR include DUSP1, ROCK2, DLC1, FZD3, AHR, and ELK4.
miR-200b-3p and miR-200b-5p synergize to target non-canonical EMT pathway
To gain greater insight into miR-200b induced alterations in gene expression, all predicted miR-200b-3p and miR-200b-5p targets which were significantly down regulated in our deep sequencing analysis were analyzed through the use of IPA (Ingenuity® Systems,
www.ingenuity.com). Top down regulated pathways for miR-200b-3p (Figure 4B) and miR-200b-5p (Figure 4C) included many overlapping pathways reported in our original pathway analysis of all significantly down regulated genes (Figure 2B). Interestingly, EMT signaling events were not predicted by pathway analysis of significantly down regulated predicted targets. Overall, given our biological data demonstrating an increase of the MET regulating gene, CDH1, and a loss of cellular migration in vitro, along with pathway analysis of transcriptome changes suggest that miR-200b-3p/200b-5p act to inhibit the invasive phenotype of TNBC through non-canonical signaling. Of interest was the repeated evidence of inhibition of the RHO signaling pathway
hsa-miR-200b-5p hsa-miR-200b-3p Count
UAAUACUGCCUGGUAAAGAUGAC 4 UAAUACUGCCUGGUAAGGAUGAC 8 UAAUACUGCCUGGUAACGAUGAC 2 UAAUACUGCCUGGUAGUGAUGAC 2 UAAUACUGCCUGGUAAUAAUGAC 1 UAAUACUGCCUGGUACUGAUGAC 1 UAAUACUGCCUGGUAAGGAUGACA 1 UAAUACUGCCUGGUAAGGAUGACC 1 UAAUACUGCCUGGUAGUGAUGACU 1 UAAUACGGCCUGGUAAUGAUGACU 1 AAUACUGCCUGGUAUUCAUGACU 1
AAUACUGCCUGGUAUUCAUGACU 1 UAAUACUGCCUGGUAAUGAAT 6 UAAUACUGCCUGGUAAUG 11
UAAUACUGCCUGGUAAU 17
evident by pathway analysis of down regulated target genes for both miR-200b-3p and miR-200b-5p.
To determine relevance of miR-200b-3p/200b-5p targeting of the RHOGDI signaling pathway in the TNCB phenotype, we performed analysis of previously published patient tumor data freely available through The Cancer Genome Atlas (TCGA) in collaboration with the UCSC Cancer Browser [46–49]. The genes RHOGDI associated genes RHOA, LIMK1, CDC42,
[image:8.612.79.551.53.525.2]RAC1, ROCK2, ITGA2, ITGA1, PRKCA, PIP4K2A were analyzed. These genes were chosen based on predicted targets of miR-200b-3p/200b-5p which demonstrated significantly repressed expression in our deep sequencing data or based on relevance to RHOGDI pathway. Of interest PRKCA demonstrated significantly higher levels of expression in basal like tumors and is a miR-200b-5p predicted target (Figure 5A). To better evaluate the differences between PRKCA and the triple negative
Figure 4: miR-200b-3p and miR-200b-5p Display Synonymous Regulation Patterns of Target Pathways. Deep sequencing analysis for gene fold change and altered pathways in the MDA-MB-231-miR-200b cell line. (A) Graphical representation of observed fold change of genes which contain either a miR-200b-3p or miR-200b-5p seed site with significantly altered expression by deep sequencing. (B) and (C) represent top pathways predicted to be affected by genes which contain either a miR-200b-3p (B) or miR-200b-5p (C) seed site and were observed to be significantly down regulated. Pathways were determined through the use of IPA (Ingenuity® Systems,
phenotype, qPCR was performed for PRKCA across ER+ and triple negative breast cancer cell lines. PRKCA
demonstrated no significant change in expression levels between the two cohorts (Supplemental Figure 1). The relevance of interactions between PRKCA, miR-200b, and EMT has been recently evaluated and there is an emerging importance of this pathway in relation to EMT in TNBC [19, 50]. Importantly, we demonstrate that key components of the RHOGDI pathway demonstrate loss of 3’UTR (DLC1, ROCK2) in the MDA-MB-231 cell line. This may emerge as an important factor for consideration when developing methods for intervention.
DISCUSSION
microRNAs are key regulators of breast cancer progression where alterations in their expression can give rise to EMT and metastasis. While conventional studies on miRNAs demonstrate alterations in miRNA expression
[image:9.612.61.558.62.474.2]correlating to an enhanced breast cancer phenotype, the utilization of deep sequencing adds greater depth to changes in miRNA expression. Recent evidence suggests that the miRNA is more complex than previously thought. A single miRNA transcript has the potential to give rise to multiple isomiRs which have differences in expression in both the guide and star strand. Here we demonstrate that the ectopic expression of the pri-miR-200b gives rise to both miR-200b-3p and miR-200b-5p in addition to altered isomiRs for each miRNA, where both miR-200b-3p and miR-200b-5p demonstrated 3’heterogenity. In fact, the more prominent transcript of miR-200b-3p expressed in our MDA-MB-231 cell line is truncated at the 3’ end. The effects of miRNA 3’heterogenity on biological targeting and miRNA expression remain to be determined and warrant further investigation. Interestingly, while miR-200b-3p is expressed in isomiRs of variable length, there is greater consistency in the expression of the less-conventional miR-200b-5p isomiR.
Table 3: Loss of 3’UTR in genes with miR-200b-3p and miR-200b-5p seed sites
miR-200b-3p miR-200b-5p
Target gene Expression 3′UTR Loss Fold Change Target gene Expression 3′UTR Loss Fold Change
ABI2 Unchanged No AHR Unchanged Yes
BAP1 Unchanged No ALG2 Unchanged Yes
CAST Unchanged Yes AQR Unchanged Yes
COX7C Increased Yes 1.33 (p < 0.01) BTBD1 Increased Yes 1.37 (p < 0.05) CYTH3 Unchanged No CHSY1 Unchanged Yes
DLC1 Increased Yes 1.97 (p < 0.001) CPNE3 Increased Yes 1.27 (p < 0.05) DOCK4 Unchanged Yes EPT1 Unchanged No
DUSP1 Increased Yes 3.89 (p < 0.001) FZD3 Increased Yes 1.94 (p < 0.001) ELK4 Unchanged Yes HNRNPU Unchanged Yes
ELL2 Unchanged Yes KCTD12 Unchanged Yes
HS3ST1 Increased Yes 2.06 (p < 0.01) LAP3 Unchanged Yes
JUN Unchanged No NAMPT Unchanged Yes
KIF1B Unchanged Yes ORC2 Unchanged Yes
RNGTT Unchanged Yes PCMTD2 Unchanged Yes
ROCK2 Unchanged Yes PPRC1 Increased Yes 1.52 (p < 0.001) RRP15 Unchanged Yes RAP2A Unchanged No
TRIM33 Unchanged Yes SDPR Unchanged Yes
UBE2B Unchanged Yes UBE3A Unchanged No USP46 Unchanged Yes UHMK1 Unchanged No WDR91 Unchanged No UHRF1BP1 Unchanged Yes
WIPF1 Unchanged Yes USP22 Unchanged Yes
Mechanisms for this may be due to differences in the proteins associated with miRNA biogenesis, such as the argonautes. There are four argounatue (AGO) proteins in humans AGO1–4 and evaluation of alterations in AGO1– 4 gene expression across breast cancer cell lines and tumor samples has shown that AGO2 is increased in ER
-samples versus ER+ while there is no change in AGO1,
AGO3, or AGO4 [51]. Additionally the AGO proteins select for miRNA isomiRs and this selection is based on changes in both 5’ and 3’ heterogeneity [52]. Evaluation of changes in AGO expression and the implications on interactions with tumor suppressive miRNAs such as the miR-200 family may give greater insight into differences
[image:10.612.98.518.47.471.2]in miRNA expression changes in TNBC. There were few alteration to the 5’ends of the miR-200b-3p and miR-200b-5p isomiRs. As the 5’end of the miRNA dictates the possible mRNA targets, this is important as it suggests that conventional mRNA targets of miR-200b-3p and miR-200b-5p should be repressed. Despite intact seed sequence in our miRNAs, few predicted targets of both miR-200b-3p and miR-200b-5p are repressed in the MDA-MB-231-200b cell line. Further analysis of predicted targets of miR-200b-3p and miR-200b-5p demonstrated a loss of targeting due to shortening of 3’UTR in the target mRNA. Actively proliferating cells and cancers demonstrate loss of 3’UTR through increased
alternative polyadenylation (APA) [53, 54]. Shortening of the 3’UTR will result in loss of gene targeting by miRNAs as there are fewer seed sites present in the 3’UTR. Pri-miR-200b transfection into the mesenchymal MDA-MB-231 cell line resulted in loss of repression of many miR-200b-3p and miR-200b-5p targets. This evaluation draws to light considerations that must be made when evaluating treatments for breast cancer. New predictions for therapies suggest the modulation of miRNAs and demonstrate increased miRNA expression following drug treatment [55]. However our study suggests that the mRNA transcriptome must also be evaluated for miRNA modulation to be effective. Loss of 3’UTR in TNBC may dampen the effect of miRNA intervention due to loss of available seed-sites. In conjunction with previous studies on the miR-200 family, we demonstrate loss of miR-200b-3p expression in the basal TNBC compared to ER+/epithelial cancer cell lines,
in addition we expand on this by showing miR-200b-5p is also equally reduced. In addition miR-200b-3p is unable to fully repress ZEB1 and ZEB2 suggesting that basal/TNBC have escaped the canonical ZEB/miR-200b feedback loop. Despite the lack of a large effect on ZEB1 and ZEB2, we demonstrate CDH1 repression and loss of invasive capacity in MDA-MB-231 –miR-200b cells. We suggest that this is through the fidelity in the targeting of miR-200b-3p and miR-200b-5p where both miRNAs target the RHOGDI signaling pathway. Non-canonical targeting of the RHO pathway by miR-200b-3p has also been recently demonstrated [14]. We expanded on these findings by demonstrating alterations in the RHOGDI signaling pathway correlate with a TNBC phenotype in clinical samples.
miR-200b-3p can directly target the 3’UTR of PRKCA and inhibition of metastasis of TNBC, supporting our findings [19]. Additionally, PRKCA can activate RHOGDI, which in turn activates RHOA, illustrating the importance of PRKCA and RHO signaling in the progression and metastasis of TNBC. Our data indicates that miR-200b-5p may also directly target PRKCA, while miR-200b-3p is predicted to target RHOA in addition to PRKCA. Figure 5B illustrates the predicted miR-200b-3p and miR-200b-5p targeting of the RHO signaling pathway at multiple points, with down regulated genes indicated in blue. The importance of these findings demonstrates novel mechanisms for the intervention of TNBC.
MATERIALS AND METHODS
Cells and reagentsMCF-7, ZR75, MDA-MB-157, MDA-MB-231, Hs578t, and BT-549 human breast cancer cell lines were acquired from American Type Culture Collection (Manassas, VA). Liquid nitrogen stocks were made upon
receipt and maintained until the start of study. Morphology and doubling times were also recorded regularly to ensure maintenance of phenotype for all cell lines. Cells were used for no more than 6 months after being thawed. Cells were maintained as previously described [56]. Briefly cells were maintained at 37°, 5% CO2 in DMEM (Invitrogen, Carlsbad, CA, USA) supplemented with 10% fetal bovine serum (Hyclone, Salt Lake City, UT, USA) and 1% penicillin/streptomycin (Invitrogen).
RNA extraction and quantitative
Real Time RT-PCR MDA-MB-231-vector and MDA-MB-miR-200b cells were harvested for total RNA extraction using Qiagen RNeasy RNA purification system or for microRNA miRNeasy purification system per manufacturer’s protocol (Qiagen, Valencia, CA). Quantity and quality of the RNA and miRNA were determined by absorbance at 260 and 280 nm using the NanoDrop ND-1000. 2ug of total RNA was reverse-transcribed using the iScript kit (BioRad Laboratories, Hercules, CA) and qPCR was performed using SYBR-green (Bio-Rad Laboratories, Hercules, CA). β-Actin, CDH1, PRKCA, ZEB1, and ZEB2 amplified n > 3. miRNA was reverse–transcribed using the SABiosciences RT2 miRNA first strand kit (Qiagen, Valencia, CA) and qPCR was performed using SABiosciences SYBR green, 3p, miR-200b-5p, and U6 primer purchased from Qiagen (Valencia, CA). Data was analyzed by comparing relative target gene expression to β-actin for mRNA and U6 for miRNA. Relative gene expression was analyzed using 2-ΔΔCt method [57].
Transfection of cell lines
pri-miR-200b and empty vector pLemir plasmids were purchased from Open Biosystems (Lafayette, CO). MDA-MB-231 cell line was transfected through lenti-viral transfection as previously described [58] and retrovirus packing was performed following the manufacturer’s instructions (Thermo ScientificBio, Pittsburgh PA). The following day cells were treated with 300 ng/ml puromycin. Cells were maintained in 10% DMEM and treated with 300 ng/ml puromycin every two days for 2 weeks. Colonies were pooled and verification of mature miR-200b-3p and later -5p overexpression was confirmed using qPCR for mature miR-200b-3p and -5p. Stable pools were maintained in 10% DMEM as described above.
RNA-sequencing analysis
do not have to correspond to an identified isoform). After mapping the collapsed read set was expanded back to its original size both so that the disposition for every read could be accounted for and to facilitate the use of other tools expecting a standard SAM formatted dataset. Counts were determined from the expanded set of reads. Typically a read was mapped to one and only one annotated element in the human genome. While unlikely due to the strandedness of the reads, a read that was mapped to multiple genes in the genome incremented the count for each gene. Reads that map to multiple locations were marked as ambiguous and were not counted. Reads that were marked as repetitive (due to RepeatMasker) were used only if they could be mapped to a unique location in the genome.
Differential gene expression was determined using the edgeR software [60] [version 2.6.0] by supplying it the raw gene counts. Dispersion was estimated using both the estimatecommonDisp and estimateTagwiseDisp methods [61, 62]. A prior n value = 10 was used for running estimateTagwiseDisp. The exactTest method was run using default parameters allowing edgeR to decide which dispersions to use [63]. Pathway analysis was performed using GeneGo Metacore (Thomson Reuters). The Enrichment Analysis Workflow was performed using the gene list, fold-change and p-value scores generated by edgeR. A threshold p-value of < 0.05, and threshold fold-change < 0.5 was set when performing the analysis in GeneGo.
Data derived from RNA sequencing were analyzed for pathway analysis through the use of QIAGEN’s Ingenuity® Pathway Analysis (IPA®, QIAGEN Redwood
City, www.qiagen.com/ingenuity).
Transwell migration assay
Migration assays were performed following the manufacturer’s instructions (BD Biosciences, San Jose, CA) and as previously published [64]. Cells were seeded at a density of 2.5 × 10⁴ cells per well in serum free media.
DMEM supplemented with 10% FBS (10%) was used as a chemo-attractant. DMEM without FBS (0%) served as a negative control. After 24 hours, migrated cells were fixed to the membranes and stained. Migrated cells visualized by microscopy, and data is represented as number of migrated cells per field of view ± SEM for triplicate experiments.
Breast cancer data sources
Breast cancer gene expression deep sequencing was viewed through the University California Santa Cruz (UCSC) Cancer Genomics Browser and compiled by The Cancer Genome Atlas (TCGA) research network [46–49]. The TCGA dataset used was the breast invasive carcinoma and it was analyzed for gene expression aligned through the Illumina HiSeq system total tumor samples were n = 1032.
Statistical analysis
Statistical Analysis was performed using Graph Pad Prism 5. Student’s t-test was used to determine p
values and statistically significant values had a p values of < 0.05.
GRANT SUPPORT
This research was supported by National Institutes of Health- CA125806, The Office of Naval Research N00014-16-1-1136 (ME Burow) and Supported in part by 1 U54 GM104940 from the National Institute of General Medical Sciences of the National Institutes of Health, which funds the Louisiana Clinical and Translational Science Center.” NIH grant number is 1 U54 GM104940, (Louisiana Clinical and Translational Science Center), National Center for Research Resources P20RR020152 and The Department of Defense Breast Cancer Research Program BC085426 (BM Collins–Burow). NCI-U54 CA113001-07 Epigenetic Changes in Cancer Genomes (The Integrative Cancer Biology Program (ICBP): Centers for Cancer Systems Biology (CCSB) (KP Nephew), and was supported by the National Institute of General Medical Sciences of the National Institutes of Health under Award Number P20GM103518. The content is solely the responsibility of the authors and does not necessarily represent the official views of the National Institutes of Health.
REFERENCES
1. Sorlie T, Perou CM, Tibshirani R, Aas T, Geisler S, Johnsen H, Hastie T, Eisen MB, van de Rijn M, Jeffrey SS, et al Gene expression patterns of breast carcinomas dis-tinguish tumor subclasses with clinical implications.
Proceedings of the National Academy of Sciences of the United States of America 2001; 98:10869–74.
2. Dent R, Trudeau M, Pritchard KI, Hanna WM, Kahn HK, Sawka CA, Lickley LA, Rawlinson E, Sun P, Narod SA. Triple-negative breast cancer: clinical features and patterns of recurrence. Clinical cancer research : an official journal of the
American Association for Cancer Research 2007; 13:4429–34. 3. Lehmann BD, Bauer JA, Chen X, Sanders ME,
Chakravarthy AB, Shyr Y, Pietenpol JA. Identification of human triple-negative breast cancer subtypes and preclini-cal models for selection of targeted therapies. The Journal of clinical investigation 2011; 121:2750–67.
4. Rao X, Di Leva G, Li M, Fang F, Devlin C, Hartman-Frey C, Burow ME, Ivan M, Croce CM, Nephew KP. MicroRNA-221/222 confers breast cancer fulvestrant resis-tance by regulating multiple signaling pathways. Oncogene. 2011; 30:1082–97.
breast cancer by targeting the suppressor of cytokine sig-naling 1 gene. Cancer research. 2010; 70:3119–27. 6. Singh R, Mo YY. Role of microRNAs in breast cancer.
Cancer biology & therapy. 2013; 14:201–12.
7. Castilla MA, Diaz-Martin J, Sarrio D, Romero-Perez L, Lopez-Garcia MA, Vieites B, Biscuola M, Ramiro-Fuentes S, Isacke CM, Palacios J. MicroRNA-200 family modulation in distinct breast cancer phenotypes. PloS one. 2012; 7:e47709.
8. Sato Y, Kobayashi H, Suto Y, Olney HJ, Davis EM, Super HG, Espinosa R, 3rd , Le Beau MM, Rowley JD. Chromosomal instability in chromosome band 12p13: multiple breaks leading to complex rearrangements including cytogenetically undetect-able sub-clones. Leukemia. 2001; 15:1193–202.
9. Saydam O, Shen Y, Wurdinger T, Senol O, Boke E, James MF, Tannous BA, Stemmer-Rachamimov AO, Yi M, Stephens RM, Fraefel C, Gusella JF, Krichevsky AM, Breakefield XO. Downregulated microRNA-200a in menin-giomas promotes tumor growth by reducing E-cadherin and activating the Wnt/beta-catenin signaling pathway.
Molecular and cellular biology. 2009; 29:5923–40. 10. Park SM, Gaur AB, Lengyel E, Peter ME. The miR-200
family determines the epithelial phenotype of cancer cells by targeting the E-cadherin repressors ZEB1 and ZEB2.
Genes & development . 2008; 22:894–907.
11. Hill L, Browne G, Tulchinsky E. ZEB/miR-200 feedback loop: at the crossroads of signal transduction in cancer.
International journal of cancer Journal international du
cancer. 2013; 132:745–54.
12. Li X, Roslan S, Johnstone CN, Wright JA, Bracken CP, Anderson M, Bert AG, Selth LA, Anderson RL, Goodall GJ, Gregory PA, Khew-Goodall Y. MiR-200 can repress breast cancer metastasis through ZEB1-independent but moesin-dependent pathways. Oncogene. 2014; 33:4077–88. 13. Gregory PA, Bracken CP, Smith E, Bert AG, Wright JA,
Roslan S, Morris M, Wyatt L, Farshid G, Lim YY, Lindeman GJ, Shannon MF, Drew PA, Khew-Goodall Y, Goodall GJ. An autocrine TGF-beta/ZEB/miR-200 signal-ing network regulates establishment and maintenance of epithelial-mesenchymal transition. Molecular biology of the cell. 2011; 22:1686–98.
14. Bracken CP, Li X, Wright JA, Lawrence DM, Pillman KA, Salmanidis M, Anderson MA, Dredge BK, Gregory PA, Tsykin A, Neilsen C, Thomson DW, Bert AG, Leerberg JM, Yap AS, Jensen KB, Khew-Goodall Y, Goodall GJ. Genome-wide identification of miR-200 targets reveals a regulatory network controlling cell invasion. The EMBO
journal. 2014; 33:2040–56.
15. Wang B, Li J, Sun M, Sun L, Zhang X. MiRNA expres-sion in breast cancer varies with lymph node metastasis and other clinicopathologic features. IUBMB life. 2014; . 16. Ye F, Tang H, Liu Q, Xie X, Wu M, Liu X, Chen B, Xie X.
miR-200b as a prognostic factor in breast cancer targets mul-tiple members of RAB family. Journal of translational medi-cine. 2014; 12:17.
17. Farazi TA, Ten Hoeve JJ, Brown M, Mihailovic A, Horlings HM, van de Vijver MJ, Tuschl T, Wessels LF. Identification of distinct miRNA target regulation between breast cancer molecular subtypes using AGO2-PAR-CLIP and patient datasets. Genome biology. 2014; 15:R9. 18. Kramer N, Walzl A, Unger C, Rosner M, Krupitza G,
Hengstschlager M, Dolznig H. In vitro cell migration and invasion assays. Mutation research. 2013; 752:10–24. 19. Humphries B, Wang Z, Oom AL, Fisher T, Tan D, Cui Y,
Jiang Y, Yang C. MicroRNA-200b targets protein kinase calpha and suppresses triple-negative breast cancer metas-tasis. Carcinogenesis. 2014; 35:2254–63.
20. Guarino M, Rubino B, Ballabio G. The role of epithelial-mesenchymal transition in cancer pathology. Pathology. 2007; 39:305–18.
21. Berx G, Raspe E, Christofori G, Thiery JP, Sleeman JP. Pre-EMTing metastasis?. Recapitulation of morphogenetic processes in cancer. Clinical & experimental metastasis. 2007; 24:587–97.
22. Kong D, Li Y, Wang Z, Sarkar FH. Cancer stem cells and epithelial-to-mesenchymal transition (EMT)-phenotypic cells: are they cousins or twins? Cancers. 2011; 3:716–29. 23. Schmalhofer O, Brabletz S, Brabletz T. E-cadherin,
beta-catenin, and ZEB1 in malignant progression of cancer.
Cancer metastasis reviews . 2009; 28:151–66.
24. Thiery JP, Sleeman JP. Complex networks orchestrate epi-thelial-mesenchymal transitions. Nature reviews Molecular cell biology. 2006; 7:131–42.
25. Comijn J, Berx G, Vermassen P, Verschueren K, van Grunsven L, Bruyneel E, Mareel M, Huylebroeck D, van Roy F. The two-handed E box binding zinc finger protein SIP1 downregulates E-cadherin and induces invasion.
Molecular cell. 2001; 7:1267–78.
26. Eger A, Aigner K, Sonderegger S, Dampier B, Oehler S, Schreiber M, Berx G, Cano A, Beug H, Foisner R. DeltaEF1 is a transcriptional repressor of E-cadherin and regulates epithelial plasticity in breast cancer cells. Oncogene. 2005; 24:2375–85.
27. Gregory PA, Bert AG, Paterson EL, Barry SC, Tsykin A, Farshid G, Vadas MA, Khew-Goodall Y, Goodall GJ. The miR-200 family and miR-205 regulate epithelial to mesen-chymal transition by targeting ZEB1 and SIP1. Nature cell biology. 2008; 10:593–601.
28. Korpal M, Lee ES, Hu G, Kang Y. The miR-200 family inhibits epithelial-mesenchymal transition and cancer cell migration by direct targeting of E-cadherin transcriptional repressors ZEB1 and ZEB2. The Journal of biological chemistry. 2008; 283:14910–4.
29. Hanna S, El-Sibai M. Signaling networks of Rho GTPases in cell motility. Cellular signalling. 2013; 25:1955–61. 30. Bohm M, Totzeck B, Birchmeier W, Wieland I. Differences
31. Birchmeier W, Behrens J. Cadherin expression in carcino-mas: role in the formation of cell junctions and the preven-tion of invasiveness. Biochimica et biophysica acta. 1994; 1198:11–26.
32. Martin EC, Elliott S, Rhodes LV, Antoon JW, Fewell C, Zhu Y, Driver JL, Jodari-Karimi M, Taylor CW, Flemington EK, Beckman BS, Collins-Burow BM, Burow ME. Preferential star strand biogenesis of pre-miR-24-2 targets PKC-alpha and suppresses cell survival in MCF-7 breast cancer cells. Molecular carcinogenesis. 2014; 53:38–48.
33. Li SC, Liao YL, Ho MR, Tsai KW, Lai CH, Lin WC. miRNA arm selection and isomiR distribution in gastric cancer. BMC genomics. 2012; 13:S13.
34. Chan YT, Lin YC, Lin RJ, Kuo HH, Thang WC, Chiu KP, Yu AL. Concordant and discordant regulation of target genes by miR-31 and its isoforms. PloS one. 2013; 8:e58169. 35. Chen B, Zhang B, Luo H, Yuan J, Skogerbo G, Chen R.
Distinct MicroRNA Subcellular Size and Expression Patterns in Human Cancer Cells. International journal of
cell biology. 2012; 2012:672462.
36. Llorens F, Hummel M, Pantano L, Pastor X, Vivancos A, Castillo E, Mattlin H, Ferrer A, Ingham M, Noguera M, Kofler R, Dohm JC, Pluvinet R, Bayes M, Himmelbauer H, del Rio JA, Marti E, Sumoy L. Microarray and deep sequencing cross-platform analysis of the mirRNome and isomiR variation in response to epidermal growth factor.
BMC genomics. 2013; 14:371.
37. Kozomara A, Griffiths-Jones S. miRBase: annotating high confidence microRNAs using deep sequencing data.
Nucleic acids research. 2014; 42:D68–73.
38. Kozomara A, Griffiths-Jones S. miRBase: integrating microRNA annotation and deep-sequencing data. Nucleic acids research. 2011; 39:D152–7.
39. Griffiths-Jones S, Grocock RJ, van Dongen S, Bateman A, Enright AJ. miRBase: microRNA sequences, targets and gene nomenclature. Nucleic acids research. 2006; 34:D140–4. 40. Griffiths-Jones S, Saini HK, van Dongen S, Enright AJ.
miRBase: tools for microRNA genomics. Nucleic acids research. 2008; 36:D154–8.
41. Grad Y, Aach J, Hayes GD, Reinhart BJ, Church GM, Ruvkun G, Kim J. Computational and experimental identification of C. elegans microRNAs. Molecular cell. 2003; 11:1253–63.
42. Michael MZ, SM OC, van Holst Pellekaan NG, Young GP, James RJ. Reduced accumulation of specific microRNAs in colorectal neoplasia. Molecular cancer research MCR. 2003; 1:882–91.
43. Altuvia Y, Landgraf P, Lithwick G, Elefant N, Pfeffer S, Aravin A, Brownstein MJ, Tuschl T, Margalit H. Clustering and conservation patterns of human microRNAs. Nucleic acids research: 2005; 33:2697–706.
44. Landgraf P, Rusu M, Sheridan R, Sewer A, Iovino N, Aravin A, Pfeffer S, Rice A, Kamphorst AO, Landthaler M,
Lin C, Socci ND, Hermida L, Fulci V, Chiaretti S, Foa R, Schliwka J, Fuchs U, Novosel A, Muller RU, Schermer B, Bissels U, Inman J, Phan Q, Chien M, Weir DB, Choksi R, De Vita G, Frezzetti D, Trompeter HI, Hornung V, Teng G, Hartmann G, Palkovits M, Di Lauro R, Wernet P, Macino G, Rogler CE, Nagle JW, Ju J, Papavasiliou FN, Benzing T, Lichter P, Tam W, Brownstein MJ, Bosio A, Borkhardt A, Russo JJ, Sander C, Zavolan M, Tuschl T. A mammalian microRNA expression atlas based on small RNA library sequencing. Cell. 2007; 129:1401–14. 45. Lui WO, Pourmand N, Patterson BK, Fire A. Patterns of
known and novel small RNAs in human cervical cancer.
Cancer research. 2007; 67:6031–43.
46. Goldman M, Craft B, Swatloski T, Ellrott K, Cline M, Diekhans M, Ma S, Wilks C, Stuart J, Haussler D, Zhu J. The UCSC cancer genomics browser: update 2013. Nucleic acids research. 2013; 41:D949–54.
47. Sanborn JZ, Benz SC, Craft B, Szeto C, Kober KM, Meyer L, Vaske CJ, Goldman M, Smith KE, Kuhn RM, Karolchik D, Kent WJ, Stuart JM, Haussler D, Zhu J. The UCSC cancer genomics browser: update 2011. Nucleic acids research. 2011; 39:D951–9.
48. Vaske CJ, Benz SC, Sanborn JZ, Earl D, Szeto C, Zhu J, Haussler D, Stuart JM. Inference of patient-specific path-way activities from multi-dimensional cancer genomics data using PARADIGM. Bioinformatics. 2010; 26:i237–45. 49. Zhu J, Sanborn JZ, Benz S, Szeto C, Hsu F, Kuhn RM,
Karolchik D, Archie J, Lenburg ME, Esserman LJ, Kent WJ, Haussler D, Wang T. The UCSC cancer genomics browser. Nature methods. 2009; 6:239–40.
50. Wang Z, Humphries B, Xiao H, Jiang Y, Yang C. MicroRNA-200b suppresses arsenic-transformed cell migration by targeting protein kinase Calpha and Wnt5b-protein kinase Calpha positive feedback loop and inhibiting Rac1 activation. The Journal of biological chemistry. 2014; 289:18373–86.
51. Adams BD, Claffey KP, White BA. Argonaute-2 expres-sion is regulated by epidermal growth factor receptor and mitogen-activated protein kinase signaling and corre-lates with a transformed phenotype in breast cancer cells.
Endocrinology. 2009; 150:14–23.
52. Burroughs AM, Ando Y, de Hoon MJ, Tomaru Y, Suzuki H, Hayashizaki Y, Daub CO. Deep-sequencing of human argonaute-associated small RNAs provides insight into miRNA sorting and reveals argonaute association with RNA fragments of diverse origin. RNA biology. 2011; 8:158–77.
53. Sandberg R, Neilson JR, Sarma A, Sharp PA, Burge CB. Proliferating cells express mRNAs with shortened 3’ untranslated regions and fewer microRNA target sites.
Science. 2008; 320:1643–7.
55. Barh D, Malhotra R, Ravi B, Sindhurani P. MicroRNA let-7: an emerging next-generation cancer therapeutic.
Current oncology. 2010; 17:70–80.
56. Salvo VA, Boue SM, Fonseca JP, Elliott S, Corbitt C, Collins-Burow BM, Curiel TJ, Srivastav SK, Shih BY, Carter-Wientjes C, Wood CE, Erhardt PW, Beckman BS, McLachlan JA, Cleveland TE, Burow ME. Antiestrogenic glyceollins suppress human breast and ovarian carcinoma tumorigenesis.
Clinical cancer research : an official journal of the American
Association for Cancer Research. 2006; 12:7159–64. 57. Schmittgen TD, Zakrajsek BA, Mills AG, Gorn V,
Singer MJ, Reed MW. Quantitative reverse transcrip-tion-polymerase chain reaction to study mRNA decay: comparison of endpoint and real-time methods. Analytical biochemistry. 2000; 285:194–204.
58. Tate CR, Rhodes LV, Segar HC, Driver JL, Pounder FN, Burow ME, Collins-Burow BM. Targeting triple-negative breast cancer cells with the histone deacetylase inhibi-tor panobinostat. Breast cancer research : BCR. 2012; 14:R79.
59. Miller DF, Yan PS, Buechlein A, Rodriguez BA, Yilmaz AS, Goel S, Lin H, Collins-Burow B, Rhodes LV, Braun C, Pradeep S, Rupaimoole R, Dalkilic M, Sood AK, Burow ME, Tang H, Huang TH, Liu Y, Rusch DB, Nephew KP. A new method for stranded whole transcrip-tome RNA-seq. Methods. 2013; 63:126–34.
60. Robinson MD, McCarthy DJ, Smyth GK. edgeR: a Bioconductor package for differential expression analysis of digital gene expression data. Bioinformatics. 2010; 26:139–40. 61. Robinson MD, Smyth GK. Moderated statistical tests for
assessing differences in tag abundance. Bioinformatics. 2007; 23:2881–7.
62. Robinson MD, Smyth GK. Small-sample estimation of negative binomial dispersion, with applications to SAGE data. Biostatistics. 2008; 9:321–32.
63. McCarthy DJ, Chen Y, Smyth GK. Differential expression analysis of multifactor RNA-Seq experiments with respect to biological variation. Nucleic acids research. 2012; 40:4288–97.
64. Rhodes LV, Antoon JW, Muir SE, Elliott S, Beckman BS, Burow ME. Effects of human mesenchymal stem cells on ER-positive human breast carcinoma cells mediated through ER-SDF-1/CXCR4 crosstalk. Molecular cancer. 2010; 9:295.
65. Bisso A, Faleschini M, Zampa F, Capaci V, De Santa J, Santarpia L, Piazza S, Cappelletti V, Daidone M, Agami R, Del Sal G. Oncogenic miR-181a/b affect the DNA damage response in aggressive breast cancer. Cell Cycle. 2013; 12:1679–87. 66. Xu K, Liang X, Cui D, Wu Y, Shi W, Liu J. miR-1915
inhibits Bcl-2 to modulate multidrug resistance by increas-ing drug-sensitivity in human colorectal carcinoma cells.
Molecular carcinogenesis. 2013; 52:70–8.
67. Wang Z, Wang B, Shi Y, Xu C, Xiao HL, Ma LN, Xu SL, Yang L, Wang QL, Dang WQ, Cui W, Yu SC, Ping YF, Cui YH, Kung HF, Qian C, Zhang X, Bian XW. Oncogenic miR-20a and miR-106a enhance the invasiveness of human glioma stem cells by directly targeting TIMP-2. Oncogene. 2014; doi: 10.1038/onc.2014.75.
68. Yan LX, Huang XF, Shao Q, Huang MY, Deng L, Wu QL, Zeng YX, Shao JY. MicroRNA miR-21 overexpression in human breast cancer is associated with advanced clinical stage, lymph node metastasis and patient poor prognosis.
Rna . 2008; 14:2348–60.
69. Nassirpour R, Mehta PP, Baxi SM, Yin MJ. miR-221 promotes tumorigenesis in human triple negative breast cancer cells. PloS one. 2013; 8:e62170.
70. Davalos A, Goedeke L, Smibert P, Ramirez CM, Warrier NP, Andreo U, Cirera-Salinas D, Rayner K, Suresh U, Pastor-Pareja JC, Esplugues E, Fisher EA, Penalva LO, Moore KJ, Suarez Y, Lai EC, Fernandez-Hernando C. miR-33a/b contribute to the regulation of fatty acid metabolism and insulin signaling. Proceedings of the National Academy of Sciences of the United States of America. 2011; 108:9232–7.
71. Cirera-Salinas D, Pauta M, Allen RM, Salerno AG, Ramirez CM, Chamorro-Jorganes A, Wanschel AC, Lasuncion MA, Morales-Ruiz M, Suarez Y, Baldan A, Esplugues E, Fernandez-Hernando C. Mir-33 regulates cell proliferation and cell cycle progression. Cell cycle. 2012; 11:922–33.
72. Zhao BS, Liu SG, Wang TY, Ji YH, Qi B, Tao YP, Li HC, Wu XN. Screening of microRNA in patients with esopha-geal cancer at same tumor node metastasis stage with differ-ent prognoses. Asian Pacific journal of cancer prevention :
APJCP. 2013; 14:139–43.
73. Boyerinas B, Park SM, Hau A, Murmann AE, Peter ME. The role of let-7 in cell differentiation and cancer.