Chemistry Dissertations Department of Chemistry
12-15-2016
To Affinity & Beyond: Exploring Sequence
Selectivity of Small Molecules for the DNA Minor
Groove
Sarah Laughlin-Toth Georgia State University
Follow this and additional works at:https://scholarworks.gsu.edu/chemistry_diss
This Dissertation is brought to you for free and open access by the Department of Chemistry at ScholarWorks @ Georgia State University. It has been accepted for inclusion in Chemistry Dissertations by an authorized administrator of ScholarWorks @ Georgia State University. For more information, please [email protected].
Recommended Citation
Laughlin-Toth, Sarah, "To Affinity & Beyond: Exploring Sequence Selectivity of Small Molecules for the DNA Minor Groove." Dissertation, Georgia State University, 2016.
MOLECULES FOR THE DNA MINOR GROOVE
by
SARAH LAUGHLIN-TOTH
Under the Direction of W. David Wilson, Ph.D.
ABSTRACT
A common approach to treating many illnesses is through targeting a specific protein.
Gene-related illnesses, however, are particularly difficult to treat and targeting the gene with small
molecules for drug development is an alternative approach. This is an attractive area because it
provides new and potential methods for regulating the expression of diseased-genes. Dicationic
diamidines are a class of small molecules which bind in the DNA minor groove where most gene
control proteins, such as transcription factors, do not interact. These small molecules can modulate
various processes through allosteric interactions and provide therapeutic potential. Typically, these
compounds have an inherent selectivity towards sites rich in A∙T base pairs (bps). Many synthetic
extended to include G∙C bps and distinguishability among A∙T bp sites.
Many biophysical methods can be used to investigate small molecule-DNA interactions
and the development of competition mass spectrometry, in particular, has helped do this.
Competition electrospray ionization mass spectrometry (ESI-MS) is a powerful, novel screening
technique used to identify biomolecular interactions. This method identifies important information
such as stoichiometry, relative binding affinity, and cooperativity and can be used for a number of
analyses. It is particularly useful when applied as a competition assay to quickly and accurately
pinpoint the preferred target site of a compound among many DNA sequences. Our competition
ESI-MS methodology has been used to investigate the sequence specific interaction of diamidines
with DNA and discover binding sites for synthetic compounds. Combining ESI-MS with other
biophysical techniques has successfully identified patterns of recognition and the selectivity of
DNA minor groove binding compounds. With this information, we have developed a detailed
understanding of the variations in sequences and their effects on compound recognition. This will
ultimately lead to more sequence specific, rationally designed compounds with fewer off-target
effects.
INDEX WORDS: DNA, Electrospray ionization mass spectrometry (ESI-MS), Microstructure,
Minor groove binder, Minor groove recognition, Molecular dynamics (MD), Sequence
MOLECULES FOR THE DNA MINOR GROOVE
by
SARAH LAUGHLIN-TOTH
A Dissertation Submitted in Partial Fulfillment of the Requirements for the Degree of
Doctor of Philosophy
in the College of Arts and Sciences
Georgia State University
Copyright by
MOLECULES FOR THE DNA MINOR GROOVE
by
SARAH LAUGHLIN-TOTH
Committee Chair: W. David Wilson
Committee: David W. Boykin
Markus W. Germann
Electronic Version Approved:
Office of Graduate Studies
College of Arts and Sciences
Georgia State University
DEDICATION
To my husband, Chris:
Thank you for being my biggest supporter. Through many late nights, early mornings, lost
weekends and holidays, and through moments of up and down. I would not have been able to
achieve this without uncondtional love and support from you.
To my mother and stepfather: Tonhja and Layton
To my sister and family: Jess, Ryan, Jacob, Nathan and Mallory
To my other parents: Glenn and Jean
&
ACKNOWLEDGEMENTS
To say that I am appreciative for the guidance I have received under David Wilson’s advisement
would be an understatement. Patience, words of encouragement, the freedom to think and do for
myself, the ability to be taught and to teach others – these are only a few qualities I learned or
improved on as a student, but ones I will carry with me wherever I go. I cannot imagine a better
group to have joined and to have spent the last five years with. David and Carol Wilson have
helped me to become both best best scientist (and person) I can be, and for this I will always be
grateful.
This dissertation would not have been possible without Dr. Siming Wang. Her support, patience,
kindness, and willingess to teach me was the life force of this project.
Over the years, I have received helpful advice and constructive criticism from my committee
members, Drs. David Boykin and Markus Germann, which made each project the absolute best it
could be.
The work in Chapter 5 would not have been possible without Dr. Ivaylo Ivanov and E. Kathleen
Carter. Their computational insight and enthusiasm revolutionized the way I think about DNA
shape and drug design.
Many thangs to: My Chinese sister, Dr. Shuo Wang, and to Dr. Ananya Paul for their years of
whom I continue to learn; Discussions about graduate life and how to improve it with Drs.
Giovanni Gadda and Donald Hamelberg; Preparation for life as a Ph.D. student comes from Dr.
Binghe Wang; Many wonderful collaboraitons with Dr. Moses Lee of Murdock Trust, Dr. Bruce
Armitage of Carnegie Mellon University, Drs. Stephen Neidle and John Hartley of University
College London, and Drs. Gregory Poon and David Boykin of Georgia State University; And
lastly to Susan Whittington for her focused approach to navigating life.
And finally to my friends, family, and colleagues whom I met along the way because knowing
TABLE OFCONTENTS
ACKNOWLEDGEMENTS ... v
LIST OF TABLES ... xv
LIST OF FIGURES ... xvi
1 INTRODUCTION ... 1
1.1 DNA and the minor groove ... 1
1.2 Classical minor groove binding agents ... 1
1.3 Electrospray ionization mass spectrometry and DNA ... 4
1.3.1 Background ... 4
1.3.2 Small molecule studies by ESI-MS ... 5
1.3.3 Application to other systems ... 6
1.4 Protein complexes with nucleic acids by ESI-MS ... 8
1.5 Purpose of dissertation ... 9
1.6 References ... 9
2 A NOVEL APPROACH USING ELECTROSPRAY IONIZATION MASS SPECTROMETRY TO STUDY COMPETITIVE BINDING OF SMALL MOLECULES WITH MIXED DNA SEQUENCES... 15
2.1 Abstract ... 15
2.2 Key words ... 16
2.4 Introduction... 16
2.5 Results ... 17
2.5.1 Testing the experimental conditions and ESI-MS method with known minor groove binders ... 17
2.5.2 Using DB293 to test monomer versus dimer binding ... 19
2.5.3 DNA and DNA-complexes are stable ... 20
2.5.4 Sensitivity of DNA and DNA-complexes ... 21
2.6 Discussion ... 23
2.7 Conclusion ... 24
2.8 Experimental protocol ... 25
2.8.1 DNA and compounds ... 25
2.8.2 Electrospray ionization mass spectrometry ... 25
2.9 References ... 27
3 RESOLUTION OF MIXED SITE DNA COMPLEXES WITH DIMER-FORMING MINOR GROOVE BINDERS BY USING ELECTROSPRAY IONIZATION MASS SPECTROMETRY: COMPOUND STRUCTURE AND DNA SEQUENCE EFFECTS 28 3.1 Abstract ... 28
3.2 Key words ... 29
3.3 Abbreviations ... 29
3.5 Compound design ... 33
3.6 Results ... 34
3.6.1 Structural effects on selective recognition using analogues of 1... 34
3.6.2 Molecular modeling of the compounds illustrates the effect of structural conformation on minor groove recognition ... 43
3.6.3 DNA sequence and directionality influence selective recognition... 45
3.6.4 Additional evidence for DNA complex formation with 1 and analogues by thermal melting and circular dichroism ... 47
3.7 Discussion ... 50
3.8 Conclusion ... 57
3.9 Experimental procedures ... 57
3.9.1 Materials... 57
3.9.2 Electrospray ionization mass spectrometry ... 59
3.9.3 Thermal melting ... 59
3.9.4 Circular dichroism ... 59
3.9.5 Molecular modeling ... 60
3.10 References ... 60
4 MIXED UP MINOR GROOVE BINDERS: CONVINCING A∙T SPECIFIC COMPOUNDS TO RECOGNIZE A G∙C BASE PAIR ... 64
4.2 Key words ... 65
4.3 Introduction... 65
4.4 Results ... 95
4.4.1 Thermal melting ... 95
4.4.2 Biosensor-surface plasmon resonance ... 97
4.4.3 Competition electrospray ionization mass spectrometry ... 98
4.4.4 Circular dichroism ... 101
4.4.5 DNase I footprinting ... 101
4.4.6 Molecular modeling ... 104
4.5 Discussion ... 104
4.6 Conclusion ... 107
4.7 Materials and methods ... 107
4.7.1 DNA oligonucleotides ... 107
4.7.2 Thermal melting (Tm) ... 108
4.7.3 Biosensor surface plasmon resonance (SPR) ... 108
4.7.4 Mass spectrometry (ESI-MS) ... 110
4.7.5 Circular dichroism spectroscopy (CD) ... 111
4.7.6 DNase I footprinting experiments ... 111
4.7.7 Structural model calculation methods ... 112
5 DNA MICROSTRUCTURE INFLUENCES BINDING OF SMALL
MOLECULES DESIGNED TO TARGET MIXED-SITE SEQUENCES ... 118
5.1 Abstract ... 118
5.2 Key words ... 119
5.3 Abbreviations ... 119
5.4 Introduction... 119
5.5 Results and discussion ... 122
5.5.1 Competition electrospray ionization mass spectrometry identifies new interactions ... 122
5.5.2 Surface plasmon resonance confirms sequence specific behavior identified by ESI-MS ... 97
5.5.3 Molecular dynamics identifies microstructural differences in the experimental DNAs ... 101
5.6 Conclusion ... 118
5.7 Materials and methods ... 118
5.7.1 Compound and dsDNA ... 118
5.7.2 Electrospray ionization mass spectrometry ... 119
5.7.3 Molecular dynamics simulations... 120
5.7.4 Biosensor surface plasmon resonance ... 124
5.7.5 Competition biosensor-surface plasmon resonance ... 125
6 Conclusions... 134
APPENDIX A. MODULATION OF TOPOISOMERASE IIα EXPRESSION AND CHEMOSENSITIVITY THROUGH TARGETED INHIBITION OF NF-γ: DNA BY A DIAMINO p-ANISYL-BENZIMIDAZOLE (Hx) POLYAMIDE ... 137
A.1 Abstract ... 138
A.1.1 Background ... 138
A.1.2 Methods ... 138
A.1.3 Results ... 138
A.1.4 Conclusions ... 139
A.1.5 General significance ... 139
A.2 Key words ... 139
A.3 Introduction... 139
A.4 Methods and materials ... 143
A.4.1 Synthesis of polyamides ... 143
A.4.2 Thermal denaturation studies ... 143
A.4.3 Circular dichroism ... 144
A.4.4 Surface plasmon resonance ... 144
A.4.5 DNase I footprinting ... 146
A.4.6 Cell lines and culture conditions ... 146
A.4.8 Immunofluorescence staining and confocal microscopy ... 147
A.4.9 Quantitative real time PCR ... 147
A.4.10 Immunoblotting ... 148
A.4.11 Cell viability ... 148
A.4.12 Statistical analysis ... 149
A.5 Results ... 149
A.5.1 DNA binding affinity and sequence selectivity of diamino Hx-polyamides 2 & 3 ... 149
A.5.2 Binding of diamino HxI*P and HxIP* on the topoIIα promoter ... 151
A.5.3 Disruption of the NF-γ:ICB2 interaction by diamino Hx-polyamides ... 153
A.5.4 Nuclear uptake of diamino Hx-polyamides ... 153
A.5.5 Biological activity of diamino Hx-polyamides in A549 cells... 158
A.5.6 HxIP*-mediated chemosensitisation to topo II poisons ... 158
A.6 Discussion ... 162
A.7 Conclusion ... 167
A.8 Acknowledgements ... 168
A.9 References ... 168
APPENDIX B. THE SEARCH FOR SELECTIVITY OF RNA G-QUADRUPLEXES BY SYNTHETIC COMPOUNDS ... 173
B.2 Key words ... 174
B.3 Abbreviations ... 174
B.4 Introduction... 174
B.5 Materials and methods ... 176
B.5.1 DNA and compounds ... 176
B.5.2 Electrospray ionization mass spectrometry ... 178
B.5.3 Fluorescence polarization spectroscopy ... 179
B.6 Results and discussion ... 180
B.6.1 Sequence specific investigations of small molecule interaction with ALS-related quadruplexes ... 180
B.6.2 Sequence specific investigations of small molecule interaction with human telomere (HTel21) quadruplexes ... 186
B.7 Conclusions ... 194
LIST OF TABLES
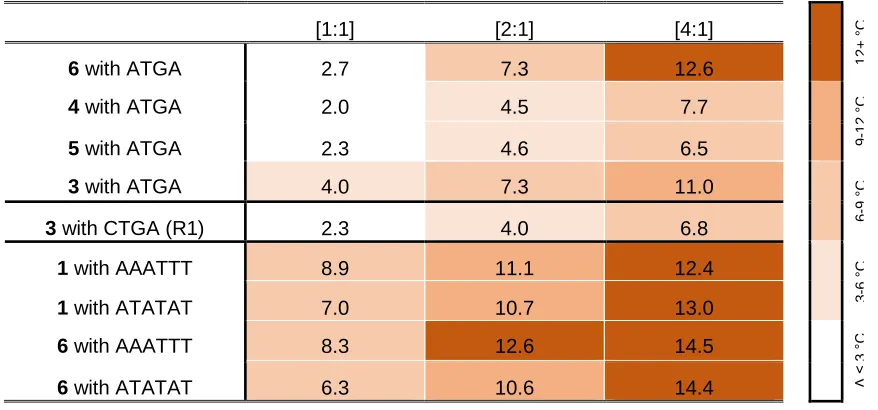
Table 3.1 ΔTm values of dimer-forming compounds with select DNA sequences. ... 48
Table 3.2 ΔTm values of 1 with ATGA and mutant sequences. ... 48
Table 4.1 Thermal melting studies (ΔTm [a], ºC) of the designed heterocyclic amidine
compounds with mixed DNA sequences. ... 96
Table 5.1 Comparison of kinetics-fitted and steady-state equilibrium binding constants (KD
x 10-9 M). ... 99
Table 5.2 Mean (M), standard deviation (SD), and 99.9% confidence interval (CI) of the
propeller twist over 50,000 frames for the 13 base pair sequences. ... 112
Table 5.3 Mean (M), standard deviation (SD), and 99.9% confidence interval (CI) of the
propeller twist over 50000 frames for the 14 base pair sequences. ... 113
LIST OF FIGURES
Figure 1.1 DNA and the minor groove. ... 2
Figure 1.2 Small molecule inhibition of protein-DNA interactions. ... 3
Figure 1.3 Classical minor groove binding compounds. ... 4
Figure 1.4 X-ray crystal structure of DB75 with 5'-AATT-3'. ... 4
Figure 1.5 Cartoon of electrospray ionization of DNA. ... 6
Figure 1.6 Adjustment of DNAs to achieve different molecular weights for ESI-MS. ... 7
Figure 2.1 Spectra of mixed DNA sequences forming complexes with DB75 and Netropsin. ... 18
Figure 2.2 Using DB293 to test monomer versus dimer binding. ... 20
Figure 2.3 Peak comparison of R1, ATATAT, AAATTT, and Net-DNA complexes. ... 22
Figure 2.4 Raw, convoluted data to observe competitive binding of Net with R1 and AAATTT. ... 23
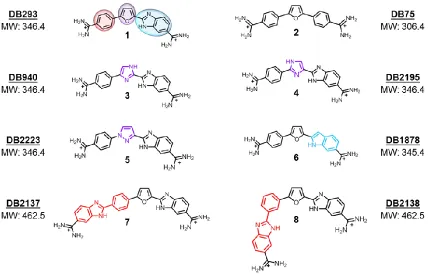
Figure 3.1 Structures of dicationic diamidine minor groove binding compounds used to investigate dimer formation in mixed-sequence sites. ... 31
Figure 3.2 Mixed hairpin DNA sequences used to screen interactions for monomer and dimer-forming complex interactions with multiple sequences. ... 36
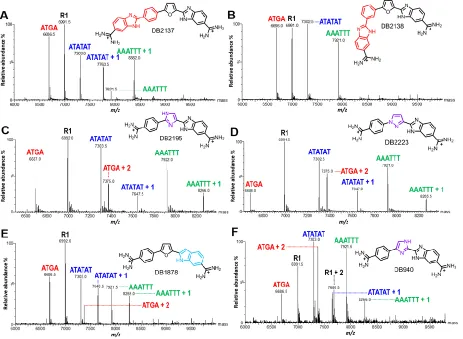
Figure 3.3 Example ESI-MS spectra of compound 1 titrated with multiple DNA sequences. ... 37
Figure 3.4 Spectra of DNA sequences titrated with analogues 3 - 8. ... 39
Figure 3.5 Mixed DNA sequence results with 3. ... 41
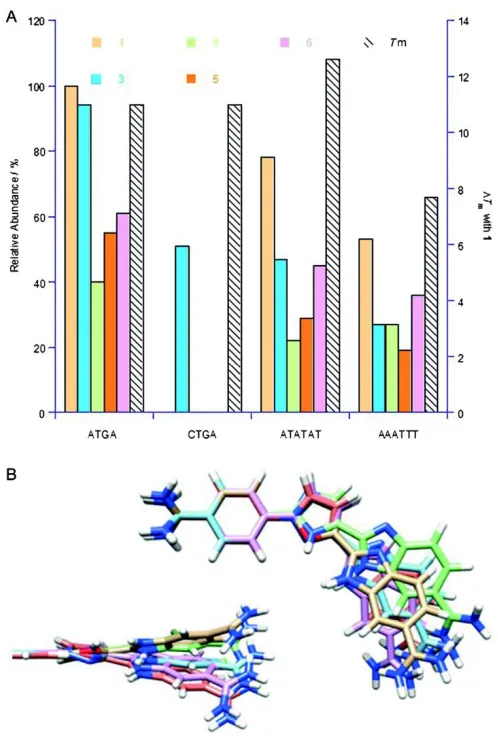
Figure 3.6 Comparison of compound 1 and analogues 3, 4, 5, and 6. ... 43
Figure 3.8 ATGA cognate and sequence variants used to examine the sequence specificity
of 1. ... 46
Figure 3.9 Spectra of ATGA cognate and ATGA mutant sequences with compound 1. ... 46
Figure 3.10 Comparison of relative abundances and thermal melting. ... 49
Figure 3.11 Comparison of ATGA and ATGA-mutant sequence CD spectra. ... 51
Figure 3.12 Spectrum of DNA and 1 run using 2.5 µM concentration of DNA. ... 56
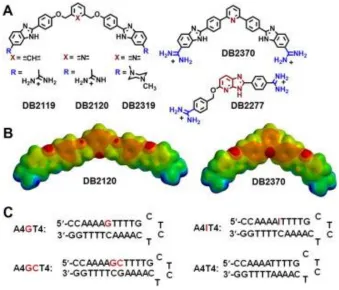
Figure 4.1 Representative minor groove binding compounds and test sequences. ... 94
Figure 4.2 UV melting profiles of DNA with minor groove binding compounds. ... 96
Figure 4.3 Surface plasmon resonance sensorgrams for DB2120. ... 98
Figure 4.4 Competition mass spectrometry. ... 100
Figure 4.5 Circular dichroism titration spectra of DB2120 with A4GT4. ... 101
Figure 4.6 DNase I footprinting densitometry analysis. ... 102
Figure 4.7 DNase I footprinting experiments. ... 103
Figure 4.8 Molecular docking model of DB2120 with the A4GT4 sequence. ... 105
Figure 5.1 Test compound and sequences for ESI-MS. ... 121
Figure 5.2 Representative ESI-MS spectra of DB2277 binding with DNA. ... 94
Figure 5.3 Comparison of deconvoluted peak intensities from titrated DB2277 with DNA.95 Figure 5.4 SPR sensorgram and binding curves of DB2277 and DNA. ... 98
Figure 5.5 2D contour histograms for minor groove widths of unbound DNA. ... 102
Figure 5.6 2D histograms of most probable minor groove widths for unbound DNA. ... 104
Figure 5.7 2D histograms of DNA minor groove depths for unbound DNA. ... 106
Figure 5.8 2D histograms of minor groove width for AAAAGTTTT. ... 107
Figure 5.10 2D histograms of major groove widths for DNA sequences. ... 109
Figure 5.11 2D histograms of major groove depths for DNA sequences. ... 110
Figure 5.12 Most probable propeller twist per base pair. ... 111
Figure 5.13 Average helical base pair step parameters for one and two G·C base pair
sequences. ... 115
Figure 5.14 2D contour histograms of minor groove width for 1:1, DB2277-DNA
complexes. ... 117
Figure 5.15 Cartoon representations of groove widths. ... 122
1 INTRODUCTION
1.1 DNA and the minor groove
The central dogma of molecular biology is the simplest explanation of how genetic
information is passed on. Simply put, DNA is transcribed to RNA which is then translated to
protein. Within this process, however, are many intricacies. DNA – short for deoxyribonucleic
acid – is the carrier of genetic information but is itself a highly complex system. For example,
Figure 1.1 illustrates a canonical B-form DNA double-helix strand. The DNA is composed of two
complementary strands of nucleotides joined together by hydrogen bond interactions. Nucleotide
sequences are read from the O5’ to O3’ direction and read as 5’ to 3’ (Figure 1.1C). Due to the
specific configuration of the helical duplex, two particular formations occur which are referred to
as the major and minor grooves (Figures 1.1B & C). The major groove is often found as having a
deep and wide groove which is where many proteins bind, or interact, with the DNA. On the other
hand, the minor groove is often identified as having a deep and narrow groove. Figure 1.1C shows
two examples of thymine∙adenine (T∙A) and cytosine∙guanine (C∙G) complementary base pairs
and the locality of the major and minor grooves per base pair. For G∙C base pairs, three hydrogen
bond interactions occur. The amino group of C and keto group of G extend into the major groove
while the keto group of C and amino groups of G point into the minor groove. For A∙T base pairs,
only two hydrogen bond interactions are formed. Here, the methyl group of T and keto group of
A protrude into the major groove while a second keto group of T sits in the minor groove.
1.2 Classical minor groove binding agents
The minor groove of DNA has become an increasingly interesting area of focus in the drug
design community. Many DNA-binding proteins target the major groove leaving the minor groove
Figure 1.1 DNA and the minor groove.
(A) Central dogma of molecular biology, (B) dsDNA with major and minor grooves and (C) A∙T and G∙C base pairs.
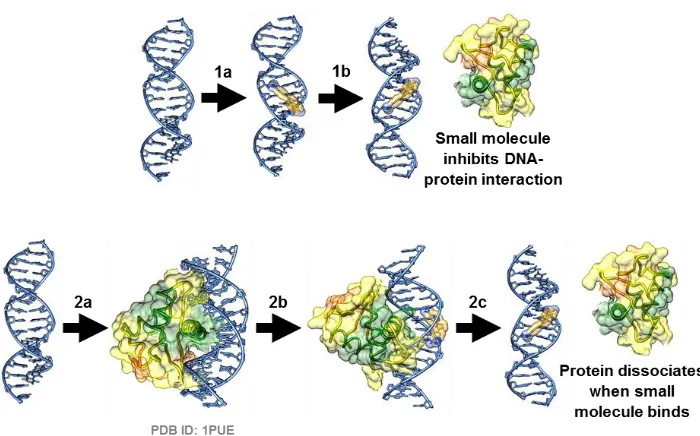
groove and modulate genetic processes. Several cartoon examples are shown in Figure 1.2. The
top example, labeled as 1a and 1b illustrates the uses of a small molecule acting as an inhibitor.
First, the small molecule binds in the minor groove (1a) and in doing so causes some type of
allosteric or conformational change in the DNA shape or structure (1b). A second possible
inhibition pathway follows the same DNA sequence except here, the protein is able to bind first
with the DNA (2a). In this scenario, the protein interacts with the major groove of the DNA leaving
the backside of minor groove accessible to a small molecule. Here, (2b) the small molecule binds
with DNA and causes the protein to dissociate (2c) via allosteric interactions. A third possible
approach, not illustrated in Figure 1.2, also involves the enhancement or upregulation of
DNA-protein interactions through small molecule binding.
A classical minor groove binding compound has several key characteristics and three
examples are shown in Figure 1.3. Both Netropsin and Distamycin are naturally occurring
Figure 1.2 Small molecule inhibition of protein-DNA interactions.
(1a-1b) Direct inhibition of DNA-protein interaction by small molecule binding and (2a-2c) indirect inhibition of DNA-protein interaction through allostery.
David W. Boykin and co-workers at Georgia State University. The shape, length, and charge of a
minor groove binding molecule are critical for binding interactions. As shown with the three
examples below, a crescent shape, end positive charges, and hydrogen bond donor/acceptor groups
are all crucial for high affinity binding with DNA. Positive charges on the compound are also
important as it allows for electrostatic interactions with the negative phosphate backbone of the
DNA which helps stabilize binding. Likewise, hydrogen bond donor and acceptor groups on the
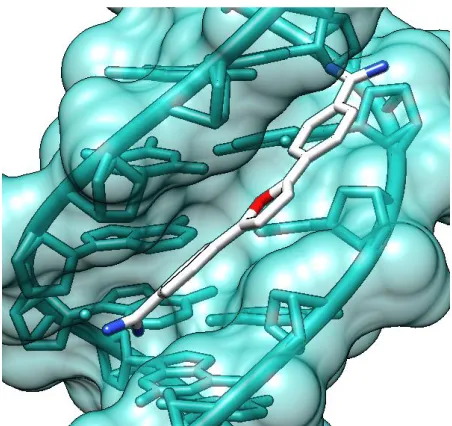
compound with the bases increase binding affinity and specificity. Evidence of minor groove
binding is shown in Figure 1.4 with a crystal structure of DB75 in a 5’-AATT-3’ binding site.[2]
This example clearly demonstrates not only hydrogen bond and electrostatic interactions, but also
a shape complementary to the minor groove. The length of the small molecule is equally important.
For instance, if the compound is too short it may lose specificity; too long or if bulky substituents
are present, it can also reduce specificity through increasing insolubility and/or obstruction into
Figure 1.3 Classical minor groove binding compounds.
Netropsin and Distamycin are naturally occurring polyamide groove binders and DB75 is a synthetic, dicationic diamidine.
Figure 1.4 X-ray crystal structure of DB75 with 5'-AATT-3'.
Binding of DB75 with d(CGCGAATTCGCG)2. PDB ID: 227D.
1.3 Electrospray ionization mass spectrometry and DNA
1.3.1 Background
The continued development of electrospray ionization (ESI) methods and the extensive
improvements in commercial mass spectrometry (MS) instruments over the last two decades have
brought ESI-MS experiments into the forefront of analysis of bio-macromolecules and their
but nucleic acids are attracting increasing attention. Early studies on double-helical DNA involved
establishing conditions for preserving the duplex in the gas phase and evaluating different volatile
solution buffers/salts for optimum ESI-MS conditions.[3] There are numerous reports on duplex
stability [3-5], dissociation to single strands [6-8], effects of ESI conditions [9, 10], solution
composition [11-14] and nucleic acid sequence [7,15]. These key studies and more have provided
a strong foundation for ESI experiments on nucleic acid-small molecule complexes.
1.3.2 Small molecule studies by ESI-MS
The early studies on ESI-MS requirements for stable duplex [3, 16] quickly evolved into important
studies on DNA complexes with metal ions [7, 17], organic compounds [18, 19] and proteins [20,
21]. Studies of organic systems complement extensive solution biophysical studies that have two
important goals: (i) develop a better understanding of the fundamental features of nucleic acid
interactions and (ii) design nucleic acid-targeting agents for biotechnology and therapeutics.
Compounds that bind in the DNA minor groove have a variety of structural features that affect
their affinity, stoichiometry and sequence specificity. All of these features, as well as cooperativity
for compounds with a stoichiometry greater than one, can be investigated by ESI-MS methods.
The earliest reports of DNA complexes by ESI-MS were with the polyamide minor groove binder,
Distamycin A.[16, 22] The complex was intact in the gas phase and gave a 1:1 binding
stoichiometry for a 12 base pair duplex that had an AAATTT base sequence binding site at low
ratios of Distamycin to DNA complex. As the ratio of Distamycin to duplex was increased, a 2:1
bound species was observed and these results are in agreement with solution experimental
findings.[23-25] The excellent agreement between species present and their ratio dependencies
was a significant example that nucleic acid complex stoichiometry, cooperativity and relative
Figure 1.5 Cartoon of electrospray ionization of DNA.
Droplets of DNA in solution are ejected from a capillary at high voltage towards a counter electrode. The electric potential causes the droplets to disperse into smaller particles until the solvent evaporates. The particles will then be carried toward a mass analyzer where they will be separated by a mass-over-charge ratio (m/z).
The successful, initial studies of small molecule-DNA complexes moved into ESI-MS
experiments with a well-known variety of agents and a wide variety of minor groove binders of
quite different structure.[26, 27] All of the results with minor groove binders gave excellent
agreement with the solution studies. It is now quite clear that ESI-MS experiments, when properly
conducted, will provide complementary and very useful results for analysis of DNA-small
molecule complexes. The method is quite versatile and experiments can be rapidly conducted so
that it is an attractive addition to other powerful, biophysical approaches for DNA complex
analysis. The ability to quickly analyze non-covalent complexes, with good sensitivity and low
sample consumption, as well as the variety of information provided, makes ESI-MS a very
valuable tool.
1.3.3 Application to other systems
ESI-MS is often used for characterizing small, organic molecules but has become a
powerful tool for large biomolecular systems. For small molecule-DNA investigations, excellent
consistency using ESI-MS and other biophysical methods has been found. Competition ESI-MS
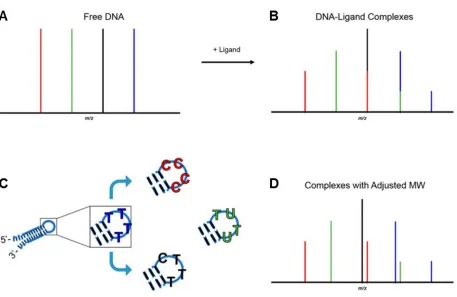
Figure 1.6 Adjustment of DNAs to achieve different molecular weights for ESI-MS.
Target base pair sites in the stem of the DNA are preserved. (A) DNA with unadjusted molecular weights; (B) complex and unbound DNA peaks are not distinguishable upon addition of ligand due to overlapping peaks for free DNA and DNA-ligand complexes (e.g., black and red); (C) modifications in the hairpin loop by incorporation of various bases allows the DNA stem to be preserved while creating distinguishable molecular weights; (D) complexes and free DNA become easily identifiable. T = thymidine, C = cytidine, U = deoxyuridine.
simultaneously. Analyzing interactions between a single DNA and a single ligand is not efficient
for screening a library of compounds. With a competition method, a large number of interactions
can be studied in much less time than with the conventional approach of one DNA and one ligand.
Valuable information is gathered quickly with regards to preferential binding of a ligand to DNA.
Although several of the studies described later will focus primarily on the binding of small
molecule ligands to DNA, this technique is not limited to these specific interactions and can be
appled to other biomolecules of interest, including proteins [4, 20, 28-31], carbohydrates [32, 33]
1.4 Protein complexes with nucleic acids by ESI-MS
The ETS family of transcription factors (TF) comprises a major class of transcriptional
regulators across many species, including humans.[48] Humans also express various oncogenic
mutations of the ETS TFs that are associated, for example, with bone, breast, and prostate
tumors.[49, 50] All ETS TFs have similar DNA binding domains that are highly conserved in
structure with a 5’-GGAA/T-3’ consensus central binding site.[51] Genomic analyses have
identified the ETS member PU.1 as a pioneering transcription factor [52] that can overcome
chromatin packaging to bind chromosomal DNA. Because of the special properties of PU.1, it is
important to understand how DNA recognition by PU.1 is differentiated from other ETS proteins.
There is, thus, an essential need for a broad range of methods and studies, including ESI-MS, to
address the physical mechanisms of sequence recognition by the PU.1 TF.
Targeting TF-DNA complexes, either for inhibition or enhancement, is very attractive for
the treatment of a number of different diseases. This could be done by targeting the TF or the DNA
binding domain. Unfortunately, it has proved very difficult to target TFs and they are frequently
referred to as “undruggable”.[53, 54] An alternative is to target the DNA binding domain of the
TF with designed small molecules and this approach is gaining increasing attention. ESI-MS has
developed into a very attractive method to evaluate both small molecule binding to specific DNA
sequences as well as for their effects on TF-DNA complexes. The wealth of important obtainable
information illustrates the power of ESI-MS in both the characterization of TF-DNA complexes
and in the discovery and development of TF inhibitors. Although ESI-MS studies of protein-DNA
complexes are relatively rare, a number of studies have appeared in recent years and it is likely
1.5 Purpose of dissertation
Much of the work described in this dissertation focuses on extending the minor groove
recognition repertoire through sequences with additional G∙C bps and distinguishability among
variable A∙T bp regions. With several minor groove binder and DNA interaction model systems,
a novel screening method using ESI-MS was developed to identify new DNA-small molecule
interactions. Beginning with well-characterized minor groove binders with known DNAs, ESI-MS
conditions were varied to find optimal conditions for detecting these systems. Once optimal
conditions were chosen, sequences were strategically designed to not only interact with minor
groove binding compounds, but also to be detectable by ESI-MS (details describing the design will
be discussed in the the following chapter). This ESI-MS screening method was then applied to the
discovery of new target binding sites for newly synthesized compounds and/or in expanding of
target binding sites for existing compounds. A combination of other biophysical techniques were
used to validate and/or complement results obtained by ESI-MS including thermal melting (Tm),
circular dichroism (CD), molecular dynamics (MD), and surface plasmon resonance (SPR). Our
ESI-MS method has been applied to the study of DNA-protein complexes, RNA-small molecule
interactions, quadruplex-DNA complexes and DNA-aminoglycoside interactions; however, only
a portion of our findings will be discussed in the remaining chapters.
1.6References
1. Zhao M, Ratmeyer L, Peloquin RG, Yao S, Kumar A, Spychala J, Boykin DW, Wilson W. D. Small changes in cationic substituents of diphenylfuran derivatives have major effects on the binding affinity and the binding mode with RNA helical duplexes. Bioorg. Med. Chem. 1995, 3: 785-794.
3. Lightwahl KJ, Springer DL, Winger BE, Edmonds CG, Camp DG, Thrall BD, Smith RD. Observation of a small oligonucleotide duplex by electrospray ionization mass-spectrometry. J. Am. Chem. Soc. 1993, 115: 803-804.
4. Gabelica V, Vreuls C, Filee P, Duval V, Joris B, De Pauw E. Advantages and drawbacks of nanospray for studying noncovalent protein-DNA complexes by mass spectrometry. Rapid Commun. Mass Spectrom. 2002, 16: 1723-1728.
5. Gidden J, Ferzoco A, Baker ES, Bowers MT. Duplex formation and the onset of helicity in poly d(CG)(n) oligonucleotides in a solvent-free environment. J. Am. Chem. Soc. 2004, 126: 15132-15140.
6. Madsen JA, Brodbelt JS. Asymmetric charge partitioning upon dissociation of DNA duplexes. J. Am. Soc. Mass Spectr. 2010, 21: 1144-1150.
7. Wan KX, Gross ML, Shibue T. Gas-phase stability of double-stranded oligodeoxynucleotides and their noncovalent complexes with DNA-binding drugs as revealed by collisional activation in an ion trap. J. Am. Soc. Mass Spectr. 2000, 11: 450-457.
8. Barylyuk K, Gulbakan B, Xie XS, Zenobi R. DNA oligonucleotides: A model system with tunable binding strength to study monomer-dimer equilibria with electrospray ionization-mass spectrometry. Anal. Chem. 2013, 85: 11902-11912.
9. Marchand A, Ferreira R, Tateishi-Karimata H, Miyoshi D, Sugimoto N, Gabelica V. Sequence and solvent effects on telomeric DNA bimolecular G-quadruplex folding kinetics. J. Phys. Chem. B2013, 117: 12391-12401.
10. Ferreira R, Marchand A, Gabelica V. Mass spectrometry and ion mobility spectrometry of G-quadruplexes. A study of solvent effects on dimer formation and structural transitions in
the telomeric DNA sequence d(TAGGGTTAGGGT). Methods2012, 57: 56-63.
11. Bayer E, Bauer T, Schmeer K, Bleicher K, Maier M, Gaus HJ. Analysis of double-stranded oligonucleotides by electrospray mass spectrometry. Anal. Chem. 1994, 66: 3858-3863.
12. Loo JA. Studying noncovalent protein complexes by electrospray ionization mass spectrometry. Mass Spectrom. Rev. 1997, 16: 1-23.
13. Hofstadler SA, Griffey RH. Analysis of noncovalent complexes of DNA and RNA by mass spectrometry. Chem. Rev. 2001, 101: 377-390.
15. Ni JS, Chan K. Sequence verification of oligonucleotides by electrospray quadrupole time-of flight mass spectrometry. Rapid Commun. Mass Spectrom. 2001, 15: 1600-1608.
16. Gale DC, Smith RD. Characterization of noncovalent complexes formed between minor groove binding molecules and duplex DNA by electrospray ionization mass spectrometry.
J. Am. Soc. Mass Spectr. 1995, 6: 1154-1164.
17. Chiang CK, Lin YW, Hu CC, Chang HT. Using electrospray ionization mass spectrometry to explore the interactions among polythymine oligonucleotides, ethidium bromide, and mercury ions. J. Am. Soc. Mass Spectr. 2009, 20: 1834-1840.
18. Talib J, Green C, Davis KJ, Urathamakul T, Beck JL, Aldrich-Wright JR, Ralph SF. A comparison of the binding of metal complexes to duplex and quadruplex DNA. Dalton T. 2008, 8: 1018-1026.
19. Wu QY, Cheng XH, Hofstadler SA, Smith RD. Specific metal-oligonucleotide binding studied by high resolution tandem mass spectrometry. J. Mass Spectrom. 1996, 31: 669-675.
20. Potier N, Donald LJ, Chernushevich I, Ayed A, Ens W, Arrowsmith CH, Standing KG, Duckworth HW. Study of a noncovalent trp repressor: DNA operator complex by electrospray ionization time-of-flight mass spectrometry. Protein Sci. 1998, 7: 1388-1395.
21. Urathamakul T, Beck JL, Sheil MM, Aldrich-Wright JR, Ralph SF. A mass spectrometric investigation of non-covalent interactions between ruthenium complexes and DNA. Dalton T.2004, 17: 2683-2690.
22. Gale DC, Goodlett DR, Lightwahl KJ, Smith RD. Observation of duplex DNA-drug noncovalent complexes by electrospray-ionization mass-spectrometry. J. Am. Chem. Soc. 1994, 116: 6027-6028.
23. Pelton JG, Wemmer DE. Structural modeling of the distamycin A-d(CGCGAATTCGCG)2
complex using 2D NMR and molecular mechanics. Biochemistry1988, 27: 8088-8096.
24. Pelton JG, Wemmer DE. Structural characterization of a 2:1 distamycin
A.d(CGCAAATTGGC) complex by two-dimensional NMR. P. Natl. Acad. Sci. USA1989,
86: 5723-5727.
25. Pelton, JG, Wemmer, DE. Structure and dynamics of distamycin a with
d(CGCAAATTGGC):D(GCCAATTTGCG) at low drug:DNA ratios. J. Biomol. Struct.
Dyn. 1990, 8: 81-97.
27. Gupta R, Beck JL, Ralph SF, Sheil MM, Aldrich-Wright JR. Comparison of the binding stoichiometries of positively charged DNA-binding drugs using positive and negative ion electrospray ionization mass spectrometry. J. Am. Soc. Mass Spectr. 2004, 15: 1382-1391.
28. Wortmann A, Jecklin MC, Touboul D, Badertscher M, Zenobi R. Binding constant determination of high-affinity protein-ligand complexes by electrospray ionization mass spectrometry and ligand competition. J. Mass Spectrom. 2008, 43: 600-608.
29. Cheng XH, Chen RD, Bruce JE, Schwartz BL, Anderson GA, Hofstadler SA, Gale DC, Smith RD, Gao JM, Sigal GB, Mammen M, Whitesides GM. Using electrospray-ionization FTICR mass-spectrometry to study competitive-binding of inhibitors to carbonic-anhydrase. J. Am. Chem. Soc.1995, 117: 8859-8860.
30. Casini A, Gabbiani C, Michelucci E, Pieraccini G, Moneti G, Dyson PJ, Messori L. Exploring metallodrug-protein interactions by mass spectrometry: Comparisons between platinum coordination complexes and an organometallic ruthenium compound. J. Biol. Inorg. Chem. 2009, 14: 761-770.
31. Krishnaswamy SR, Williams ER, Kirsch JF. Free energies of protein-protein association determined by electrospray ionization mass spectrometry correlate accurately with values obtained by solution methods. Protein Sci. 2006, 15: 1465-1475.
32. Jorgensen TJD, Roepstorff P, Heck AJR. Direct determination of solution binding constants for noncovalent complexes between bacterial cell wall peptide analogues and vancomycin group antibiotics by electrospray ionization mass spectrometry. Anal. Chem. 1998, 70: 4427-4432.
33. Jorgensen TJD, Staroske T, Roepstorff P, Williams DH, Heck AJR. Subtle differences in molecular recognition between modified glycopeptide antibiotics and bacterial receptor peptides identified by electrospray ionization mass spectrometry. J. Chem. Soc., Perkin Trans. 21999, 9: 1859-1863.
34. Birrento ML, Bryan TM, Samosorn S, Beck JL. ESI-MS investigation of an equilibrium
between a bimolecular quadruplex DNA and a duplex DNA/RNA hybrid. J. Am. Soc. Mass
Spectr. 2015, 26: 1165-1173.
35. Malgowska M, Gudanis D, Kierzek R, Wyszko E, Gabelica V, Gdaniec Z. Distinctive structural motifs of RNA G-quadruplexes composed of AGG, CGG and UGG trinucleotide repeats. Nucleic Acids Res. 2014, 42: 10196-10207.
37. Stephenson W, Asare-Okai PN, Chen AA, Keller S, Santiago R, Tenenbaum SA, Garcia AE, Fabris D, Li PT. The essential role of stacking adenines in a two-base-pair RNA kissing complex. J. Am. Chem. Soc. 2013, 135: 5602-5611.
38. Tan W, Yuan G. Electrospray ionization mass spectrometric exploration of the high-affinity binding of three natural alkaloids with the mRNA G-quadruplex in the BCL2 5'-untranslated region. Rapid Commun. Mass Spectrom. 2013, 27: 560-564.
39. Cui X, Lin S, Zhou J, Yuan G. Investigation of non-covalent interaction of natural flexible cyclic molecules with telomeric RNA G-quadruplexes by electrospray ionization mass spectrometry. Rapid Commun. Mass Spectrom. 2012, 26: 1803-1809.
40. Asare-Okai PN, Chow CS. A modified fluorescent intercalator displacement assay for RNA ligand discovery. Anal. Biochem. 2011, 408: 269-276.
41. Collie GW, Parkinson GN, Neidle S, Rosu F, De Pauw E, Gabelica V. Electrospray mass spectrometry of telomeric RNA (TERRA) reveals the formation of stable multimeric G-quadruplex structures. J. Am. Chem. Soc. 2010, 132: 9328-9334.
42. Akashi S, Watanabe M, Heddle JG, Unzai S, Park SY, Tame JR. RNA and protein complexes of TRP RNA-binding attenuation protein characterized by mass spectrometry.
Anal. Chem. 2009, 81: 2218-2226.
43. Kieltyka JW, Chow CS. Probing RNA hairpins with cobalt(III)hexammine and electrospray ionization mass spectrometry. J. Am. Soc. Mass Spectr. 2006, 17: 1376-1382.
44. Sannes-Lowery KA, Griffey RH, Hofstadler SA. Measuring dissociation constants of RNA and aminoglycoside antibiotics by electrospray ionization mass spectrometry. Anal. Biochem. 2000, 280: 264-271.
45. Amato J, Oliviero G, De Pauw E, Gabelica V. Hybridization of short complementary PNAs to G-quadruplex forming oligonucleotides: An electrospray mass spectrometry study.
Biopolymers2009, 91: 244-255.
46. Paul A, Sengupta P, Krishnan Y, Ladame S. Combining G-quadruplex targeting motifs on a single peptide nucleic acid scaffold: A hybrid (3+1) PNA-DNA bimolecular quadruplex.
Chemistry2008, 14: 8682-8689.
47. Datta B, Bier ME, Roy S, Armitage BA. Quadruplex formation by a guanine-rich PNA oligomer. J. Am. Chem. Soc. 2005, 127: 4199-4207.
48. Degnan BM, Degnan SM, Naganuma T, Morse DE. The Ets multigene family is conserved throughout the metazoa. Nucleic Acids Res. 1993, 21: 3479-3484.
49. Arvand A, Denny CT. Biology of EWS/ETS fusions in Ewing's family tumors. Oncogene
50. Clark JP, Cooper CS. Ets gene fusions in prostate cancer. Nat. Rev. Urol. 2009, 6: 429-439.
51. Wei GH, Badis G. Berger MF, Kivioja T, Palin K, Enge M, Bonke M, Jolma A, Varjosalo M, Gehrke AR, Yan J, Talukder S, Turunen M, Taipale M, Stunnenberg HG, Ukkonen E, Hughes TR, Bulyk ML, Taipale J. Genome-wide analysis of Ets-family DNA-binding in vitro and in vivo. EMBO J. 2010, 29: 2147-2160.
52. Zaret KS, Carroll J S. Pioneer transcription factors: Establishing competence for gene expression. Genes Dev. 2011, 25: 2227-2241.
53. Darnell JE Jr. Transcription factors as targets for cancer therapy. Nat. Rev. Cancer 2002, 2: 740-749.
2 A NOVEL APPROACH USING ELECTROSPRAY IONIZATION MASS
SPECTROMETRY TO STUDY COMPETITIVE BINDING OF SMALL
MOLECULES WITH MIXED DNA SEQUENCES
Sarah Laughlin, Siming Wang, Arvind Kumar, David W. Boykin, W. David Wilson.
Laughlin S, et al. Anal. Bioanal. Chem.2014, 406 (25): 6441-6445.
Copyright © 2014 Analytical & Bioanalytical Chemistry
My contribution to this chapter was sample preparation, spectral analyses, and writing.
2.1 Abstract
Minor groove binding compounds have been shown to induce changes in global DNA
conformation, allosterically inhibiting DNA-protein interactions necessary for transcriptional
processes. Many minor groove binders are specific for A·T base pairs but have little preference
over alternating A/T or A-tract sequences. Few compounds, other than polyamides, show
selectivity for mixed sequences with A·T and G·C base pairs. Electrospray ionization mass
groove recognition of different DNA sequences with a library of minor groove binders. A goal in
our current research is to develop new compounds that recognize mixed sequences of DNA. In an
effort to optimize screening for compounds that target mixed A·T and G·C base pair sequences of
DNA, ESI-MS was used to study the competitive binding of compounds with a mixed set of DNA
sequences. The method identified preferred binding sites, relative affinities, and
concentration-dependent binding stoichiometry for the minor groove binding compounds Netropsin and DB75
with A·T-rich sequences, and DB293 with ATGA and AT sites.
2.2 Key words
Electrospray ionization mass spectrometry; Minor groove binders; Minor groove
recognition; Mixed DNA sequences, Selectivity
2.3 Abbreviations
Base pairs (bps); Deoxyribonucleic acid (DNA); Dissociation equilibrium constant (KD);
Electrospray ionization mass spectrometry (ESI-MS); Mass-over-charge ratio (m/z); Minor groove
(MG); Netropsin (Net); Surface plasmon resonance (SPR)
2.4 Introduction
Non-polyamide minor groove (MG) binders target A·T-rich sites with variable distinction
among A·T sequences.[1] Netropsin (Net) and DB75 (Figure 2.1) are MG binding compounds
which bind with 1:1 stoichiometry to A·T-rich sites.[2, 3] Polyamides can selectively target G·C
base pairs (bps) in a DNA sequence, but few non-polyamide MG binders target mixed sequence
sites. DB293 (Figure 2.2) is the first dicationic diamidine to strongly recognize a sequence with
mixed bp.[4] It binds in the MG of ATGA sequences as an antiparallel stacked dimer with positive
cooperativity. Using the known interactions of Net, DB75, and DB293 as reference points, we are
spectrometry (ESI-MS). Because of its improved versatility, ESI-MS has widely increased its
utility for studying biomacromolecules and is ideal for characterizing systems with non-covalent
interactions. We report a method that provides rapid screening of MG compound libraries for
interactions, which can be easily characterized based on differences in structure and DNA
sequence. To the best of our knowledge, this is the first example using ESI-MS to screen the
competitive interaction of ligands with multiple DNA sequences in a single sample. Using this
approach, we can begin to define a basis for specificity of drug binding at a target sequence. With
enough DNAs, this method can screen target sites and complexes of interest. Information including
relative binding affinity, stoichiometry, and binding cooperativity can be determined.
2.5 Results
2.5.1 Testing the experimental conditions and ESI-MS method with known minor groove binders
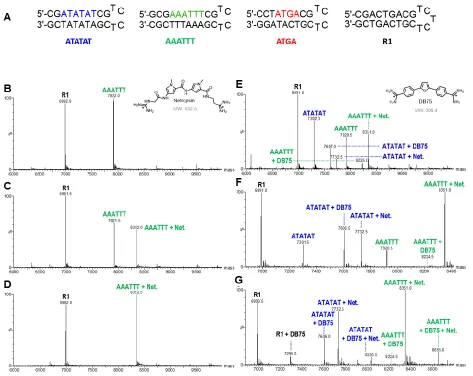
Net is a well-understood MG binder which forms high-affinity 1:1 complexes with the
A·T-rich sequences selected for our experiments.[2] Figure 2.1B is a deconvoluted spectrum of
AAATTT and R1 sequences at a molar ratio of [0:1] Net:DNA, and both DNA sequences have
single peaks with similar intensity and minimal background noise. Adding Net to form a molar
ratio of [1:1] Net to AAATTT led to a large decrease in peak intensity for the oligonucleotide
compared to R1 and the appearance of a peak corresponding to a 1:1 Net:DNA complex, which
indicates strong binding between Net and AAATTT. A [2:1] sample showed an additional decrease
in parent peak intensity, indicating that Net had completely saturated the binding site of the
AAATTT. Even at a [2:1] ratio, no 2:1 species was observed. This indicated that binding is 1:1, as
expected. Similar to Net, DB75 is also a well-characterized MG binder that binds with high affinity
Figure 2.1 Spectra of mixed DNA sequences forming complexes with DB75 and Netropsin. (A) DNA sequences used to simultaneously test binding of multiple sequences: ATATAT, AAATTT, ATGA, and R1. Concentration of DNA is 5 μM. (B-D) Spectra of DNA and Net binding with increasing ligand concentrations. Ligand-to-DNA ratios are [0:1], [1:1], and [2:1], respectively. (E-G) Spectra show the competitive binding of Net and DB75 with multiple DNA sequences. Respective ratios are shown at [0.5:1], [1:1], and [2:1]. Free DNA is indicated by a sequence name above the corresponding peak (AAATTT, m/z 7,921.5) and ligand-DNA complex as name + n (AAATTT + Net, m/z 8,352.5).
ATATAT, AAATTT, and R1 to test competitive binding. Equal concentrations of DB75 and Net
were added at a mole to mole ratio of [0.5:1] for a single ligand to DNA. At this ratio, the tallest
peak corresponded to 1:1 AAATTT with Net. Smaller peaks show ATATAT + Net and ATATAT
+ DB75 complexes, but no binding is detected for AAATTT + DB75 (Figure 2.1E). An increase
+ Net was the most abundant. Peak intensities increased to roughly 50 % for ATATAT + DB75
and ATATAT + Net, while a new peak for AAATTT + DB75 was detected (Figure 2.1F). Upon
further increasing ligand concentrations to [2:1], a new series of peaks appeared and free ATATAT
or AAATTT decreased (Figure 2.1G). The tallest peak became AAATTT + Net, and the intensity
of ATATAT + Net surpassed ATATAT + DB75. The peaks corresponding to the parent
nucleotides disappeared, indicating complete complexation. This increase in intensity for the
ATATAT + Net complex likely occurred once all free AAATTT was consumed due to the high
affinity of Net for AAATTT. Residual Net could then saturate the ATATAT binding site. The high
binding affinity of Net for AT sequences is apparent, as is the competitive binding of Net over
DB75 for AT sequences. Surprisingly, as the concentration was increased, new peaks were
detected for DB75 + R1. DB75, known to bind strongly in the MG of AT sequences, has also been
reported to intercalate weakly with G·C sites, which is likely the case for R1 + DB75 at increased
concentrations. The intercalated binding of DB75 occurs because the stronger binding Net
saturates the A·T-rich MG site. As the free concentration of DB75 reaches a high level,
intercalation at the available G·C sites then ensues. All of the results with Net and DB75 are in
good agreement with published results but also provide new insight into the interactions of these
compounds with different DNA sequences.
2.5.2 Using DB293 to test monomer versus dimer binding
Previous work with DB293 indicates it forms a cooperatively stacked dimer with ATGA
and a 1:1 complex with AATT. Thus, the binding of DB293 provides a more complex ESI-MS
test system.[4] Solutions of DB293 were mixed with R1, AAATTT, and ATATAT, as well as
ATGA (Figure 2.2). Initially, only monomer complexes with ATATAT and AAATTT are formed
Figure 2.2 Using DB293 to test monomer versus dimer binding.
Spectra of mixed DNA sequences titrated with DB293. Unbound DNA is indicated by a sequence name above the corresponding peak (ATGA, m/z 6,686.5) and ligand-DNA complex as name+n (ATGA+2, m/z 7,375.0). DNA concentration is 5 μM for each sequence. Molar ratios of [0:1], [1:1], [2:1], and [4:1] correspond to (A-D), respectively.
both A·T sequences and DB293 is again observed. For ATGA and DB293, no 1:1 complex is
detected but a 2:1 species is observed. The lack of a 1:1 complex between DB293 and ATGA is
indicative of strong cooperative dimer binding and is in agreement with biosensor-SPR results.[4]
When the concentration of DB293 was doubled to a [4:1] ratio, the pattern remained the same. R1
showed no interaction with DB293 at any of the ligand concentrations. The peak at 7,375.5 m/z
not only indicates a 2:1 complex for DB293 with ATGA, but having the highest intensity suggests
a greater affinity for the cooperative dimer with ATGA over monomer formation with ATATAT
and AAATTT sequences.
2.5.3 DNA and DNA-complexes are stable
We adjusted each parameter individually to monitor for changes in ligand binding and
intensity which indicates the ESI-MS conditions used in this work are appropriate. We have found
that relatively weak complexes (i.e.KD > 0.1 mM), such as external electrostatic complexes, are
easily dissociated during injection of the sample and into the gas phase, which filters the results
and emphasizes more specific and relative strong complexes over nonspecific binding. The raw,
deconvoluted spectra show multiple charged species (Figure 2.4) for free DNA and
DNA-complexes with the most abundant charge states having net charges of -4, -5, and -6. For these
systems, the peaks observed correspond to DNA with partially neutralized backbones.
Neutralization occurs during the electrospray process through interaction of the ammonium ions
with the phosphate backbone. The degree of neutralization and net charge depends on ammonium
acetate concentration, size of the DNA, and the conditions used which were chosen based on earlier
reports.[5, 6]
2.5.4 Sensitivity of DNA and DNA-complexes
Differences in the complex conformation following ionization was an initial concern,
meaning the complex detected in the gas phase may not reflect the complex found in solution. A
conformational change could, therefore, have an effect on the response and relative binding
affinity. For example, after the first DB293 compound binds with ATGA, it is believed that the
MG widens to accommodate the second, more favorable molecule. This is a conformational
change in the microstructure of the ATGA minor groove and yet, response factors for systems that
undergo microstructural changes are similar.[7, 8] This assumption for similar response allows an
easy comparison of the peaks. The relative affinities of free DNA and DNA-complexes are, thus,
approximated by monitoring changes in relative intensities before and after addition of the
compound. Additionally, molecular dynamics simulations of DNA-MG binder complexes in
Figure 2.3 Peak comparison of R1, ATATAT, AAATTT, and Net-DNA complexes.
DNA sequences and Net concentrations each 5 µM. Top row (A) capillary voltage, (B) collision energy, and (C) cone voltage conditions. Bottom row (D) desolvation temperature, (E) extraction voltage, and (F) source temperature conditions. Peaks in order of least to greatest m/z: R1, ATATAT, ATATAT + Net, AAATTT, and AAATTT + Net.
The simulations suggested little conformational difference between solution and gaseous
environments as long as the DNA charge is low in the gas phase (bound ions). This provides
additional support that the relative affinities of the DNA-complexes observed using ESI-MS are
comparable to those found by other methods. The actual process of solution to gas phase can pose
some difficulty for solutions requiring an aqueous environment. A more volatile solvent, such as
methanol, is often times added to samples to increase the transition, and as a result the signal/noise
ratio (S/N). With our conditions, addition of MeOH (up to 20% v/v) led to some reduction in the
amount of complex observed with a concomitant increase in free DNA. The addition of MeOH
did, however, result in some general improvement in S/N. Due to the lower boiling point of
Figure 2.4 Raw, convoluted data to observe competitive binding of Net with R1 and AAATTT.
Concentrations of AAATTT, R1, and Net are 5 μM each. Titration ratio is expressed as [1:1] where molar ratio is Net to AAATTT. The most abundant species are the -4, -5, and -6 charge states.
methanol raised concerns regarding the appropriate amount to add and possible effects the solvent
could have on the DNA structure. The binding mechanism for MG binders in contingent on the
shape and width of the MG and the selectivity of these compounds is also dependent on solvent
effects. Based on our findings, solutions containing variable methanol concentrations did not show
significant conformational effects based on the amount of complex observed.
2.6 Discussion
Using a mixed set of DNA sequences, we can quickly and accurately evaluate relative
affinities, stoichiometry, and cooperativity. These tests show that ESI-MS not only detects binding
using control DNAs and MG binders, but also enables competition among ligands and DNAs to
be observed. ESI-MS can screen multiple sequences simultaneously, and alternative binding
modes for MG binding compounds can be detected. Our intention for developing this method is to
complement information obtained by other techniques such as footprinting or next-generation
assays. The goal is to determine differences in binding for compounds with a closely related set of
sequences having systematic variations. The DNA has a known binding site, in addition to
compound selectivity. The strongest binding ligands will interact with available binding sites first,
which makes this a true competitive assay.
Analyzing interactions between ligand and a single DNA is not efficient. One can study
any number of interactions in the same time it takes to study one. The key is in ligands and
sequences which form complexes with distinguishable molecular weights. By using sequences
with like compositions, the sensitivities of DNA and DNA complexes are also similar; thus,
limitations such as response factors are overlooked.[6, 8] This feature allows direct comparison of
unbound DNA and complexes to determine the relative binding affinity. It further demonstrates
that our method to investigate the competitive and selective binding between multiple, mixed
DNA-ligand interactions in a single sample not only is more efficient but also provides important
new information with DNA interactions.
2.7 Conclusion
We have developed a novel approach to observe competitive binding and to screen for
DNA-ligand interactions. To the best of our knowledge, this is the first example using ESI-MS to
simultaneously examine ligand binding with multiple DNA sequences. Our findings show
excellent consistency between ESI-MS and other biophysical methods. This technique has many
favorable features: it is rapid and convenient and requires small amounts of sample. It allows direct
comparison of relative binding affinities in addition to stoichiometry and cooperativity. Using this
innovative method, one could theoretically screen dozens of sequences and obtain a large amount
of information from a single sample, reducing reagents used and time spent cleaning between
sample runs. More importantly, this method is not limited to DNA and small molecules and can
2.8 Experimental protocol
2.8.1 DNA and compounds
Ligand stock solutions were prepared in doubly distilled water at a concentration of 1 mM.
DNA sequences were purchased from Integrated DNA Technologies (IDT, Coralville, IA). Based
on the predicted amount of DNA provided by IDT, DNAs were dissolved to concentrations near
1 mM in doubly distilled water. All sequences were converted to ammonium acetate salts by three
times dialysis in 150 mM NH4OAc vacuum-filtered buffer (0.22 µM Millipore filter, pH 6.7) using
a 1000 Da cut-off membrane (Spectrum Laboratories, Rancho Dominguez, CA). Following
dialysis, concentrations of DNA were spectroscopically determined at 260 nm with extinction
coefficients calculated using the nearest-neighbor method.[7] Sequences were denatured at 95 °C
and immediately quenched on ice to initiate hairpin formation. Ligand and dialyzed DNA solutions
were stored at 4 °C. Titration experiments were performed with a mixed set of DNA in a solution
with a total volume of 100 μL. DNAs were diluted to 5 μM each in 150 mM NH4OAc (pH 6.7)
and stored at 4 °C. Titration ratios are expressed as compound-to-single-DNA, instead of
compound-to-total-DNA concentration. For example, 20 μM DB293 to 5 μM ATGA is expressed
as a [4:1] ratio. R1 was used as a reference because it contained no known target sequence.
2.8.2 Electrospray ionization mass spectrometry
ESI-MS experiments were performed using a Waters (Milford, MA) Micromass Q-TOF in
negative ion mode using the MassLynx 4.1 software. Conditions were chosen based on published
methods [5] and optimized as shown in Figure 2.3. Capillary voltage, 2200 V; sample cone
voltage, 30 V; extraction cone voltage, 3 V; source block temperature, 70 °C; desolvation
is often added to facilitate solution-to-gas phase transition, however, the addition of a solvent was
not necessary using our conditions.
The actual process of solution to gas phase can pose some difficulty for solutions requiring
an aqueous environment. A more volatile solvent, such as methanol, is often times added to
samples to increase the transition, and as a result the signal/noise ratio (S/N). With our conditions,
addition of MeOH (up to 20% v/v) led to some reduction in the amount of complex observed with
a concamitant increase in free DNA. The addition of MeOH did, however, result in some general
improvement in S/N. Due to the lower boiling point of methanol, only a small percentage is
required to facilitate transition into the gas phase. The use of methanol raised concerns regarding
the appropriate amount to add and possible effectes the solvent could have on the DNA structure.
The binding mechanism for MG binders in contingent on the shape and width of the MG and the
selectivity of these compounds is also dependent on solvent effects. Based on our findings,
solutions containing variable methanol concentrations did not show significant conformational
effects based on the amount of complex observed.
The instrument was flushed with 150 mM NH4OAc prior to sample injection. Scans were
collected every 1.0 sec for 10 min with the final 2 min averaged. Raw spectra of the free DNA and
DNA-complexes showed multiply charged species ranging 300 – 3000 m/z and the most abundant
peaks belonged to -4, -5, and -6 charge states (Figure 2.4). Spectra were deconvoluted using the
Maximum Entropy 1 function which calculates the molecular ion (M) based on the equations
below, where H is the proton molecular weight, m’ and m” are specific m/z values, and z’ is the
charge state for m’.
z’ = (m”− H) / (m’ – m”) (1)
2.9 References
1. Abudaya A, Brown PM, Fox KR. DNA sequence preferences of AT-selective minor groove binding ligands. Nucleic Acids Res. 1995, 23: 3385-3392.
2. Wartell RM, Larson JE, Wells RD. Netropsin. A specific probe for A-T regions of duplex deoxyribonucleic acid. J. Biol. Chem. 1974, 249: 6719–6731.
3. Laughton CA, Tanious F, Nunn CM, Boykin DW, Wilson WD, Neidle S. A
crystallographic and spectroscopic study of the complex between d(CGCGAATTCGCG)2 and 2,5-bis(4-guanylphenyl)furan, an analogue of berenil. Structural origins of enhanced DNA-binding affinity. Biochemistry1996, 35: 5655-5661.
4. Bailly C, Tardy C, Wang L, Armitage B, Hopkins K, Kumar A, Schuster GB, Boykin DW,
Wilson WD. Recognition of ATGA sequences by the unfused aromatic dication DB293 forming stacked dimers in the DNA minor groove. Biochemistry1996, 40: 9770-9779.
5. Rosu F, De Pauw E, Gabelica V. Electrospray mass spectrometry to study drug-nucleic acids interactions. Biochimie2008, 90: 1074-1087.
6. Gabelica V, Galic N, Rosu F, Houssier C, De Pauw E. Influence of response factors on
determining equilibrium association constants of non-covalent complexes by electrospray ionization mass spectrometry. J. Mass Spectrom. 2003, 38: 491-501.
7. Fasman, GD. Handbook of Biochemistry and Molecular Biology1975, 3rd ed., CRC Press, Cleveland.
8. Gabelica V, De Pauw E, Rosu F. Interaction between antitumor drugs and a double-stranded oligonucleotide studied by electrospray ionization mass spectrometry. J. Mass Spectrom. 1999, 34: 1328-1337.
9. Rueda M, Luque FJ, Orozco M. Nature of minor-groove binders-DNA complexes in the
3 RESOLUTION OF MIXED SITE DNA COMPLEXES WITH DIMER-FORMING
MINOR GROOVE BINDERS BY USING ELECTROSPRAY IONIZATION MASS
SPECTROMETRY: COMPOUND STRUCTURE AND DNA SEQUENCE EFFECTS
Sarah Laughlin, Siming Wang, Arvind Kumar, Abdelbasset A. Farahat,
David W. Boykin, W. David Wilson.
Laughlin S, et al. Chemistry, 2015, 21 (14): 5528-5539.
Copyright © 2015 Chemistry – A European Journal
My contribution to this chapter was in sample preparation and spectra analyses for mass
spectrometry, thermal melting studies, circular dichroism studies, molecular modeling studies,
and writing.
3.1 Abstract
Small molecule targeting of the DNA minor groove is a promising approach to modulate