Analytical Study and Prediction of Consumer Price
Index for Rwanda Using Data Mining Techniques
Pascal Sindayiheba*, Jean De Dieu Rwamasunzu**, Dr. Papias Niyigena*** *Student at MSc. IT, Department of Information Technology, University of Lay Adventists of Kigali **Student at MSc. IT, Department of Information Technology, University of Lay Adventists of Kigali
***Lecture, Department of Information Technology, University of Lay Adventists of Kigali
DOI: 10.29322/IJSRP.9.11.2019.p95117
http://dx.doi.org/10.29322/IJSRP.9.11.2019.p95117
Abstract- Several works using different tools with various
algorithms and models, worked on forecast of agricultural areas include crop yield. However, their findings still need improvement for more accurate performance. Precisely predicting the change of CPI is significant to many aspects of economics, some examples include fiscal policy, financial markets and productivity. In this study, we are conducting an analytical study to discover which factor is most affecting changes of Consumer Price Index for Rwanda and make prediction of CPI for 2019 to 2025. The dataset is extracted from online platform of World Bank on world economy, especially for Rwanda (1990 - 2018).
M5Rules algorithm is used with MAE and MAPE performance metrics to test the model performance on dataset; the model built by M5Rules with MAPE is found the best model to fit our dataset. The results indicated that IVI is the best factor that influencing the CPI for this long period studied from 1990 – 2025.
Index Terms- Analytical, Consumer Price Index, Time series,
Prediction.
I. INTRODUCTION
he era of Big Data has accelerated the use of data mining (Galit, S. et al., 2018). The amount of data in the world, in our lives, seems to go on and on increasing and there’ s no end in sight (Ian H. W. and Frank, E., 2005). The analysis of data has formed a cornerstone of scientific discovery in many domains (Kamath, C., 2009).
Galit, S. et al., 2018, continue saying that, a common task in data mining is to examine data where the classification is unknown or will occur in the future, with the goal of predicting what that classification is or will be. Kamath, C., 2009, also said, the original or “ raw” data which are provided for data mining often need extensive processing before they can be input to a pattern recognition algorithm.
To date, various economic indicators of interest can predicted for specific sectors of economy include Consumer Price Index (CPI), Exchange rate, Import value, etc. (Godwin, A. et al. 2017). CPI number measures changes in the general level of prices of a group of commodities; Precisely predicting the change of CPI is significant to many aspects of economics, some examples include fiscal policy, financial markets and productivity. Also, building a stable and accurate model to forecast the CPI will have
great significance for the public, policy makers and research scholars (Nyoni, T., 2019).
In this study, we are conducting an analytical study to discover which factor is most affecting changes of Consumer Price Index for Rwanda and make prediction of CPI for 2019 to 2025. The dataset is extracted from online platform of World Bank on world economy, especially for Rwanda (1990 - 2018).
The Consumer Price Index (CPI) is a measure that examines the weighted average of prices of a basket of consumer goods and services, such as transportation, food, and medical care. CPI is widely used as an economic indicator. It is the most widely
used measure of
inflation and, by alternative, of the effectiveness of the government’ s economic policy.
In this research we are examining Import value index (IVI), Official Exchange Rate (ER), and Food Production Indices (FPI) indicators to find the relationship of each one vis-à-vis the Consumer price Index (CPI); then from those relationships we can set rules that govern the changes of Consumer Price Index and we shall predict the future value of Consumer Price Index for Rwanda (2019 – 2025).
II. LITERATURES
Godwin, A. et al. 2017, in this research study, the Artificial Intelligence (AI) approach was applied by combining neural networks and fuzzy logic to develop a neuron fuzzy model so as to improve prediction accuracy of CPI. The first step was to prepare the data; the data collected were transformed into matrix vector having one row and many columns. MATLAB software was used for simulating the experiments in the process of designing and testing neuro fuzzy model. Root Mean Square Error (RMSE) and Mean Absolute Percentage Error (MAPE) were used as error metrics.
For a period of 15 years from January 2000 to January 2014, they used seven input variables and one output to forecast the US future CPI using subtractive clustering method for generating FIS then as shown, the prediction errors are small in RMSE (0.44886) and MAPE (0.233839).
Regression, Ridge Regression, Lasso Regression, XGboost Regression, and Random Forest Regression with RMSE, MSE and MAE performance accuracy for forecasting of inflation of CPI. The results of this study show the relative values of RMSE, MSE and MAE for all learned models and all specifications of each model for all forecast horizons. It gives the relative values of RMSE (0.871341), MSE (4.608483) and values of MAE (1.924700) error rates for XGboost Regression model which is the most performing method.
Nyoni, T., 2019, In this study, CPI was used as an indicator of inflation in Germany as they seek to model and forecast CPI using ARIMA models, one of the methods that are commonly used for forecasting time series data is the Autoregressive Integrated Moving Average (ARIMA).
The researchers confirmed that a model with a lower Akaike Information Criterion (AIC) value is better than the one with a higher AIC value. Theil’ s U must lie between 0 and 1, of which the closer it is to 0, the better the forecast method, the study will only consider the AIC as the criteria for choosing the best model for forecasting inflation.
From the results, this study indicates that the accuracy of forecast, as given the most performing model is ARIMA (1, 1, 1) model which is satisfactory since it falls within the 95% confidence interval. The results of the study indicate that a 1%
increase in the previous period CPI will lead to approximately 0.9% increase in the current period CPI.
Habimana, N. et al. 2016, the aim of their project was to model and forecast the future value of CPI which will be of great significant to policy makers, investors and also to the Central Bank in setting consequently monetary policies. Two approaches such as, Moving Average (MA) and Autoregressive (AR), have been used in modeling univariate time series data. The series was not stationary, that why researchers combined the two models to form ARIMA class to assure the stationary series. To assess the accuracy of the model, Mean Absolute Error (MAE), Root Mean Squared Error (RMSE) and Mean Absolute Percentage Error (MAPE).
After experiment, the results shown that the ARIMA (4,1,6) model was the one with the smallest forecasting error for RMSE (0.776), MAE (0.5742) and MPE (0.06138) comparing to the rest of other models despite their smallest value of BIC, AIC and AICs.
III. METHODOLOGY
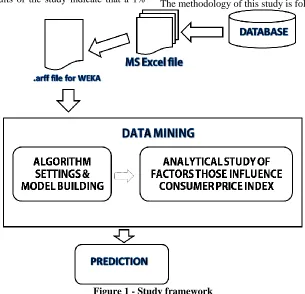
[image:2.612.153.458.329.623.2]Methodology of this research, is explaining the way from row data to the expected results by achieving research objectives. The methodology of this study is following the flowchart below:
Figure 1 - Study framework
3. 1 Data Preprocessing
Data used within this research is obtained from www.data.worldbank.org, a World Bank online data platform; we focused on Rwanda between 1990 and 2018; downloaded data is about Import value index, Official Exchange Rate, and Food Production Indices in Microsoft Excel file (.xls) format, we had converted this into Attribute-Relation File Format (.arff) file which can be supported by WEKA tool. This data pre-processing
phase it ended by getting a dataset to be used for next step where this dataset will processed.
3. 2 Data analysis
Time series forecaster feature of WEKA 3.8.3 has two panels named “ Basic configuration” and “ Advanced configuration” these contain other features to set up algorithms’ parameters and build models to test, model and analyze our dataset. In this study, we select M5Rules algorithm to be used for building models on our dataset; Bui, X-N et al., 2019, said that this algorithm uses a tree learner over the training samples to train a pruned tree. Then, the elite leaf is made into a rule, and the tree is discarded and this action can be mentioned as the exclusive difference between M5Rules and regular process that creates a single rule.
By default, classification algorithm performance is measured by Mean Absolute Error (MAE), and Root Mean Squared Error (RMSE) metrics. Instead, we considered MAE in our experiments, as it is a common method to evaluate the
performance of prediction
approaches and gives the same weight to all individual differences, then to strength our results we add Mean Absolute Percentage Error (MAPE) which is a statistical metric of how accurate a forecast system is; this is measured as the average absolute percent error of actual values minus forecasted values divided by actual values. This is the most common measure used to forecast error. The two metrics are computed through the following formulas;
1
1
|
|
n
i i
MAE
x
x
n
(1)
Where;
n: The number of errors ∑: Summation symbol |xi-x|: Absolute errors
|
|
100
A F
A
MAPE
N
(2) Where;
A: Actual
[image:3.612.312.586.300.476.2] [image:3.612.314.591.545.711.2]N: Number of observations F: Forecast
| |: Stands for absolute value
Above metrics are expressing forecasting error rate in percentage, lower values indicate that the forecasted values are good predictions and the higher they increase in percentage indicates that forecaster is doing worse predictions.
While implementing our research experiment, we start by loading dataset file into WEKA 3.8.3 tool, we select M5Rules algorithm to train our dataset; Time stamp is set as “ year” , Periodicity as “ detect automatically” , Number of time units to forecast as 7 and Perform evaluation check box is “checked” to evaluate the algorithm performance level. Thereafter, we test our target algorithm with MAE and MAPE accuracy metrics, by associating IVI, ER and FPI indicators, one by one, to CPI to find one that is more influencing the changes of CPI for Rwanda with consideration of 1990 to 2018.
IV. RESULTS
During our data analysis phase, as stated above, we trained with M5Rules algorithm with MAE and MAPE to measure its
accuracy; during this phase, five experiments, named CPI – IVI, CPI – ER, CPI – FPI, CPI – IVI – ER – FPI and CPI, were conducted TO determine which indicator can influence the changes of CPI within a given period.
When interpreting our data, we divided the long-studied period of 1990-2018 under two sub period based on our country history which impacted enough the country economy. We have a period between 1990 and 2003, remarked by political instability, Liberation war, Genocide against Tutsi in 1994, and economically in general, and another period of 2004 to 2018, a period of political stability, prosperous economy and good trading climate.
When consulting the domain experts, they told us that, normally, IVI is the current value of imports converted to US$ and expressed as a percentage of the average for the base period (2000).
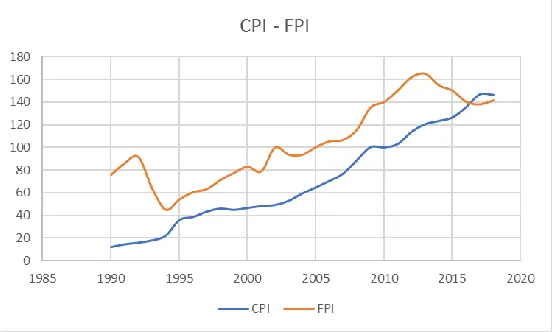
This figure below is drawn from our dataset, we present the curve of CPI and IVI, shows the increase on a rate of 76.74% for CPI and a fall of -11.86% on IVI between 1990 and 2003. For next fifteen years, they grew on a rate of 89.03% and 59.35% for IVI and CPI respectively.
Figure 2 - CPI - IVI Graph
The consulted experts, continue by telling us that, Food Production Index (FPI), covers food crops that are considered edible and that contain nutrients, coffee and tea are exluded because they have no edible nutritive value.
With observation of our data, we present the relationship of CPI – FPI as shown in figure above; as stated before the value of CPI still the same, here we are evaluating the FPI curve. Between 1990 and 2003, it was growing with 84.43% rate and from 2004 to 2018, it was on 32.94%. This increase is affecting strongly positive the CPI within thirteen previous years and increase with weak trend in next sixteen years, 2004 – 2018.
[image:4.612.38.298.183.350.2]The Exchange rate (ER), as another studied indicator in this study, is the value of local currency for the purpose of conversion to another one, usually US$.
Figure 4 - CPI - ER Graph
As shown in Figures 2 and 3, the selected indicators IVI and FPI are presented; ER is growing with 18.98% rate under
1990-2003 period and 33.87% in next fifteen years, from 2004 to 2018. This scatter plot describes weak positive trend between Exchange rate and CPI, The value of CPI increases slightly as the value of exchange rate increases.
With the experts definitions, we can confirm that this fall of Imported Value Index is due to Rwanda economic problems from the fall of Coffee at the international market in the late 1980s, this cause the economy to fall down and the ability of importing goods and services was delimited; This was more interrupted by country insecurity, where by beginning of October 1990, marks the start of Liberation war, Genocide against Tutsi in 1994, the refugees around anyway, which lead to the people displacement and with this is understandable that they could not import while being disturbed.
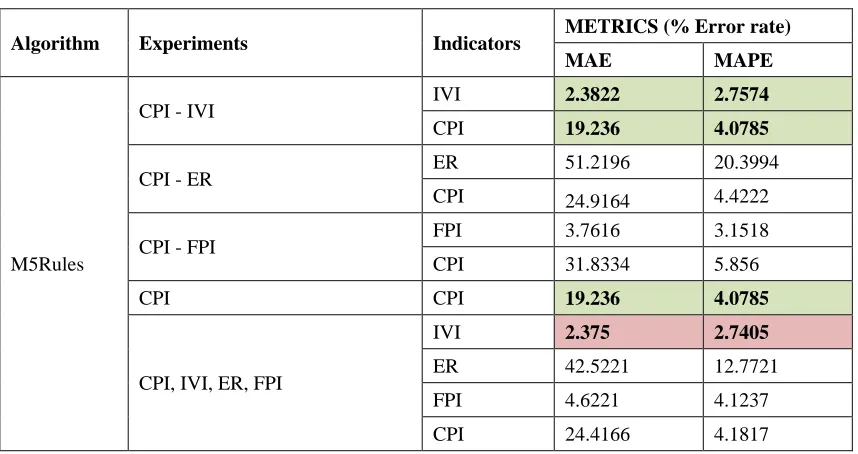
[image:4.612.93.522.415.642.2]In overview analysis, the whole selected indicators, are affected by the country instability between 1990 and 2003, while in new period of 2004 ahead will be an improvement of economics of the country in all corners. This is observed in increase of IVI from 121.47% to 133.08%, for ER was increased from 93.75% to 93.84%, from 537.65% to 577.44% for FPI and 52.92% to 59.41% for CPI, all respectively they increased from 2003 to 2004. From these experiments’ results, we find that the experiment CPI – IVI is the best from other experiments of CPI with each one of the associated indicators that gives the smallest values of MAE and MAPE with 2.3822% error rate for MAE and 2.7574% error rate for MAPE.
Table 1 - M5Rules experiments results
Algorithm Experiments Indicators METRICS (% Error rate)
MAE MAPE
M5Rules
CPI - IVI IVI 2.3822 2.7574
CPI 19.236 4.0785
CPI - ER ER 51.2196 20.3994
CPI 24.9164 4.4222
CPI - FPI FPI 3.7616 3.1518
CPI 31.8334 5.856
CPI CPI 19.236 4.0785
CPI, IVI, ER, FPI
IVI 2.375 2.7405
ER 42.5221 12.7721
FPI 4.6221 4.1237
CPI 24.4166 4.1817
Also, as indicated in the table above, values for MAE and MAPE of CPI in two experiments, CPI – IVI and CPI alone are similar, with 19.236% and 4.0785% errors respectively and within experiment that combines all indicators, values of IVI are respectively, 2.375%, 2.7405% errors for MAE and MAPE. This satisfies the first objective of this study and leads us to conclude
that from 1990 to 2018, Consumer Price Index (CPI) for Rwanda is influenced by Imported Value Index (IVI).
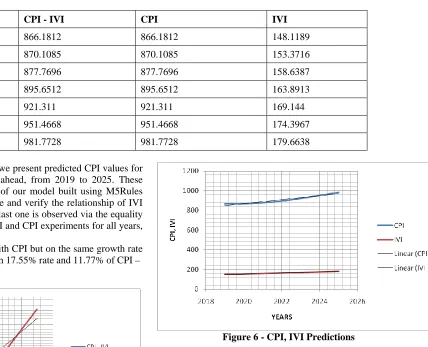
Table 2 - Predicted CPI Values, 2019 – 2025
Year CPI - IVI CPI IVI
2019 866.1812 866.1812 148.1189
2020 870.1085 870.1085 153.3716
2021 877.7696 877.7696 158.6387
2022 895.6512 895.6512 163.8913
2023 921.311 921.311 169.144
2024 951.4668 951.4668 174.3967
2025 981.7728 981.7728 179.6638
From the table above, we present predicted CPI values for Rwanda within seven years ahead, from 2019 to 2025. These results confirm the accuracy of our model built using M5Rules with MAPE accuracy measure and verify the relationship of IVI indicator to CPI change, this last one is observed via the equality of predictions from CPI – IVI and CPI experiments for all years, from 2019 to 2025.
[image:5.612.156.584.105.452.2]The IVI is changing with CPI but on the same growth rate level; IVI value will grow with 17.55% rate and 11.77% of CPI – IVI experiment.
Figure 5 - Predictions from CPI-IVI and CPI Experiments
With data mining observation, from figure above, we see that CPI – IVI and CPI curves and tending line are mixed because their values are equals for all predicted years. Also the results in Table 2, indicate that will be an augmentation of 5.2527 for respective years 2019 – 20, 2022-23, 2023-24 and an addition of 5.2571 for 2020-21, 2024-25 and 5.2526 for 2023 for IVI values.
Figure 6 - CPI, IVI Predictions
The value of Rwandan Import Value Index is at low base which is increasing with time; this is justified by the results from Table 2, and this will continue to increase from 2019 to 2025 with 148.11% and 179.66% respectively.
V. CONCLUSION
[image:5.612.39.297.393.543.2]and within experiment that combines all indicators, values of IVI are respectively, 2.375%, 2.7405% errors for MAE and MAPE. The studied indicators in this study have been at the maximum value in 1213.95% in 2018; 146.62% in 2017; 165.22% in 2013 and 861.09% for IVI, CPI, ER and FPI respectively. This results to the increase of demand for country in different sectors like construction, education, technology, and others.
By concluding, we say that countries are having different ways to earn some income and then the consumption depends to the level of income and interest rate. Among the following values, IVI, FPI and ER; the import value index affects positively the consumer price index as their increase.
ACKNOWLEGMENT
I would like to express my deep sees of gratitude to the University Of Lay Adventists Of Kigali, UNILAK, administration, lecturers, especially Dr. Papias NIYIGENA, and classmates for providing me with the knowledge to do this research project work.
REFERENCES
[1] Galit, S. et al., 2018; Data mining for business analytics Concepts, Techniques, and Applications in R. John Wiley & Sons, Inc., 111 River Street, Hoboken, NJ 07030, USA.
[2] Ian H. W. and Frank, E., 2005; Data Mining - Practical Machine Learning Tools and Techniques, Second Edition. Morgan Kaufmann Publishers is an imprint of Elsevier. 500 Sansome Street, Suite 400, San Francisco, CA 94111
[3] Kamath, C., 2009; Scientific Data Mining - Are practical perspective. Lawrence Livermore National Laboratory Livermore, California. ISBN 978-0-898716-75-7
[4] Bui, X-N. et al., 2019; Developing a predictive method based on optimized M5Rules– GA
[5] predicting heating load of an energy efficient building system. Springer-Verlag London Ltd., part of Springer Nature 2019
[6] Godwin, A. et al. 2017; Neuro fuzzy modelling for prediction of consumer price index. International Journal of Artificial Intelligence and Applications (IJAIA), Vol.8, No.5, September 2017.
[7] Nyoni, T., 2019; ARIMA modeling and forecasting of Consumer Price Index (CPI) in Germany. University of Zimbabwe, Department of Economics. MPRA Paper No. 92442, posted 02 Mar 2019 06:26 UTC
AUTHORS
First Author: Pascal SINDAYIHEBA, Student at Masters of Science in Information Technology at University of Lay Adventists of Kigali (UNILAK), [email protected]
Second Author: Jean de Dieu RWAMASUNZU, Student at Masters of Science in Information Technology at University of Lay Adventists of Kigali (UNILAK), [email protected]