R E S E A R C H
Open Access
Computational modeling of GMI effect in
Co-based amorphous ribbons
Asli Ayten Kaya
*Dedicated to Professor Hari M Srivastava
*Correspondence:
Physics Department, Faculty of Arts and Sciences, Uludag University, Gorukle Campus, Bursa, 16059, Turkey
Abstract
This paper presents a prediction of a giant magneto-impedance (GMI) effect on Co-based amorphous ribbons using an artificial neural network (ANN) approach based on a self-organizing feature map (SOFM). The input parameters included the compositions of Fe and Co, ribbon width and magnetizing frequency. The output parameter was the GMI effect. The results show that the proposed model can be used for estimation of the GMI effect in the amorphous ribbons.
Keywords: giant magneto-impedance effect; neural network; modeling
Introduction
When a soft ferromagnetic conductor is subjected to an alternating current, a large change in the complex impedance of the conductor can be achieved upon applying a magnetic field. This phenomenon is known as the giant magneto-impedance (GMI) effect []. This effect has received increasing attention for its potential applications in highly sensitive magnetic sensors [].
The ANN is simply a class of mathematical algorithms, since a network can be regarded essentially as a graphic notation for a large class of algorithms. Such algorithms produce solutions to a number of specific problems [].
In this investigation, the GMI effects are modeled using self-organizing feature map (SOFM) and previous experimental data [, ] of amorphous ribbons made from CoFeSiBand Co.Fe.SiBalloys.
Experimental details
Self-organizing feature map (SOFM)
Self-organizing feature maps (SOFM), also known as Kohonen maps or topographic maps, were first introduced by von der Malsburg () and in its present form by Kohonen (). SOFM is a special neural network that acceptsN-dimensional input vectors and maps them to the Kohonen layer, in which neurons are organized in anL-dimensional lattice (grid) representing the feature space. Such a lattice characterizes a relative posi-tion of neurons with regards to their neighbors, that is, their topological properties rather than exact geometric locations. In practice, dimensionality of the feature space is often re-stricted by its visualization aspect and typically isL= , or . The objective of the learn-ing algorithm for the SOFM neural networks is formation of the feature map which
KayaJournal of Inequalities and Applications2013, 2013:293 Page 2 of 5 http://www.journalofinequalitiesandapplications.com/content/2013/1/293
tures the essential characteristics of theN-dimensional input data and maps them on the typically -D or -D feature space [].
During training, the weights are updated according to the formula:
wij(t+ ) =wij(t) +η(t)(ui–wij)ui–wijN(j,t),
wherewijanduiare theith component of the weight vectorwjof the neuronnjand the
patternuk applied to the input layer respectively, η(t) is the learning rate andN(j,t) is the neighborhood function which is changing in time. The learning algorithm captures two essential aspects of the map formation, namely competition and cooperation between neurons of the output lattice. Competition determines the winning neurondwin, whose
weight vector is the one closest to the applied input vector. For this purpose, the input vectoruis compared with each weight vectorwjfrom the weight matrixW, and the index
of the winning neuronnwinis established considering the following formula:
nwin=argminu–wj.
All neuronsnj located in a topological neighborhood of the winning neuronsnwin will
have their weights updated usually with strengthN(j) related to their distanced(j) from the winning neuron, whered(j) can be calculated using the formula
d(j) =pos(nj) –pos(nwin),
wherepos(·) is the position of the neuron in the lattice [].
SOFM training algorithm
. Assign small random values to weightswj= [wj,wj, . . . ,wnj];
. Choose a vectorukfrom the training set and apply it as input; . Find the winning output nodenwinby the following criterion:
nwin=argmin
j
u–wj,
where · denotes the Euclidean norm andwjis the weight vector connecting input
nodes to the output nodej;
. Adjust the weight vectors according to the following update formula:
wij(t+ ) =wij(t) +η(t)(ui–wij)(ui–wij)N(j,t),
wherewijis theith component of the weight vectorwj,η(t)is the learning rate and
N(j,t)is the neighborhood function;
. Repeat Steps through until no significant changes occur in the weights [].
Developed ANN model
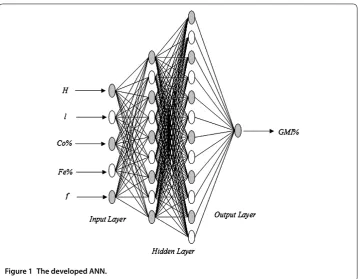
Figure 1 The developed ANN.
two hidden layers, nine and twelve neurons of hidden layers and full connectivity between neurons, was shown in Figure . The input parameters were magnetizing field (H), ribbon width (l), magnetizing frequency (f), concentration of Co (Co%) and concentration of Fe (Fe%). The output parameter was the GMI effect (GMI%). The number of hidden layers, neurons in each hidden layer and training parameters were determined through trial and error to be optimal. After several trials, a better result was obtained from the network a four-layered network. In this network, the hyperbolic tangent function is used in the hidden and output layers. The number of epochs was , for training.
Results and discussion
In this study an attempt was made to predict the GMI effect of Co-based amorphous rib-bons (CoFeSiBand Co.Fe.SiB) using artificial neural networks. To achieve
this goal, magnetizing field (H), ribbon width (l), magnetizing frequency (f), concen-tration of Co (Co%) and concenconcen-tration of Fe (Fe%) were used as the input of networks, and GMI% data points were used as the output of these networks. Finally, network was achieved with the least cross validation error for Co-based amorphous ribbons.
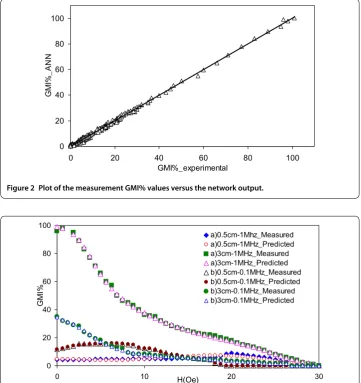
As it is indicated in Figure , the predicted GMI data points using neural networks follow the experimental results in an appropriate manner. It is obvious that the predicted GMI%, using neural networks and the experimental results, is found to be a perfect match for the trained data.
Figure shows the GMI effect obtained from the prediction model and experimental data at .- MHz for CoFeSiB and Co.Fe.SiBamorphous ribbons which
KayaJournal of Inequalities and Applications2013, 2013:293 Page 4 of 5 http://www.journalofinequalitiesandapplications.com/content/2013/1/293
[image:4.595.117.479.84.468.2]Figure 2 Plot of the measurement GMI% values versus the network output.
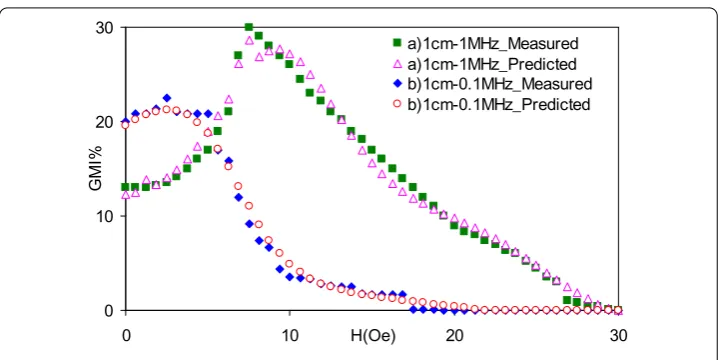
Figure 3 Comparisons of experimental data and predicted GMI effect in (a) Co70Fe5Si15B10and (b)
Co70.4Fe4.6Si15B10ribbons.
All the tested samples in the range of training data have significant correlation coef-ficients. The ANN model was assessed with mm width amorphous ribbons which are outside the range of the training data. Figure shows good agreement with the experi-mental data; therefore, the ANN should be used for the prediction and modeling of GMI values.
These results show that the proposed model is potentially useful for sensor designers in predicting the GMI curves in cases when measurements may be time consuming.
Conclusions
In this study the proposed model was developed from experimental data for the Co-based amorphous ribbons. This study demonstrates the applicability and feasibility of artificial neural network models to predict the GMI effect for CoFeSiBand Co.Fe.SiB
Figure 4 The variation of predicted and measured values for (a) Co70Fe5Si15B10and (b)
Co70.4Fe4.6Si15B10amorphous ribbons.
predicted values of these ribbons are in good agreement with the measured ones. There-fore, this model is appropriate for a researcher to evaluate the sensor performance before manufacture.
Competing interests
The author declares that they have no competing interests.
Received: 31 January 2013 Accepted: 28 May 2013 Published: 14 June 2013
References
1. Phan, MH: Giant magnetoimpedance materials: fundamentals and applications. Prog. Mater. Sci.53, 323-420 (2008) 2. Gong, WY, Wu, ZM, Lin, H, Yang, XL, Zhao, Z: Longitudinally driven giant magneto-impedance effect enhancement by
magneto-mechanical resonance. J. Magn. Magn. Mater.320, 1553-1556 (2008)
3. Zurada, JM: Introduction to Artificial Neural Systems. West Publishing Company, Eagan (1992)
4. Goncalves, LAP, Soares, JM, Machado, FLA, de Azevedo, WM: GMI effect in the low magnetostrictive Co70Fe5Si15B10 alloys. Physica B384, 152-154 (2006)
5. Mendes, KC, Machado, FLA: Enhanced GMI in ribbons of Co70.4Fe4.6Si15B10alloy. J. Magn. Magn. Mater.177-181, 111-112 (1998)
6. Halici, U: Data Clustering and Self-Organizing Feature Maps. In: Artificial Neural Networks. EE543 Lecture Notes, ch.8, pp. 135-136. Metu Eee, Ankara (2004)
doi:10.1186/1029-242X-2013-293