A Case Study of Flint, Michigan
A Thesis Proposal Presented to the Department of Sociology at the University of Michigan
By Karina Lopez lopezkar@umich.edu
April, 2016
Dr. Jeffrey Morenoff, Professor of Sociology and Director of the Population Studies Center Honors Faculty Advisor
ii ABSTRACT
How are perceptions of neighborhood disorder by Flint, Michigan residents related to these residents’ fear of crime, and how do those perceptions influence their movement within their
urban space? I propose that residents who perceive high disorder in their neighborhood will be more likely to express high levels of fear of crime and that residents expressing high fear of crime will be more likely to avoid certain areas of the city, limit their activity, spend less time away from home, or not go out alone after dark. I collected and analyzed survey data from 125 Flint residents on the topics of fear of crime, neighborhood disorder and constrained social behavior as well as data from systematic social observation of nineteen city blocks within the city of Flint. I found that perceptions of disorder were indirectly linked to fear of crime, mediated through perceived risk of victimization. I also found that residents were more likely to change their behavior if they expressed high levels of fear but that behavioral change was much more likely if residents expressed high levels of both fear and perceived risk of victimization. These
results confirm and extend upon known associations between perceptions of disorder, fear of
iii
ACKNOWLEDGEMENTS
I would first like to sincerely thank my advisor, Dr. Jeffrey Morenoff, for devoting countless hours to guiding me throughout this process. Thank you for your encouragement, your support, and for challenging me to become a better sociological thinker. This would not have been possible without your mentorship.
I would also like to thank both Karin Martin and Sarah Burgard. Thank you both for making yourselves available to answer questions and for motivating and uplifting me when the process seemed overwhelming. Without your help and the help of my colleagues in the Honors cohort I would surely have gone insane. To my colleague and dear friend Ben Frey, I will miss our late nights working together in the library. I can’t wait to see where life takes us next.
I would next like to thank the University of Michigan Sociology Department, as well as the Graf family and the generous donations of Honors alumnus to the LSA Honors Program for their support through the provision of funding which made this research possible. Special thanks to both P.J. McGann and Alex Murphy for offering suggestions, support and friendship over the past two years. Thanks also to Shoshana Shapiro, I honestly could not have asked for a better graduate student mentor and friend.
Finally, I am deeply grateful for the love and support that I have received from my family and friends. To my mentor Jessica, thank you for sharing your wisdom with me, and teaching me the language of the heart. To my mother and father, thank you for teaching me to value hard work and education, for never losing faith in me and for making this accomplishment possible. To my partner, thank you for being a good listener, a supportive friend, and an incomparable life partner. You continue to inspire me to be a better person everyday.
iv
TABLE OF CONTENTS
1. Introduction ... 1
2. Literature Review ... 3
Disorder and Fear of Crime ... 3
Constrained Social Behavior... 8
The Risk Interpretation Model ... 11
3. Methodology and Measures ... 14
Overview ... 14
Standpoint ... 15
The Study Area ... 16
Site Selection Process ... 16
Data Sources ... 18
Census Data ... 18
Systematic Social Observation ... 18
Neighborhood Survey ... 21
Analytic Strategy ... 21
Study Variables ... 23
Fear of Crime ... 23
Perceived Risk of Victimization ... 25
Risk/Fear Typologies ... 25
Perceived Disorder ... 25
Observed Disorder ... 28
Constrained Social Behavior... 29
Demographics ... 29
Sample Description ... 30
4. Results ... 36
Predicting Fear of Crime ... 36
Predicting Constrained Social Behavior ... 41
Predicting Constrained Social Behavior Using Risk/Fear Typologies ... 49
5. Discussion... 52
6. Appendices Appendix A: Consent Form ... 58
Appendix B: Door-to-door Survey Script ... 61
Appendix C: IRB Safety Plan ... 62
Appendix D: Survey Instrument ... 63
Appendix E: Systematic Social Observation Coding Sheet ... 68
v
LIST OF TABLES
Table 1: Distribution of Respondents in the Typology ...26
Table 2: Demographics of Respondents in the Study ...30
Table 3: Summary Statistics for Variables Used in Analysis ...32
Table 4: Regression Models Predicting Fear of Crime ...37
Table 5: Regression Models Predicting Perceptions of Disorder ...39
Table 6: Ordered Logistic Regression Models Predicting Going Out After Dark ...42
Table 7: Ordered Logistic Regression Models Predicting Time Spent Away From Home ...44
Table 8: Logistic Regression Models Predicting Changed Activity ...46
Table 9: Logistic Regression Models for Predicting Avoidance of Areas ...48
vi
LIST OF FIGURES
During the summer of 2014 in the city of Flint, Michigan a person could drive down Miller Road and at any given intersection expect to be approached by at least one homeless person asking for spare change. The homelessness problem grew to be such a concern that on October 20th, 2014 an ordinance1 was presented to the Flint Township Board to make it a ticketable offence for people to stop traffic to give money to the panhandlers and beggars. The ordinance would also limit soliciting to those individuals who had acquired a permit. There was concern however amongst city officials that passing this ordinance would unintentionally raise crime by forcing panhandlers desperate for money down a different, more serious path of crime. Despite this concern the begging and soliciting committee passed the city ordinance after
deciding that ensuring that Flint residents felt safe was worth the risk of rising crime. Residents do not like being approached by unpredictable, potentially dangerous strangers while walking down the street or pulling up to intersections. They want to feel safe when they are in public spaces, and when they do not there are serious implications.
The problems of homelessness and panhandling fall under a category referred to as disorder, or incivility, that is thought to be a major factor in fueling fear of crime. Since the 1960’s, the topics of neighborhood disorder and fear of crime have become increasingly salient
to criminologists, urban sociologists and policy planners. In a study on disorder and decline in American neighborhoods Skogan (1990) established a causal link between disorder and fear of crime, as well as a link between disorder and serious criminal activity. The evidence suggested that disorder could work in communities to stimulate rapid neighborhood decline because signs of disorder, such as litter, broken out windows, public intoxication, and panhandling, are visual
1 See http://www.flinttownship.org/Portals/68/2015%20all/TRAFFIC%20SAFETY.pdf to read
cues that symbolize a breakdown in the local social order (Skogan 1986a). These signs of disorder signal to the observer than the environment is not cared for and therefore that it may be unpredictable and dangerous. Thus the observer perceives they are in danger of being victimized by crime and exhibits heightened levels of fear.
The major implication of Skogan’s study is that disorder can ignite a cycle in which heightened levels of fear lead to ecological conditions that further increase fear, disorder, and possibly the actual threat of crime. The presumed reason is that when an individual observes signs of disorder they perceive they are at a higher risk of being victimized by crime and thus experience more fear. Other studies have found that elevated levels of fear lead to increased constrained social behavior such as avoiding certain areas of the city or withdrawing from community spaces (Liska, Sanchirico, and Reed 1988; Rengifo and Bolton 2012). If fewer residents are occupying public spaces within their neighborhoods it leaves those spaces open for more disorder and crime to take place, thus further fueling resident fear. Although later studies have asserted that the causal link between perceived disorder and crime may have been
overstated (see Sampson & Raudenbush 1999), in the present study I set aside the usual question of whether or not disorder causes crime and instead examine the relationship between both perceived and observed disorder, fear of crime, and constrained social behavior in the neighborhood decline feedback process.
the people who are more fearful of crime also more likely to change their behavior by avoiding certain areas of the city, limiting their activity, spending less time away from home, or not going out alone after dark? Answering these questions is essential to improve our understanding of the overall neighborhood decline cycle.
Using Flint, Michigan as a case study I seek to examine the association between neighborhood disorder, fear of crime, and withdrawal from community spaces by asking the following question: How are perceptions of neighborhood disorder by Flint, Michigan residents related to these residents’ fear of crime, and how do those perceptions influence their movement
within their urban space?
LITERATURE REVIEW Disorder and Fear of Crime
Incivility is a blanket term that encompasses “signs of danger,” “broken windows,” “disorder,” “cues to danger” etc. The most frequent term used to classify these characteristics is Hunter’s proposed concept of ‘incivility’ (Ferraro et al. 1992). Throughout this study I refer to
both incivilities and disorder and use these terms synonymously, however, I choose to define my study variable as ‘disorder’ rather than ‘incivility’ because I believe the term disorder more
clearly captures the items of interest in this study. Still, throughout the literature review I will use the term ‘incivility’ to preserve the language used by incivility theorists.
hanging out in the streets. In previous studies, these are commonly reduced to five categories: noisy neighbors, teenagers hanging on streets, drunks or prostitutes in streets, litter laying about, vandalism or graffiti (Skogan 1990; Markowitz et al. 2001).
One difficulty with conceptualizing incivility is that many forms of incivility are actually crimes, just less serious ones. For example, public intoxication and prostitution, which are frequently considered measurements of disorder, are also actual crimes. In this sense disorder and crime may just be different manifestations of the same phenomenon (Sampson and
Raudenbush 1999). However, even those forms of incivility that are actual crimes are typically only classified as misdemeanors or petty offenses. Those forms of incivility are usually only punishable by fines rather than jail or prison time (Kelling et al. 1996), so although they are criminal in nature, they are not the type of crime that is most generally feared when fear is produced by these signs of disorder.
such as high poverty, residential instability, lack of cohesion, and disorder, amongst other factors, which result in an inability of a neighborhood to informally control deviant behaviors and maintain order.
Although social disorganization theory has traditionally focused solely on neighborhood structural effects on crime, some studies have sought to extend this theory to the study of fear of crime as well (Markowitz et al. 2001; Abdullah, Marzbali, Woolley, Bahauddin, and Maliki 2014). As social disorganization theory was applied to the study of fear of crime, a link was found between incivilities and resident fear. Those living in neighborhoods with the highest levels of disorganization were those who tended to have the highest levels of fear. Although social disorganization theory focuses on uncovering the relationship between a variety of
neighborhood characteristics, neighborhood cohesion, stability and disorder to name a few, other theories such as the incivility theory or Kelling and Wilson’s (1982) “broken windows” theory2
isolate disorder as a precursor of fear of crime. Incivility theory claims that disorder signals to the observer that there is a lack of effective social control in an area, which results in resident fear of crime.
One of the originators of the incivility theory was Skogan (1990) who focused on incivilities’ role in neighborhood change and urban decay. In a study of disorder and
neighborhood decline Skogan and Lewis (1979) found that personal experience with crime, whether directly through victimization or indirectly through word of mouth, could not completely explain the high levels of fear of crime in cities. Fear levels did not match the distribution of crime such that fear would be high in areas with low crime and vice versa (Skogan and Lewis 1979). Hunter (1978) observed that fear of crime is more prevalent than
2 Wilson’s broken windows theory is a well-known criminological theory that focuses on the
actual criminal victimization and concluded that fear of crime is a problem that needs to be studied for its own sake and not solely as a byproduct of actual crime. He proposed that fear of crime is produced by environmental factors that have a greater influence on resident fear than crime itself does, and that those factors include social and physical disorder such as panhandling, graffiti, litter, etc. Disorder conveys to residents that an area is not cared for, that there is a lack of effective social control in that area and that because officials are unable to deal with minor problems of disorder they are likely to be ineffective against more serious crimes (LaGrange, Ferraro, and Supanic 1992). If incivilities appear and are not taken care of or erased, then their simple presence stimulates more disorder and allows for the multiplication of incivilities because incivilities symbolize abandonment and demoralization (Skogan 1990). Conversely,
neighborhoods free from disorder communicate that they have high levels of social control and result in less fear of crime (Hunter 1978).
fact that statistically speaking they were not. Having officers on foot patrol in neighborhoods made the residents feel protected from social disorder, and feel as though problems of physical disorder would be minimized due to the increased social control.
There is empirical evidence to support a positive relationship between incivility and fear of crime, however there is disagreement about whether this relationship is direct, or is indirectly mediated by perceived risk of victimization. Perceived risk of victimization is an individual’s cognitive assessment of their risk of being victimized by crime. LaGrange and colleagues (1992) found that resident perceptions of incivilities did not have a strong direct effect on fear of crime, yet had a large direct effect on perceived risk, which in turn had a powerful effect on fear. So although the effect of incivilities on fear of crime is almost entirely mediated by risk, incivilities are still predictive of fear. “Incivilities are fear inducing only if they first elevate perceptions of risk” (LaGrange et al. 1992: 326). This differs from other findings that, although perceived
disorder is mediated by perceived risk, it continues to be a significant independent predictor of fear (Gainey, Alper, and Chappel 2010). Abdullah and colleagues (2014) found there to be both a direct and indirect effect of disorder on fear of crime, and a number of other studies have found that incivility indicators have direct and positive relationships with fear of crime (Kelling and Wilson 1982; Skogan 1990; Markowitz et al. 2001).
example, a resident living in a neighborhood that is objectively high in disorder may not perceive high levels of disorder in their neighborhood because they are desensitized to it. On the other hand, one boarded up house in a neighborhood with otherwise no disorder is likely to be very noticeable. Thus it is beneficial to measure and compare both objective assessments of disorder that are systematic and reliable, in addition to residents’ subjective perceptions of disorder. We can use observations of the objective and subjective to understand the relationship between the two and discover the level of disorder individuals within a given community find socially acceptable before they react in fear or modify their social behavior.
Constrained Social Behavior
Introduced by Skogan and Maxfield (1981) vulnerability theory is based on the idea that an individual’s personal characteristics (e.g. age, sex, income, race) in combination with
neighborhood conditions (e.g. disorder) may affect residents’ fear of crime. This theory seeks to explain the relationship between crime, disorder, fear of crime, and perceived risk of
vulnerable and unsafe in public spaces they express elevated levels of fear of crime and are more likely to constrain their social behavior to guard themselves against victimization (Skogan 1986a).
Research on constrained social behavior in response to fear of crime has focused largely on various coping strategies, including modification of public activity space (Rengifo and Bolton 2012). Fear of crime causes people to adapt, which may shape the decisions they make about how they navigate through the urban space. While previous studies have shown links between heightened fear of local crime and constrained social behavior, due to inconsistencies with measurements of fear and differences in measurements of behavioral modifications (e.g. measuring either preventative, adaptive or avoidant behavior) the evidence supporting a relationship between fear of crime and behavioral modification is muddy (Liska et al. 1988; Rengifo and Bolton 2012). Most studies focused on links between specific dimensions of fear (e.g. fear of being robbed, fear of having your house broken into) and narrowly specified
reactions such as installing alarms or getting a watchdog. Few studies examined the link between fear of crime and constrained social behavior more broadly.
One study that did analyze fear and social behavior more broadly found that fear of crime was negatively associated with expansive activity spaces but only in regards to routine activity (Rengifo and Bolton 2012). High levels of fear of crime were linked to reduction of routine activities such as visiting bars or clubs at night, yet were not linked to reduction of compulsory activity, such as time spent away during the day, or employment status. Though this study examined constrained social behavior more broadly than previous studies, it still limited
make a distinction between compulsory and routine activities, and to incorporate measures of preventative, adaptive and avoidant behavior.
Empirical evidence (Liska et al. 1988; Markowitz et al. 2001; Rengifo and Bolton 2012) also suggests a reciprocal relationship between constrained social behavior and fear of crime in which constrained social behavior in response to fear of crime results in increased fear because neighborhoods are then perceived as even more dangerous due to social isolation and decreased involvement with neighborhood activities. Areas of high perceived disorder are the areas that are most feared and subject to behavioral avoidance, which instills still more fear and presents more opportunities for creating of crime and disorder. Fearful people avoid public spaces and ties with their neighbors and therefore are less likely to engage in activities that increase informal social control (Gainey et al. 2010: 121). Similarly, Liska and colleagues found that fear increased constrained behavior which in return increased fear resulting in an “escalating causal loop”
(1988: 835). In general, findings support the theory that fear of crime leads to constrained social behavior in public spaces, which in turn increases fear of crime.
neighborhood characteristics such as residential instability, lack of cohesion or social dynamics. I utilize incivility theory by employing Ferraro’s (1995) risk interpretation model.
The Risk Interpretation Model
The risk interpretation model is a theoretical framework proposed by Ferraro (1995) to approach and untangle the relationship between micro-level and macro-level predictors of fear. The first distinction this model makes is that “fear of crime” and “victimization risk” cannot be
used synonymously and that many earlier studies failed to properly make this distinction. Ferraro defines fear of crime as, “an emotional response of dread or anxiety to crime or symbols that a person associates with crime” (Ferraro 1995). On the other hand risk is a cognitive judgment resulting from an individual’s assessment of crime rates and probability of victimization (Ferraro
1995). By definition, risk involves exposure to the chance of loss or injury (Ferraro 1995). While actual knowledge of risk within any given situation is unattainable, because a person is making a cognitive assessment of an event that has not yet transpired and may not transpire, an individual can only assess their victimization risk from given information and judgment of environmental cues (Ferraro 1995).
crime, yet they might experience fear regardless. Moreover, fear is only one of a number of possible reactions to the cognitive judgment of risk assessment. Other actions Ferraro lists are, constrained behavior, political activism, relocation and other avoidant behavior (Ferraro 1995). For this reason the risk interpretation model makes the distinction between these two concepts.
The risk interpretation model centers on symbolic interactionist theory, a theoretical framework that examines the subjective way in which individuals interpret and respond to objects, situations, behaviors and other things that they encounter in the world. “Symbolic
interactionism is one theoretical perspective, though not the only one, which may be the most illuminating for understanding the role that perceptions of crime risk play in affecting fear” (Ferraro 1995:8). In regards to incivility, this theory helps us understand how individuals interpret information in their environment and then appraise their risk of victimization. Risk interpretation takes place in a situational context (Ferraro 1995). The situation is made up of the objective conditions that an individual finds himself or herself in, and the individual’s
interpretation of these objective conditions make for their subjective experience within that situation.
To summarize, the risk interpretation model works to bridge a gap between macro-level factors and micro-level factors in the analysis of fear of crime. Macro-level factors include environmental conditions of neighborhoods such as disorder, whereas micro-level factors are the individual ways people interpret those conditions to assess their risk of being victimized by crime. Ferraro theorizes (1995) that disorder communicates to an individual that they are at risk of being victimized by crime, the individual perceives they are at risk and experiences
spaces, which creates more opportunities for further disorder to occur thus feeding back into the cycle and contributing to the decline of the neighborhood (Ferraro 1995).
Ferraro (1995) notes twenty studies that use perceived risk and fear of crime as separate measurements (e.g. Lewis & Maxfield 1980; LaGrange & Ferraro 1989) but none of those twenty incorporate measures of incivilities. I found few studies that fully operationalize the risk interpretation model using measurement of incivilities, perceived risk and fear of crime (e.g. Gainey et al. 2010; Rengifo and Bolton 2012; Abdullah et al. 2014) and almost no studies that operationalized the risk interpretation model while including measurements of constrained social behavior. Of the two studies I found to include measurements of constrained social behavior the first (Rengifo and Bolton 2012) used very broad measurements of social behavior, specifying only between compulsory and voluntary activity. The second (Ferraro 1995) used a variety of survey questions to measure both avoidant and defensive behavior, yet these two indexes were summed in the analysis and used only as indicators for the single construct of constrained behavior.
I seek to extend the current literature by operationalizing the risk interpretation model and incorporating separate measures of preventative, adaptive and avoidant social behavior. This study will provide the scientific community with otherwise limited information for
How are perceptions of neighborhood incivility by Flint, Michigan residents related to resident fear of crime, and how do those perceptions influence their movement within the urban space?
METHODOLOGY AND MEASURES
Overview
This study employs a mixed-methods approach combining observational and face-to-face survey data. Survey data consist of responses from 125 residents within nineteen selected census city blocks in Flint, Michigan. City blocks were selected through a stratified probability
sampling method and I traveled to all populated households located on a given city block within the sample. Then individual respondents 18 years of age or older were chosen randomly from among all present households members in a given household within those blocks. This survey was conducted in September 2015 to January 2016 and measures respondents’ fear of crime,
perceived risk of victimization, perception of neighborhood disorder, and social behavior. Observational data were collected within the same nineteen neighborhoods using a systematic social observation method. Observational data measured neighborhood disorder in a natural setting through an objective, well specified procedure that could be duplicated in future research and was based on established methods (Covington and Taylor, 1991; Sampson and Raudenbush, 2004; Karb, Elliott, Dowd and Morenoff, 2012). These data were analyzed to address the
Standpoint
It is necessary to discuss my relationship to the population in this study. As a Flint native I am a member of the group that I am studying, meaning I possess an a priori intimate
knowledge of the Flint community and its residents. There are both advantages and disadvantages to insider research.
Insider knowledge provided me with pre-existing context for my research. Once the neighborhoods were selected for the sample I was able draw from my prior knowledge of the city’s layout and assess whether those neighborhoods were representative of Flint as a whole.
Although this knowledge did not influence my site selection process, it did provide me with context as I traveled to those neighborhoods to collect my observational and survey data. Also, being already familiar with the geography I was free from the effects of culture shock while going door-to-door within the neighborhoods. I believe this made my interactions with participants more natural, especially when first approaching them.
Insider knowledge can also be considered a disadvantage. My familiarity with the environment could lead to a loss of objectivity, particularly while conducting neighborhood observation. There is the increased risk that I would make assumptions during my observation based on prior knowledge of a neighborhood. I hoped to ameliorate this risk with my decision to utilize a systematic social observation method. By following specific and standardized
procedures my intention was to distance myself from my data and prevent any prior assumptions from affecting my observations.
my own beliefs into the research and the data analysis, I believe that insider research has its advantages. Outsider research comes with its own biases where the researcher may consciously or unconsciously hold preconceived, potentially incorrect assumptions about a social group or location. In fact, I believe that due to Flint’s reputation, an outside researcher’s preconceived
assumptions would have greatly biased the research.
The Study Area
According to the Uniform Crime Report, in 2010 Flint had a violent crime rate of 2,200 per 100,000 residents (Federal Bureau of Investigation, 2010). However, in 2014 this rate had fallen to 1,700 per 100,000 residents (Federal Bureau of Investigation, 2014). These data would suggest that Flint’s violent crime rate is on the decline, however public perceptions about the city
are not changing. The concern here is that if actual crime rates are decreasing, yet fear of crime and perceived risk of victimization remain high, residents will continue to withdraw from the community, leaving public spaces open for future disorder and possibly crime. If steps are not taken to change residents’ perceptions, residents will continue withdrawing from the city, fear of crime will remain high and crime rates have the potential to rise again (Liska et al. 1988;
Markowitz et al. 2001; Rengifo and Bolton 2012).
Site Selection Process
The United States Census Bureau divides geographies into census tracts to create
statistical subdivisions of a county in order to provide stable geographic units for the purpose of collecting statistical data. These tracts are then divided into block groups, which generally contain between 600 and 3,000 people and are clusters of contiguous blocks within the same tract (United States Census Bureau, 2010). Finally, the Census Bureau divides block groups into census blocks, which are what one would typically think of when considering a city block bounded on all sides by streets. There are 41 census tracts either partially or wholly in the city of Flint. Using 2010 census data, I collected information on the following characteristics for all 41 tracts: unemployment, income, and educational attainment of residents. Previous studies have found these characteristics are correlated with disorder (Christie-Mizell, Steelman, and Stewart, 2003; Markowitz et al. 2001; Covington and Taylor, 1991).
resident was sampled to be a survey respondent. The final sample size was 125 respondents living within 19 city blocks.
Data Sources
The theoretical framework of this study requires an analysis of individual perceptions of disorder across multiple neighborhoods within the city of Flint, as well as independent, objective assessments of disorder. To achieve this I have drawn data from three different sources: census data, a neighborhood survey, and systematic social observation. Ideally, this study would have drawn from a fourth source—crime data. However, the Uniform Crime Report (UCR) does not collect crime statistics at either the census tract or block level. Police records were also
unavailable at this level through the Flint City Police Department.
Census Data. Utilizing 2010 census data at the block-group level, I conducted a comparative analysis to ensure that the sample was representative of the city of Flint and that the blocks were comparable geographic units for the following theoretically relevant measures: population size, geographic size, population density, racial composition, median income, educational attainment, and unemployment rate.
Neighborhood Survey. The first source of data comes from a face-to-face neighborhood survey conducted in September 2015 to January 2016 (see Appendix D). I distributed the survey within the city blocks by going door-to-door within the hours of 9am and 5pm. The respondents
collected demographic data on gender, race and age of the respondent. I knocked on a total of 552 house doors. Of the 552, 189 residents were home and of those 189, 125 residents agreed to be survey respondents. Thus, the response rate was 66%.
Systematic Social Observation. The observation of humans, including both behavior and setting, is referred to as social observation. Social observation becomes systematic when, according to Reiss (1971), the observation follows specific procedures that allow for replication and permit the logic of scientific inference. Systematic social observation (SSO) is a standardized method that allows a researcher to directly observe the physical and social characteristics of a
neighborhood, one block at a time. The benefit of SSO is that rather than relying on respondents’ retrospective and subjective observations of their environment, a researcher is able to connect directly to the behaviors and settings of empirical interest.
Mimicking a method employed by Sampson and Raudenbush, the geographic unit of recorded observation within the sampled block was the face block, which is a “block segment on one side of a street” (1999:616). Buildings or structures located on the other side of the street
(across the street from the one being measured on any given city block) were also included in the block face, although representing a different geographic unit of measurement. To observe each block face, I traveled to the block and, using a crafted systematic social observation coding sheet (see Appendix E), documented the social activities and physical features of the block. I
To measure signs of physical disorder I coded the following characteristics on a 0-3 scale: trash or litter in the streets, on sidewalks or on lawns; graffiti on walls or sidewalks; vacant or boarded up houses; vacant or boarded up businesses; broken out windows of property;
apparent fire damage; broken out windows of cars; and abandoned cars. If a block had no signs whatsoever of a specific characteristic, a 0 was noted under that category on the SSO coding sheet. If a block contained 1 item of a specific characteristic, a 1 was noted under that category. If a block contained 2-3 items of a specific characteristic, a 2 was noted under that category. Finally, if a block contained more than 3 items of a specific characteristic, a 3 was noted under that category on the coding sheet.
The “trash or litter” category was an exception to this coding method because litter has a
different threshold than say, a vacant house. One piece of litter found on a block will not produce the same emotional or cognitive response as one vacant or boarded up house on a block.
To measure signs of social disorder I coded the following characteristics on a 0-3 scale: loud music coming from houses; loud music coming from cars, neighbors talking or yelling loudly; people hanging out in the streets or on street corners; public drunks; illicit drug use in public; stray dogs or cats; prostitution; and panhandlers or beggars. (0=none, 1=minimal, 2=moderate, 3=high levels of physical/social disorder.) Social disorder was coded in the same manner as physical disorder was, with the exception of the trash and litter category.
Analytic Strategy
The analysis focuses on the following first-order questions: Are people who see more signs of disorder in their neighborhoods generally more fearful of crime? Are people who live in
neighborhoods that objectively have more signs of disorder generally more fearful of crime? Are
people who express more fear of crime also more likely to change their behavior, such as not
going out alone after dark, avoiding certain areas, limiting their time spent away from home, or
limiting other activities? The analysis also addresses two secondary research questions: are
resident perceptions of disorder correlated with objective ratings of disorder? Also, is having either the cognitive component of fear (i.e. expecting that you are more vulnerable to being victimized) or the emotional component (i.e. feeling scared about crime even though you take
many protective measures to lower your subjective sense of risk) enough to make people change
their behaviors, or is behavioral change much more likely when people have both?
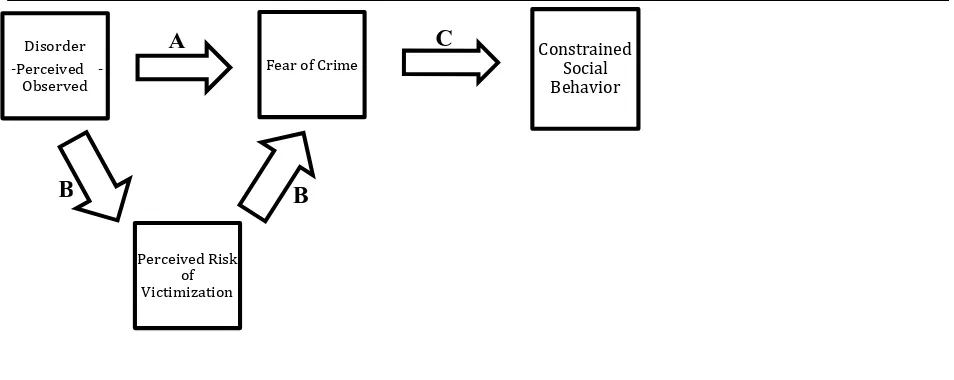
link between perceptions of disorder and fear of crime (pathway A in figure 1). In this model I also include observed disorder3 as a predictor variable to address the question of whether
perceived disorder or observed disorder is a better predictor of fear of crime. Next, as a test of the Risk Interpretation Model (Ferraro, 1995), I present a model that introduces perceived risk of victimization as a predictor of fear of crime, controlling for sex, age, and race. This model tests the hypothesis that perceived risk of victimization is a mediating variable in the relationship perception of disorder and fear of crime (pathway B in figure 1).
The second stage focuses specifically on the pathway C (figure 1). I estimate a series of logistic and ordered logistic regression models to explore predictors of constrained social behavior, using four factors to measure constrained social behavior. This series of models tests the hypothesis that fear of crime would be a predictor of constrained social behavior. The first series of models predicts the frequency of going out after dark, the second series predicts the amount of time residents spend away from home, the third series predicts the probability of residents changing or limiting their behavior and the fourth series of models predicts the probability of residents avoiding certain areas of the city. All four series of models use fear of crime as a predictor of constrained social behavior, next adding perceptions of risk, and then controlling for observed disorder, perceived disorder, and sex, age, and race.
I was also interested in whether having either high levels of fear of crime or risk
perception was enough for residents to report changing their behaviors, or if residents were more likely to change their behaviors when they expressed high levels of both fear of crime and perceived risk. Thus the third and final stage of analysis combines measures of fear of crime and
3 Originally I intended to estimate all of the models with tract-level fixed effects however I was not able to include them in the
perceived risk of victimization (using risk/fear typology scales which are described in greater detail in the Study Variables section) to test how their interaction is associated with constrained social behavior. The final series of models estimates ordinal logistic and logistic regression using the combined fear of crime and perceived risk typologies as predictors to examine the link between fear and risk, and the four factors contributing to the social behavior variable (frequency of going out after dark, amount of time spent away from home, changing or limiting activities, and avoiding certain areas of the city). All analyses were conducted using Stata/SE 14.0 (StataCorp 2016).
Figure. 1: Visual Representation of Analytic Strategy*
*The arrows are not meant to represent causality or suggest a causal effect, they are meant only to represent the path the analysis will take
Study Variables
Fear of Crime. I used a scale of fear of crime (based on multiple survey questions) as the dependent variable in this study. Fear of crime is the affective dimension of crime, which is the emotionally based response to crime (Ferraro 1995; Abdullah et al. 2014). This measure of fear
Disorder Perceived
-Observed
Perceived Risk of Victimization
Fear of Crime Constrained Social
Behavior A
B B
of crime is considered an improvement upon previous measures, which combined the emotional response to crime with the cognitive assessment of crime under one variable “fear of crime” (Ferraro 1995; Gainey et al. 2010; Rengifo and Bolton 2012; Abdullah et al. 2014) This study captures both measurements as distinct variables (fear of crime, and perceived risk) by using separate survey questions.
Fear of crime was measured with the following survey questions. Respondents were asked: “How afraid are you of…” a) “walking alone after dark” b) “being robbed on the street” c) “being approached by a beggar or panhandler” d) “someone breaking in while you are at home” e) “someone breaking in while you are away” f) “being sexually assaulted” g) “being attacked in public with a weapon” h) “having your car stolen” i) “having your property damaged by vandals” and j) “being murdered” Response categories were: “not afraid at all” (1), “slightly afraid” (2), “neutral” (3), “moderately afraid” (4) and “very afraid” (5).
Perceived Risk of Victimization. I used a scale of perceived risk of victimization (based on multiple survey questions) as an independent variable in this study. This is a respondent’s cognitive assessment of their risk of being victimized by a crime (Ferraro 1995). The response categories and coding methods for perceived risk are the same as those used for fear of crime. However, the survey question for perceived risk asks instead, “how likely do you think it is that you will…” a) “be bothered while walking alone after dark” b) “be robbed on the street” c) “be approached by a beggar or panhandler” d) “have someone break in while you are home” e) “have
someone break in while you are away” f) “be sexually assaulted” g) “be attacked in public with a weapon” h) “have your car stolen” i) “have your property damaged by vandals” j) “be
murdered”. The crimes captured here range from minor to serious offenses and cover both
interpersonal crime and property crime.
The scale of perception of risk of victimization was also generated for the analysis using 8 items (bothered after dark, robbed, break in-home, break in-away, attacked with weapon, car theft, vandals, murder). These items are similar to the 8 items that make up the fear of crime scale, however, the perceived risk scale measures how likely respondents think it is that they will be victims of the above events, rather than how much they fear those items. Each item was measured across five response categories: very unlikely, unlikely, neutral, somewhat likely, and very likely. The perception of risk scale was generated using the sum of the 8 individual
unstandardized item scores and had a 0.92 reliability coefficient. Each item contributes roughly equally to the scale.
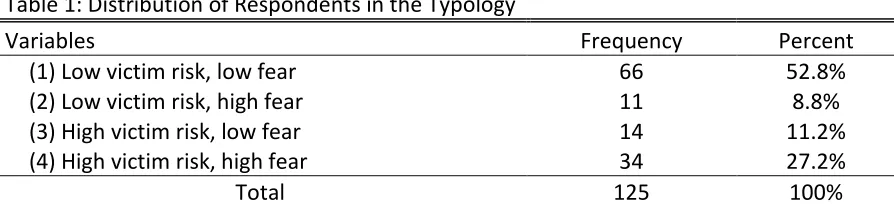
assessing how those combined variables were linked to constrained social behavior. Would combining measures of fear of risk of victimization be a better predictor of changed behavior, or would having either fear or perceived risk be enough for people to change their behavior? In order to measure this interaction I generated risk/fear typology scales using the fear of crime and perceived risk 5-point scales crafted from the survey data. There were four possible categories a respondent could fit into: (1) low perceived risk, low fear; (2) low perceived risk, high fear; (3) high perceived risk, low fear; (4) high perceived risk, high fear. If the value for the fear scale was less than 3, the respondent was sorted into the low fear category. If the value was equal to, or greater than 3 the respondent was sorted into the high fear category. The same standard was used to sort respondents into high/low perceived risk categories. I chose 3 as the cutoff because in the 5-point scale 3 represented a meaningful category of “neutral” with the respondents given the following response categories to questions about fear of crime: not afraid at all, slightly afraid, neutral, moderately afraid, and very afraid. The same standard was used to sort respondents into high/low perceived risk categories, using 3 (on a 5-point scale) as a cutoff. Table 1 presents the distribution of respondents in the four typologies.
[image:32.612.86.533.521.628.2]Perception of Disorder. Perception of disorder is also an independent variable in this study. Survey questions corresponding with this variable capture how residents interpret disorder in
Table 1: Distribution of Respondents in the Typology
Variables Frequency Percent
(1) Low victim risk, low fear 66 52.8%
(2) Low victim risk, high fear 11 8.8%
(3) High victim risk, low fear 14 11.2%
(4) High victim risk, high fear 34 27.2%
their neighborhood. Perception of disorder was measured with the following survey questions. The survey asked respondents, “how great a problem is…” a) “trash and litter lying around your neighborhood” 2) “graffiti on walls or on sidewalks” 3) “vacant or boarded up houses” 4) “signs of vandalism” 5) “abandoned cars” 6) “noisy or disruptive neighbors” 7) “people hanging out in the streets or on street corners” 8) “public drinking or intoxication” 9) “stray dogs or cats” 10) “panhandlers or beggars”. Response categories were: “not a problem at all” (1), “a mild problem” (2), “neutral” (3), “a moderately big problem” (4) and “very problematic” (5). These
ten measurements were intended to capture both social and physical disorder.
Previous studies have disaggregated perceptions of neighborhood disorder by type and found that two types of disorder are represented: social and physical disorder (Sampson and Raudenbush, 2004; LaGrange et al., 1992; Skogan, 1990). Thus when generating the perception of neighborhood disorder scale I expected the ten items (litter, graffiti, vacant houses, vandalism, abandoned cars, noisy neighbors, people hanging out, public intoxication, strays, and beggars) to represent two separate components of disorder—social disorder and physical disorder. The items emerged on two separate scales largely as hypothesized. Among the items to load on the physical dimension were: trash and litter, vacant houses, vandalism, and abandoned cars. Among the items to load on the social dimension were: noisy neighbors, people in streets, public intoxication, strays, and beggars.
potential cue to gang activity. Because of this, I decided to include graffiti in the social disorder scale.
The physical disorder scale consisted of the 4 above-mentioned items and had an alpha score of 0.86, and the social disorder scale, which consisted of the above stated 6 items
(including graffiti) had an alpha score of 0.88. However, because there were high inter-correlations between the two scales, and because there was more scale reliability when combining the two measures, I used the combined perception of disorder scale (with all ten items) in the final analysis. The combined perception of disorder scale used the unstandardized values of the ten above stated items and had an alpha score of 0.93.
Observed Disorder. Observed disorder was another independent variable in this study that was measured by systematic social observation using the previously discussed coding method. This variable was intended to capture both physical and social conditions of the city block in an objective, rather than subjective manner. Information on the following items of disorder was recorded: trash or litter in the streets, on sidewalks or on lawns; vacant or boarded up houses; vacant or boarded up businesses; graffiti on walls or sidewalks; broken out windows of property or cars; people hanging out in the streets or on street corners; illicit drug use in public; stray dogs or cats; apparent fire damage; graffiti on sidewalks; broken out windows of cars; abandoned cars; neighbors talking or yelling loudly; public drunks; prostitution; panhandlers or beggars; loud music coming from cars; and loud music coming from houses.
separate scales for the final analysis. The observed physical disorder scale included both
measures of trash and litter, vacant houses, boarded up houses, vacant or boarded up businesses, and broken out windows of property. The items were standardized and averaged, with an alpha score of 0.75. The observed social disorder scale included both measures of graffiti, individuals publically intoxicated, illicit drug use, and prostitution. Those items were standardized and averaged with an alpha of 0.81. The following items were not included in the analysis due to lack of observations or low inter-item correlation with the scales: panhandlers or beggars, loud music from cars, loud music from houses, abandoned cars and fire damage.
Constrained Social Behavior. Constrained social behavior was another dependent variable in this study. Constrained social behavior is a response to fear of crime that involves modification of public activity space. This variable was measured using the following questions. The survey asked respondents, “in general, have you limited or changed your activities in the past year because of crime?” (1= yes, 0=no). “In general, have you avoided certain areas of the city because of crime?” (1=yes, 0=no). “How often do you go out after dark for entertainment, such
as to restaurants, theaters, bars etc. within the city?” (1= less than once a month, 2= once a month, 3= 2-3 times a month, 4= once a week, 5= 2-3 times a week, 6=daily) and “How many hours during the day do you spend away from home NOT INCLUDING work or school-related activities?” (1=none, 2=1-2 hours, 3= 3-4 hours, 4= 5-6 hours, 5= 7 or more hours).
Demographics. The following demographics were included in the analysis: gender (1=male, 2=female, 3=other), race (1= African American, 2=Asian/Pacific Islander, 3=Caucasian,
55-64, 5= 65 or older). However, in the analysis the “other” category was removed because of lack of responses, and male and female were recoded 0 and 1 respectively (with male serving as the dummy variable). Also, because of the limited number of respondents who fit the “Asian/pacific islander”, “Hispanic/Latino”, “native American” or “other” categories for the race variable, these were summed in an “other” category and the race variable was recoded as 1=African American,
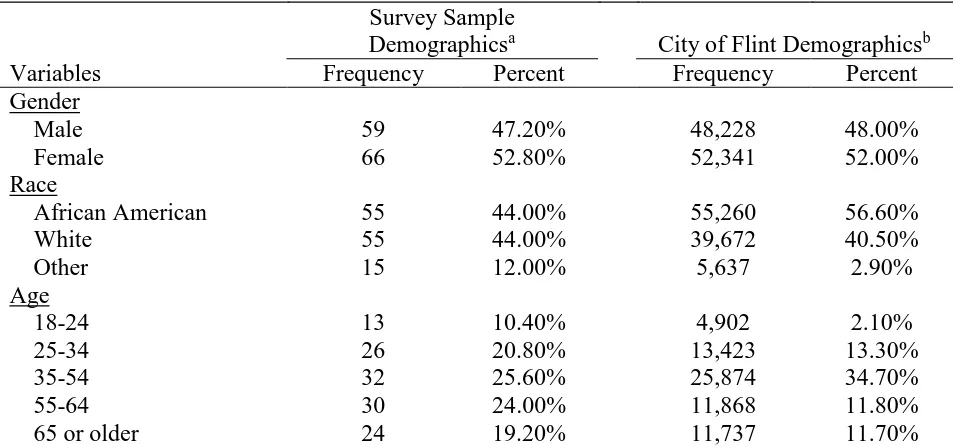
[image:36.612.72.552.335.558.2]2= White and 3=Other. These demographic variables served as control variables to allow the other variables of this study to be better understood. Demographic statistics are presented in Table 1 to illustrate the representativeness of the sample in relation to the population of Flint.
Table 2: Demographics of Respondents in Study
Survey Sample
Demographicsa City of Flint Demographicsb
Variables Frequency Percent Frequency Percent
Gender
Male 59 47.20% 48,228 48.00%
Female 66 52.80% 52,341 52.00%
Race
African American 55 44.00% 55,260 56.60%
White 55 44.00% 39,672 40.50%
Other 15 12.00% 5,637 2.90%
Age
18-24 13 10.40% 4,902 2.10%
25-34 26 20.80% 13,423 13.30%
35-54 32 25.60% 25,874 34.70%
55-64 30 24.00% 11,868 11.80%
65 or older 24 19.20% 11,737 11.70%
aData taken from the Neighborhood Incivilities: Effects of Disorder on Fear of Crime Survey(2015-2016) bData taken from 2010 census
Sample Description
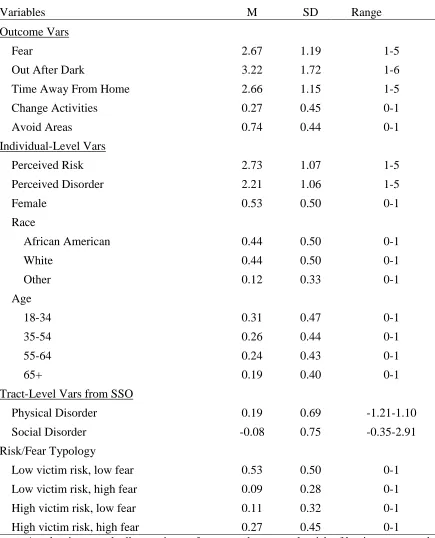
Table 2 presents descriptive statistics for all variables used in this study. Survey
that they were moderately or very afraid of being sexually assaulted, whereas 57.6% reported that that they were not at all afraid of having this happen. However, the fear of being sexually assaulted is likely to vary by gender, and in fact it was positively correlated (p= .425) with female gender. Thus the low average levels of fear for that item could be hiding gender
differences. However there were other items, such as being approach by a beggar or panhandler, which did not have high levels of fear associated with them. 46.34% of respondents reported they were not at all afraid of being approached by a beggar or panhandler. Conversely, certain items had higher levels of fear associated with them than others. For example, 41.13% of respondents expressed that they were either moderately or very afraid of having someone break in while they were away from home.
Survey responses for residents’ perceptions of risk of victimization follow a similar
distribution as their fear of crime, with a scaled mean of 2.73. Notably, across all ten items, respondents perceived they were at the greatest risk of being approached by a beggar or panhandler. 56.45% of respondents reported that they believed they were somewhat or very likely to be approached by a beggar or panhandler. Interestingly, this is also the item least feared by respondents. It is unsurprising that residents would perceive this to be a high-risk item given that homelessness4 is a large problem for the city of Flint. Consequently it is reasonable that
respondents would perceive themselves to be at high-risk of being approached by a beggar, yet not be fearful of its occurrence because it is not a particularly threatening item in comparison to the other items asked about.
4 This is unsurprising, given the aforementioned fact that on October 20th, 2014 an ordinance was passed by the Flint Township
Board in response to the panhandling and homelessness problem. See
Another item markedly worrisome for respondents was the risk of having someone break into their house while away from home. 47.2% of respondents expressed that this was either somewhat or very likely to occur, similar to the 41.13% of respondents who expressed high levels of fear for this item. This is consistent with expectations, considering that fear of crime and perceived risk are strongly positively correlated (r=.68). Respondents expressed the lowest
Variables M SD Range
Outcome Vars
Fear 2.67 1.19 1-5
Out After Dark 3.22 1.72 1-6
Time Away From Home 2.66 1.15 1-5
Change Activities 0.27 0.45 0-1
Avoid Areas 0.74 0.44 0-1
Individual-Level Vars
Perceived Risk 2.73 1.07 1-5
Perceived Disorder 2.21 1.06 1-5
Female 0.53 0.50 0-1
Race
African American 0.44 0.50 0-1
White 0.44 0.50 0-1
Other 0.12 0.33 0-1
Age
18-34 0.31 0.47 0-1
35-54 0.26 0.44 0-1
55-64 0.24 0.43 0-1
65+ 0.19 0.40 0-1
Tract-Level Vars from SSO
Physical Disorder 0.19 0.69 -1.21-1.10
Social Disorder -0.08 0.75 -0.35-2.91
Risk/Fear Typology
Low victim risk, low fear 0.53 0.50 0-1
Low victim risk, high fear 0.09 0.28 0-1
High victim risk, low fear 0.11 0.32 0-1
[image:38.612.82.517.59.597.2]levels of perceived risk of being sexually assaulted, with only 13% of respondents expressing that it was somewhat or very likely, and 48% responding that it was very unlikely. Again, these low levels of perceived risk could be attributed to gender differences, and provide further justification for dropping this item from the analysis.
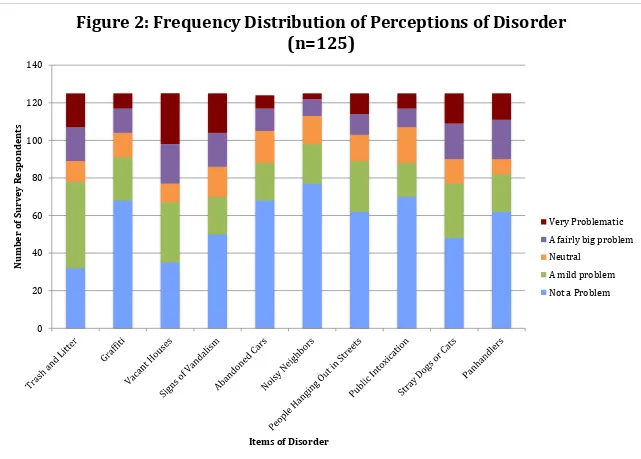
Next I turn to a discussion of the measures of disorder, first examining perceptions of disorder. The frequency distribution of perceptions of disorder for all 10 items measured in the survey is presented in Figure 2. The majority of respondents indicated that they did not perceive disorder to be much of a problem in their neighborhoods. Out of the ten items of disorder I asked about, the majority of respondents answered “not a problem at all” for all of the items except the trash and litter item. Even then the majority answered “a mild problem” rather than one of the
higher categories. Nonetheless, there were still a substantial number of respondents who reported that disorder was a problem in their neighborhood. For example, although the majority of
respondents (40%) answered that signs of vandalism were “not a problem” in their
neighborhood, the overall scale mean (2.21) suggests that there is significant enough variation in the responses for meaningful analysis.
systematic social observation, where I found more signs of physical disorder than social disorder overall.
Next looking at observed disorder, which was measured using the systematic social observation (SSO) data, the following were the observed frequencies of disorder for all 19 blocks combined in declining order: trash or litter in the streets (11), on sidewalks (8) or on lawns (8); vacant or boarded up houses (6); vacant or boarded up businesses (6); graffiti on walls (4); broken out windows of property (3); people hanging out in the streets or on street corners (3); illicit drug use in public (2); stray dogs or cats (2); apparent fire damage (2); graffiti on sidewalks (1); broken out windows of cars (1); abandoned cars; neighbors talking or yelling loudly (1); public drunks (1); prostitution (1); and panhandlers or beggars (0); loud music coming from cars (0); loud music coming from houses (0).
0 20 40 60 80 100 120 140
N
u
mber
of
S
u
rvey
Resp
on
d
ent
s
[image:41.792.73.714.69.528.2]Items of Disorder
Figure 2: Frequency Distribution of Perceptions of Disorder
(n=125)
Very Problematic A fairly big problem Neutral
RESULTS Predicting Fear of Crime
Table 4 presents coefficients and standard errors for key predictors from regression models of fear of crime. Model 1 is a baseline model that predicts fear of crime using observed disorder and perceived disorder. Model 2 adds gender, race and age. Model 3 further adds
perceived risk, to assess the extent to which it mediates the association between disorder and fear of crime.
Results for Model 1 show that perceived disorder was a statistically significant positive predictor of fear of crime, such that those who reported higher levels of perceived disorder also reported higher fear of crime. After additional adjustments were made for gender, age and race in Model 2 perceived disorder remained significant. Results for Model 2 also show that gender is a statistically significant positive predictor of fear of crime, such that female respondents
expressed higher levels of fear of crime. This finding is consistent with prior research, which has shown that females are more fearful of crime (Gainey et al., 2010). Model 4 adjusts for
perception of risk and in this model gender remained statistically significant, though less significant than in model 2. However, the association between perceived disorder and fear of crime is altered. After adjusting for perceived risk, the disorder coefficient was reduced in
*** p<.001, ** p<.01, * p<.05
interpretation model and illustrate the importance of examining fear of crime as two separate components: emotional (fear) and cognitive (risk assessment).
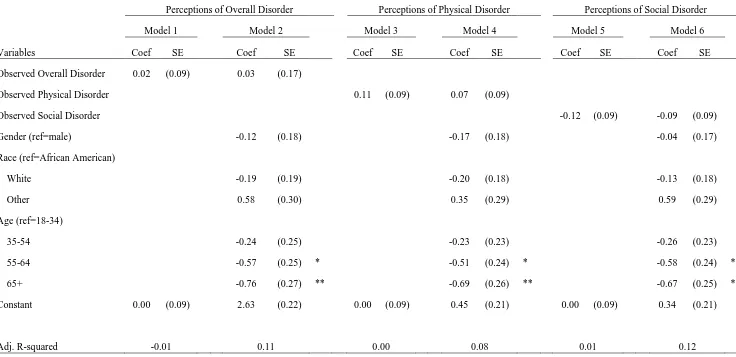
To further analyze the relationship between observed and perceived disorder I ran a series of regression models using observed disorder to predict perceived disorder. In Table 5, Model 1 predicts overall perceptions of disorder using overall observed disorder. Model 2 adjusts for gender, race and age. Model 3 predicts perceptions of physical disorder using observed physical disorder. Model 4 adds gender, race and age to model 3. Model 5 predicts perceptions of social disorder using observed social disorder. Model 6 adds gender, race and age to model 5.
Observed disorder was not a significant predictor of perceived disorder across any of the models presented in Table 5. In models 2, 4, and 6 the age groups 55-64 and 65+ were
significant positive predictors of perceptions of disorder. These results are interesting since previous studies found that older residents perceived less disorder than younger residents
(Sampson and Raudenbush 2004). Yet the question of how age affects perceptions of disorder is outside the scope of this study, thus I suggest future studies investigate this topic further.
Measurements of overall observed disorder were not strongly positively correlated with measurements of overall perceived disorder. A Pearson correlation of r= .02 was estimated between overall observed and perceived disorder. When examining the correlation between physical and social disorder independently, a Pearson correlation of r= .11 emerged between observed and perceived physical factors of disorder, and a Pearson correlation of r= -.12 emerged between observed and perceived social factors of disorder. These results differ from many previous findings in which observed disorder predicts perceived disorder (Sampson and Raudenbush 1999; Skogan 1986; Lewis and Maxfield 1980). Instead these findings are more aligned with Perkins (1993) who found that observed disorder was not predictive of perceived disorder, neither were the two strongly correlated, though they were weakly positively
Table 5: Regression Models Predicting Perceptions of Disorder
Perceptions of Overall Disorder Perceptions of Physical Disorder Perceptions of Social Disorder
Model 1 Model 2 Model 3 Model 4 Model 5 Model 6
Variables Coef SE Coef SE Coef SE Coef SE Coef SE Coef SE
Observed Overall Disorder 0.02 (0.09) 0.03 (0.17)
Observed Physical Disorder 0.11 (0.09) 0.07 (0.09)
Observed Social Disorder -0.12 (0.09) -0.09 (0.09)
Gender (ref=male) -0.12 (0.18) -0.17 (0.18) -0.04 (0.17)
Race (ref=African American)
White -0.19 (0.19) -0.20 (0.18) -0.13 (0.18)
Other 0.58 (0.30) 0.35 (0.29) 0.59 (0.29)
Age (ref=18-34)
35-54 -0.24 (0.25) -0.23 (0.23) -0.26 (0.23)
55-64 -0.57 (0.25) * -0.51 (0.24) * -0.58 (0.24) *
65+ -0.76 (0.27) ** -0.69 (0.26) ** -0.67 (0.25) **
Constant 0.00 (0.09) 2.63 (0.22) 0.00 (0.09) 0.45 (0.21) 0.00 (0.09) 0.34 (0.21)
Adj. R-squared -0.01 0.11 0.00 0.08 0.01 0.12
*** p<.001, ** p<.01, * p<.05
Surprisingly observed disorder and perceived disorder are not strongly correlated, and even more surprisingly observed social disorder and perceived social disorder are negatively correlated. A likely explanation is that because indicators of social disorder are more temporally relative than indicators of physical disorder it is more difficult to capture the presence of social disorder during a precise moment in time than to capture physical disorder. For example, it is much easier to observe a vacant house that has likely been present for days, months or even years, than to observe the precise moment that an individual is engaging in illicit drug use. It is likely that because my observations were all made during daylight hours during a single visit that signs of social disorder were missed. Thus despite respondents perceiving social disorder to be a problem in their neighborhood, signs of social disorder being problematic are not reflected in the observed disorder measurement.
disorder affect different neighborhoods in different ways. Neighborhoods that are objectively high in disorder may not perceive high levels of disorder in their neighborhood because they are desensitized to it. Conversely, a few pieces of litter or trash in a neighborhood with otherwise no disorder is likely to be far more noticeable than in a neighborhood where trash is everywhere. Predicting Constrained Social Behavior
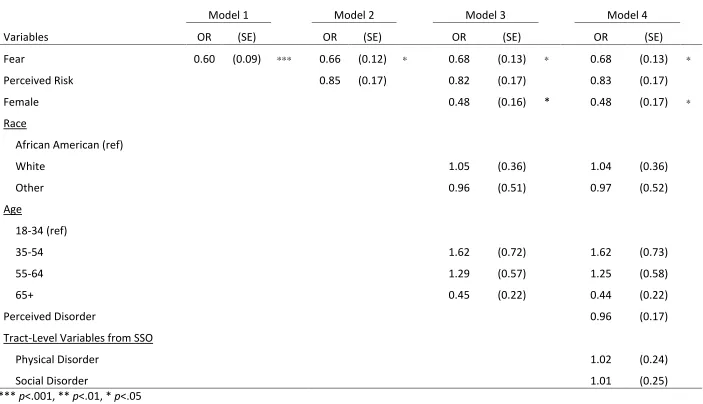
The next series of tables (Table 6-9) address the question: how does fear of crime influence residents’ movement and social behavior within the city?Table 6 presents odds ratios and standard errors for key predictors from ordered logistic regression models predicting the frequency of going out (e.g., to restaurants, theaters, bars) after dark. An ordered logistic regression model is used to handle the categorical nature of the outcome variable, which gave respondents the following response categories to the question about how often they go out after dark: less than once a month, once a month, 2-3 times a month, once a week, 2-3 times a week, or daily. The ordered logistic model assumes that the levels of response have a natural ordering from low to high, but the distance between adjacent levels is unknown.
The odds ratios in Table 6 indicate how a one unit change in a given predictor variable changes the odds of going out after dark more frequently (i.e., the odds of giving a response in a higher category compared to the one below it). Model 1 is a baseline model that uses only fear of crime to predict the frequency of going out after dark. Model 2 adds perceived risk of being victimized. Model 3 further adds gender, race and age, and model 4 further adds perceived disorder and observed disorder (physical and social).
Table 6: Ordered Logistic Regression Models Predicting Going Out After Dark
Model 1 Model 2 Model 3 Model 4
Variables OR (SE) OR (SE) OR (SE) OR (SE)
Fear 0.60 (0.09) *** 0.66 (0.12) * 0.68 (0.13) * 0.68 (0.13) *
Perceived Risk 0.85 (0.17) 0.82 (0.17) 0.83 (0.17)
Female 0.48 (0.16) * 0.48 (0.17) *
Race
African American (ref)
White 1.05 (0.36) 1.04 (0.36)
Other 0.96 (0.51) 0.97 (0.52)
Age
18-34 (ref)
35-54 1.62 (0.72) 1.62 (0.73)
55-64 1.29 (0.57) 1.25 (0.58)
65+ 0.45 (0.22) 0.44 (0.22)
Perceived Disorder 0.96 (0.17)
Tract-Level Variables from SSO
Physical Disorder 1.02 (0.24)
Social Disorder 1.01 (0.25)
proportional odds of being in a higher category of going out after dark. Fear of crime remained statistically significant after adjusting for perceived risk in Model 2, though now at p < .05, and after adjusting for gender, race and age in Model 3 (now with an odds ratio of .68, a .02 increase from Model 2). Results in Model 3 also showed that for females there was a 52% decrease in the proportional odds of being in a higher category of going out after dark. Both of these predictors remained statistically significant (fear with an odds ratio of .68, and gender with an odds ratio of .48) after adjusting for perceived and observed disorder in Model 4. Thus the findings are consistent with the hypothesis that residents who express higher levels of fear of crime are less likely to report frequently going out after dark.
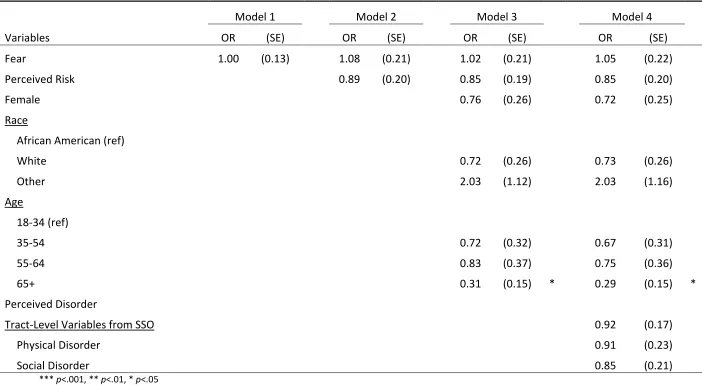
Table 7 presents odds ratios and standard errors for focal predictors from ordered logistic regression models predicting the amount of day-time hours residents spend away from home (not including work or school). An ordered logistic regression model is used to handle the categorical nature of the outcome variable, which offered respondents the following response categories to the question about how many hours a day they spend away from home: none, 1-2 hours, 3-4 hours, 5-6 hours, or 7 or more hours. The fear odds ratios in Model 1 indicates how a one unit increase in the fear of crime variable changes the odds of spending more hours away from home (i.e., the odds of giving a response in a higher category compared to the one below it). Model 2 adds perceived risk. Model 3 further adds gender, age and race and model 3 still further adds perceived and observed disorder.
Table 7: Ordered Logistic Regression Models Predicting Time Spent Away From Home
Model 1 Model 2 Model 3 Model 4
Variables OR (SE) OR (SE) OR (SE) OR (SE)
Fear 1.00 (0.13) 1.08 (0.21) 1.02 (0.21) 1.05 (0.22)
Perceived Risk 0.89 (0.20) 0.85 (0.19) 0.85 (0.20)
Female
0.76 (0.26) 0.72 (0.25)
Race
African American (ref)
White
0.72 (0.26) 0.73 (0.26)
Other
2.03 (1.12) 2.03 (1.16)
Age 18-34 (ref) 35-54
0.72 (0.32) 0.67 (0.31)
55-64
0.83 (0.37) 0.75 (0.36)
65+
0.31 (0.15) * 0.29 (0.15) *
Perceived Disorder
Tract-Level Variables from SSO
0.92 (0.17)
Physical Disorder
0.91 (0.23)
Social Disorder 0.85 (0.21)
a 69% decrease in the proportional odds of being in a higher category of hours spent away from home. After adjusting for perceived and observed disorder in Model 4 the age category of 65+ remained a significant predictor and its effect increased from 69% to 71%. Thus respondents age 65 or older were more likely to report spending less time away from home than respondents in the younger age categories.
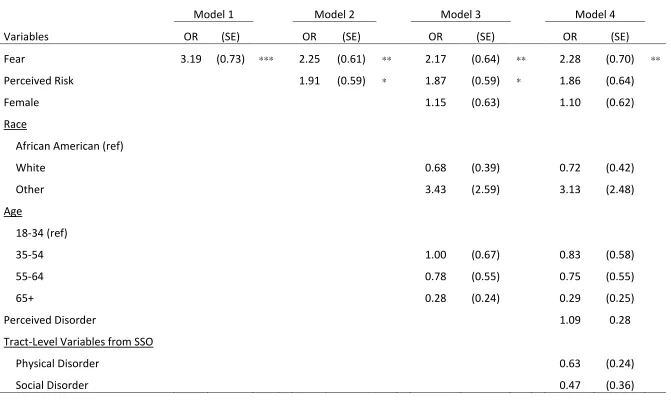
Table 8 presents odds ratios and standard errors for key predictors from logistic regression models predicting whether respondents limited or changed their activities because they worry about being victimized by crime. The outcome variable gave respondents the option of answering ‘yes’ or ‘no’ to the question of whether or not they have limited or changed their
activities (in the past year) because of worry about being a victim of a crime. The odds ratio associated with fear of crime in Model 1 indicates how a one unit increase in the fear of crime variable changes the odds of a respondent answering yes, that they have limited or changed their activities in the past year. Model 2 adds perceived risk to the baseline model. Model 3 further adds gender, age and race. Model 4 again adds perceived and observed disorder.
Table 8: Logistic Regression Models Predicting Changed Activity
Model 1 Model 2 Model 3 Model 4
Variables OR (SE) OR (SE) OR (SE) OR (SE)
Fear 3.19 (0.73) *** 2.25 (0.61) ** 2.17 (0.64) ** 2.28 (0.70) **
Perceived Risk 1.91 (0.59) * 1.87 (0.59) * 1.86 (0.64)
Female 1.15 (0.63) 1.10 (0.62)
Race
African American (ref)
White 0.68 (0.39) 0.72 (0.42)
Other 3.43 (2.59) 3.13 (2.48)
Age
18-34 (ref)
35-54 1.00 (0.67) 0.83 (0.58)
55-64 0.78 (0.55) 0.75 (0.55)
65+ 0.28 (0.24) 0.29 (0.25)
Perceived Disorder 1.09 0.28
Tract-Level Variables from SSO
Physical Disorder 0.63 (0.24)
Social Disorder 0.47 (0.36)