2018 International Conference on Computer, Communications and Mechatronics Engineering (CCME 2018) ISBN: 978-1-60595-611-4
The Effection of Whitecaps on the Parameters Measured by Altimeter
Jia-sheng TIAN
*and Jian SHI
School of Electronic Information and Communication, Huazhong University of Science and Technology, Wuhan, China
*Corresponding author
Keywords: Whitecaps, Altimeter, Electromagnetic scattering, Multilayer-media model.
Abstract. Under the impact of offshore rocks or high sea states such as typhoons, cyclone and so on,
the sea water breaks into foams or is spilled into the air and becomes droplets. These foams and droplets cover the sea surface, which will attenuate or even absorb the electromagnetic wave emitted by the altimeter, and will affect the altimeter's measurements such as the sea surface height(SSH), the significant wave height(SWH) and the sea surface backscattering coefficient0. In this paper, the effect of sea foams and droplets on parameters measured by altimeter: backscattering coefficient 0, SSH and SWH and so on, is studied by means of electromagnetic scattering theory analysis, numerical calculation and simulation. Some data and error correction tables of some parameters are given, which are beneficial to business error correction.
Introduction
Under the impact of offshore rock and land, or on high sea conditions such as typhoon and hurricane, the sea water breaks and sprays into the air to form the surface whitecaps (including foams and droplets)[1-3]. The white foams has a strong attenuation and absorption effect[4-5] on the electromagnetic wave emitted by the satellite radar altimeter (referred to as the altimeter) of detecting the Marine dynamic environment. As a result, parameters such as sea surface height, significant wave height and backscattering coefficient 0 measured by the altimeter are affected[4]. Both domestic and foreign scholars have studied the attenuation effect of foams on electromagnetic wave in details[6-9]. However, the effect of droplets and foams on sea surface height(SSH) and significant wave height(SWH) has not been fully studied, nor have the operationalized error correction tables been provided. In this paper, electromagnetic scattering theory and electromagnetic calculation method are used to calculate the attenuation characteristics of droplets and foams on the altimeter electromagnetic pulse. Secondly, the sea surface echo is simulated to analyze the influence of foams on the significant wave height measured by altimeter.
The Effect of Whitecaps
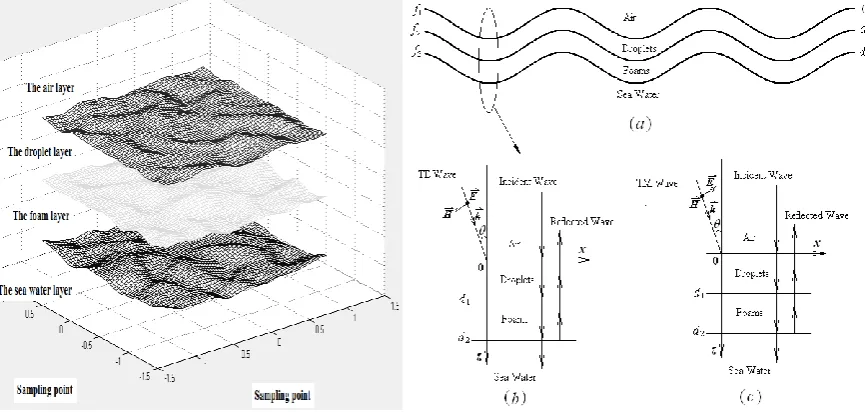
The Model of Whitecaps
surface model is mainly defined by sea spectrum, root mean square height and correlation length. In figure 1 the multi-layer rough surface model is about the gaussian distribution and has the same RMS and correlation length. it is also obvious that the mean square root height of rough sea surface increased with the increase of sea surface wind speed. On the contrary, as sea surface wind speed decreases, the root-mean-square height of rough sea surface decreases and the correlation length decreases. In order to simplify the calculation and workload, this paper mainly studies the electromagnetic scattering characteristics of one-dimensional multilayer rough surface model, as shown in figure 2. Figure 2(a) is a one-dimensional rough surface profile, Figure 2(b) and figure 2(c) are local electromagnetic incident reflection physical models.
Figure 1. Two-dimensional rough surfaces. Figure 2. One-dimensional rough surface profile.
The Calculation of Whitecaps
It is known that the sea surface coverage and thickness of the foam layer and droplet layer are mainly related to sea surface wind speed U10 (wind speed at 10m above sea level) in addition to the physical properties of sea water such as temperature and salinity[6]. There exists an empirical relationship between the thickness of foam layer d1 and the thickness of foam layer d2 [11-12]:
2 10 1 0.0075U
d (1)
s m U U s m U d / 7 0012 . 0 ) 7 ( 004 . 0 / 7 004 . 0 10 10 10
2 (2)
According to the electromagnetic scattering theory of layered medium[4,13], the total electromagnetic reflection coefficient R of the multilayer medium model shown in figure 2(b or c) can be given as
2 2 1 1 1 1 2 2
2 2 1 1 1 1 2 2
2 2 2 2
01 01 12 23 12 23
2 2 2 2
12 23 01 12 01 23
1
z z z z
z z z z
j k d j k d j k d j k d
j k d j k d j k d j k d
R R R R e R e R e
R
R R e R R e R R e (3)
where kzm2=km2-(k0sin)2, m=1,2. For the horizontal polarization(or TE) wave, the reflection
coefficient R is defined by the ratio of the reflected electric field intensityE0 to the incident electri
field intensityE0, namely RE0/E0 and
( 1) ( 1)
( 1)
( 1) ( 1)
1 / 1
m z m m z m m m
m zm m zm
k k
R
k k
where m=0,1,2. For the vertical polarization wave(or TM wave), the reflection coefficient R is defined by the ratio of the reflected magnetic field intensityH0 to the incident magnetic field
intensity 0
H , namely 0 / 0
R H H , and
( 1) ( 1)
( 1)
( 1) ( 1)
1 / 1
m z m m z m m m
m zm m zm
k k
R
k k (5)
where m=0,1,2. In terms of equation(3) the electromagnetic scattering characteristics of foams and droplets can be calculated and analyzed.
The Effect of Foams and Droplets on the Scattering of Rough Sea Surface
The generation of foams and droplets is mainly related to wind speed. The static sea surface with zero wind speed has no whitecaps covering. The electromagnetic wave (Ku band 13.9GHz) reflectivity (reflection coefficient square R2) can reach about 0.607 with no whitecaps covering the sea surface, as shown in Figure 3.When there exists only the foam layer, the reflectivity of the sea surface gradually decreases to about 0.0421 when the thickness of the foam layer increases to 5cm. The oscillations in its descending process are because the electromagnetic wave is absorbed by the foam layer. These foams can cause the sea surface backscattering coefficient0 to decrease about 11.5dB, resulting in blind spots for a radar .When the thickness of the foam layer is 5mm, the reflectivity of the sea surface will rapidly decay to 0.2 or so, and the sea surface backscattering coefficient 0will decrease about 4.7dB.
Therefore, the presence of foams greatly attenuates the electromagnetic pulse emitted by the altimeter and causes the backscattering from the sea surface to decrease. Thus when the sea surface wind speed is retrived by the backscattering coefficient of the sea surface, it will be overestimated, resulting in a larger error of the sea surface wind speed. This effect has been studied by some schoolars.
When the wind speed is greater than 7m/s , the thickness of the droplet layer will reach 0.37m according to empirical formula (1). At this time, the electromagnetic reflectivity of the sea surface will start decreasing and situate stably at 0.236 or so in the end, as shown in Figure 4 and 5. From figure 3 and 4, it is obvious that the droplet layer has a stronger reflection effect on the altimeter electromagnetic pulse (Ku band) than the foam layer, which has larger attenuation and absorption characteristics.
Since the droplets and foams have attenuation effect on the electromagnetic pulse of the altimeter, the measurements of the backscattering coefficient of the sea surface by altimeter will be affacted by them. The reflectivity of the sea surface decreases from 0.607 to 0.236, or even 0.0421 or zero, which can cause blind spots for the radar.
0 0.005 0.01 0.015 0.02 0.025 0.03 0.035 0.04 0.045 0.05 0 0.1 0.2 0.3 0.4 0.5 0.6 0.7
the thickness of foam /m
R e fl e c ti v it y
0 0.1 0.2 0.3 0.4 0.5 0.6 0.7 0.8
0 0.1 0.2 0.3 0.4 0.5 0.6 0.7
The thickness of droplets /m
R e fl e c ti v it y
[image:3.595.81.535.591.759.2]Frequency of the incident =13.9GHz
The Effect of Foams and Droplets on SSH and SWH
The reflectivity of the sea surface is 0.0421 or even 0 at ku band when foams cover the sea surface, while the reflectivity is 0.236 when foams and droplets cover the sea surface. This calculated result indicates that droplets not only have a larger effect of reflecting the electromagnetic pulses emitted by the satellite radar altimeter and but also reflect back the electromagnetic pulses early before they arrive at the sea surface or the foam layer due to the larger reflection effect. And thus the measured range from the satellite to the sea surface is the range from the satellite to the droplets. The sea surface height (SSH)will be overestimated because of the range. The measured SSH is in fact the height of the interface between the droplet layer, the foam layer and the sea water mixture. The order of the bias will be the same as the thickness of the droplet layer.
The foams cause the electromagnetic pulse of satellite radar altimeter attenuated to a great extent, especially the reflectivity of the sea surface to zero, and thus blind spots for the radar generate. When blind spots appear, the probability density function(pdf) of sea surface height appears zero, and the distribution characteristics of pdf are shown in figure 6. Therefore, the coverage of foams changes the probability density function of sea surface height, which distorts the echo waveform and thus affects the inversion value of significant wave height(SWH).
0 1 2 3 4 5 6 7 8 9 10
0 0.1 0.2 0.3 0.4 0.5 0.6 0.7 0.8
Wind speed m/s
T
h
e
t
h
ic
k
n
e
s
s
o
f
d
ro
p
le
ts
/m
Figure 5. The thickness of the droplet layer with wind speed. Figure 6. Pdf of Gaussian sea surface height.
In order to study the effect of foams on SWH, some calculations and simulations are planned as follows:
(1)Given the coverage of foams Ws, the PDF of Gaussian height distribution is modified according to the coverage as the same method as figure 6.
[image:4.595.111.539.306.476.2][image:4.595.87.513.543.752.2]
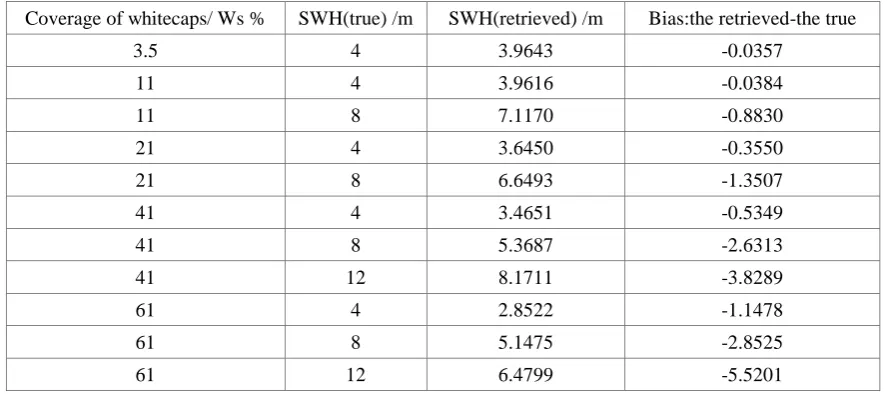
Table 1. The comparison of several SWH inversion values with true values.
Coverage of whitecaps/ Ws % SWH(true) /m SWH(retrieved) /m Bias:the retrieved-the true
3.5 4 3.9643 -0.0357
11 4 3.9616 -0.0384
11 8 7.1170 -0.8830
21 4 3.6450 -0.3550
21 8 6.6493 -1.3507
41 4 3.4651 -0.5349
41 8 5.3687 -2.6313
41 12 8.1711 -3.8289
61 4 2.8522 -1.1478
61 8 5.1475 -2.8525
61 12 6.4799 -5.5201
(2)Given the significant wave height(SWH)Hs which is consider to the true(real) value, the simulated echo waveform is calculated by using three terms’convolution: thef lat sea surface response, the point target response and the modified probability density function of sea height distribution.
(3)The simulation echo is fitted and calculated by using the ocean echo waveform model[14], and the SWH Hs' is retrieved. we can study the influence of foams on SWH inversion by obtaining the difference between Hs and Hs'.
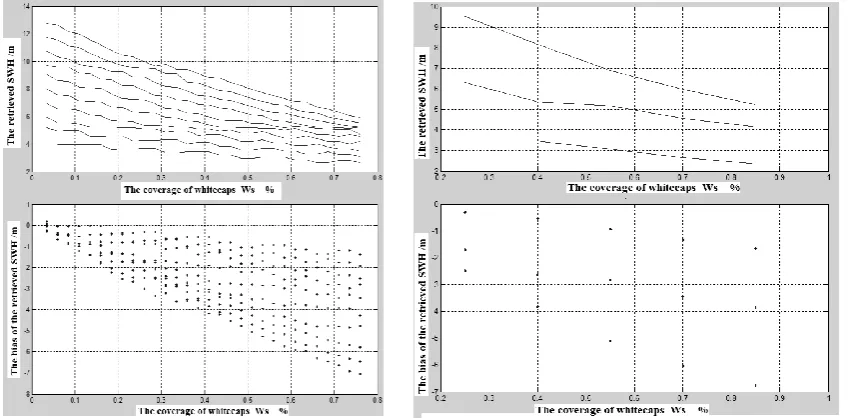
The results of calculations and simulations are shown in figure 7. Obviously, the coverage Ws of foams and SWH vary with the sea surface wind. When the wind speed is large, the foam coverage Ws and SWH are larger. The difference between the inversion value and the true value becomes very large when SWH and wind speed are getting larger. Moreover, the inversion value is smaller than the true value, and the error is related to SWH, as shown in table 1. Tabel 1 is a comparison of several typical values at several sea states.
Summary
In this paper, the effects of foams and droplets on sea surface parameters measured by satellite altimeter are studied.
(1) Under the impact of the coastal rocks, or under the high wind speed and high sea conditions, the air is involved in the sea water, and the sea water is thrown into the air to form the foam and droplet layer.
(2) the foam layer has a great attenuation effect on the electromagnetic pulse emitted by the altimeter, which makes the electromagnetic wave (Ku band) reflectivity rapidly decay from 0.6 to 0.2, even to 0.0421 or nearly 0, resulting in blind spots of the radar, which affects the measurement of the backscatter coefficient of the sea surface. The occurrence of the blind spot distorts the probability density function (pdf) of the sea surface height, and thus the probability density function distorts the echo of the sea surface, which results in a smaller value of the measurements of SWH.
(4) The effect of foams on SWH is simulated and calculated. The inversion value and the error are given at several different sea states. These data and corrections will give a help for the measurements by the radar altimeter.
Acknowledgement
This research was financially supported by the National Science Foundation(NO.41676090, NO.41376181).
References
[1] Dongliang Zhao, Yoshiaki Toba, Dependence of Whitecap Coverage on Wind and Wind-Wave Properties, Journal of Oceanography 57(5) (2001)603-616.
[2] Edward C. Monahan, OgnáidÓ Muircheartaigh, Optimal Power-Law Description of Oceanic Whitecap Coverage Dependence on Wind Speed, Journal of Physical Oceanography 10(12) (1980)2094-2099.
[3] J.-F. Filipot, F. Ardhuin, A unified spectral parameterization for wave breaking:from the deep ocean to the surf zone, Journal of Geophysical Research, C00J08 117(2012)1-19.
[4] RM Gairola, PC Pandey, The effect of whitecaps and foam on wind speed extraction with a pulse limited radar altimeter, Proceedings of the Indian Academy of Sciences, 95(2)(1986)265-273.
[5] Ferdinando Reale, Fabio Dentale, Eugenio Pugliese Carratelli, Numerical Simulation of Whitecaps and Foam Effects on Satellite Altimeter Response, Remote Sensing, 6(5) (2014):3681-3692.
[6] Magdalena D. Anguelova, Peter W. Gaiser, Dielectric and Radiative Properties of Sea Foam at Microwave Frequencies: Conceptual Understanding of Foam Emissivity, Remote Sens., 4(2012):1162-1189.
[7] Magdalena D. Anguelova,Peter W. Gaiser,Victor Raizer,Foam emissivity models for microwave observations of oceans from space,IEEE International Geoscience and Remote Sensing Symposium, 2(2009)II274-277.
[8] Rui Jiang, Peng Xu, Kun-Shan Chen, Saibun Tjuatja, Xiongbin Wu, Foam-Scattering Effects on Microwave Emission From Foam-Covered Ocean Surface, IEEE Geoscience and Remote Sensing Letters, 15(5) (2018)649-653.
[9] M. F. M. A. Albert, M. D. Anguelova, A. M. M. Manders, M. Schaap, G. de Leeuw, Parameterization of oceanic whitecap fraction based on satellite observations, 2017 IEEE International Geoscience and Remote Sensing Symposium (IGARSS), (2017) 732-734.
[10] Derek M. Burrage, Magdalena D. Angulelova, David W. Wang, Joel C. Wesson, Predicting L-Band Emissivity of a Wind-Roughened Sea with Foam Layers or Whitecaps and Overlying Spray,Using a Finite-Difference Time-Domain Model, IEEE 15th Specialist Meeting on Microwave Radiometry and Remote Sensing of the Environment, (2018)24-29.
[11] Wu J. Near-nadir microwave specular returns from the sea surface-altimeter algorithma for wind and wind stress, J.Phys. Oceanogr. 9(1992)659-667.
[13] JS. Tian, J Tong, J. Shi, L Gui, A new approximate fast method of computing the scattering from multilayer rough surfaces based on the Kirchhoff approximation, Radio Science, 52(2) (2017)186-193.