2018 International Conference on Computer, Communication and Network Technology (CCNT 2018) ISBN: 978-1-60595-561-2
Perceptual Hash Based Detection Algorithm for Image
Copy-Paste Tampering
Chun-bo MA, Xue-wei LV and Jun AO
*Guilin University of Electronic Technology, No. 1 Jinji Road, Qixing District, Guilin City, China
*Corresponding author
Keywords: Copy-Paste, Discrete wavelet transform (DWT), Perceptual hash algorithm (PHA), Main shift vector, Passive technology for image forensics.
Abstract. One of the most common modes of image attacking is copy-paste tampering. To overcome the disadvantages of slow speed and fragility in most existing regional tamper detection algorithms, a detection algorithm based on Perceptual Hash Algorithm (PHA) is proposed in this paper. In the aspect of feature extraction, the algorithm firstly carries out Discrete Wavelet Transform (DWT) on the test image and then selects the approximate sub-band to overlapping. Finally, the PHA is used to extract sub-block features and generate the feature matrix. In the patch matching phase, the first step is to find out the similar patches whose statistical displacement is larger than the threshold, and then obtains the main shift vector which satisfies the frequency of occurrence. Finally, the feature matching is performed according to the Hamming distance of similar patches. The experimental results demonstrated that the proposed algorithm can accurately detect the tampered region while ensuring fast computing speed and is robust to some common post-processing operations such as JPEG compression, Gaussian noise and Gaussian blur.
Introduction
In the age of information, images have become the main carrier for multimedia information and are used as the evidences in cyber-criminal and litigation cases. However, the integrity of images is extremely vulnerable due to their widespread dissemination and lack of effective protection on the Internet [1]. In addition, the potential for image content to be threatened is further exacerbated by the widespread use of low-cost, easy-to-use and some other powerful image editing software.
Image forgery is mainly divided into three categories: copy-paste, image splicing and image retouching, and the most common is copy-paste forgery. That is, part of the image is copied to another region that does not intersect with the original, to create a visual effect or cover up the image content. Since the texture and the statistical characteristics are highly similar in the same image, these images are more difficult to be detected. The active methods, such as digital watermarking and digital signature, are widely used in the field of image security. However, the practical applications of active methods are limited since sensitive message need to be preprocessed. Different from the active methods, the passive (blind) methods can accomplish image authenticity and source identification by feature extraction and matching. Without using any other information beside image itself, it can determine whether the image has been tampered according to the relevant features of the image content. That is why the passive methods have become a research hotspot in the field of image content security.
Related Works
Fourier-Mellin Transform (FMT) on the test image, it has strong robustness and can detect small rotation and scaling but with high computational complexity. Zhao et al. [5] proposed a detection method based on geometric means decomposition (GMD). One-dimensional feature was used to characterize each image block, which reduced the feature dimension effectively, but has poor robustness to noise.
Considering the shortcomings of current image copy-paste forgery detection algorithms, this paper presents a new detection algorithm. Firstly, use DWT to process the test image, select the approximation sub-bands and divide them into fixed-sized overlapping blocks, and then extract the “fingerprinting” of the sub-block by using PHA. Finally, the feature matching in performed. The experimental results illustrate that the algorithm can detect duplicated regions quickly and accurately.
Image Copy-Paste Forgery Detection Algorithm
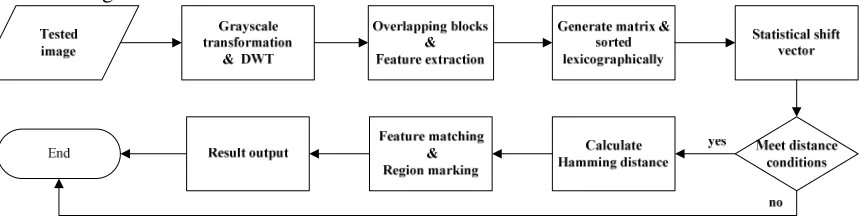
[image:2.612.97.527.295.404.2]The algorithm is divided into two parts: the feature extraction and matching. In the feature extraction, the PHA is used to extract features and generate characteristic matrix. The feature matching is mainly based on the shift vectors and Hamming distance of similar pair. The process is illustrated in Figure 1.
Figure 1. Algorithm flowchart.
Image Preprocessing
The first step is to convert the color image into grayscale by using the formula (1):
I=0.299×R+0.587×G+0.114×B. (1) R, G and B represent the three-color channels of the image respectively, and I denotes the grayscale image converted from the color one.
DWT and Overlapping Segmentation
Wavelet transform is very important in the field of digital image processing and is one of the essential techniques for image compression. The wavelet transforms mapping the strongly correlated spatial pixels into a completely uncorrelated and compactly distributed wavelet coefficient matrix, then a few coefficients can be used to describe the main energy components of the image. Divide the tested image of size M×N into four 1/4 original image size sub-images, and then select the approximate sub-bands of the low frequency, finally divide the sub-bands into K×K overlapping blocks from top left to bottom right in accordance with the line priority mode. Suppose the total number of sub-blocks is num, then:
(0.5 1)(0.5 1) num= M −K+ N−K+
. (2)
Feature Extraction
i. Size reducing: the image is reduced to 8×8 pixels, the purpose is to remove the details of the image, only leave the basic information such as contour, brightness, and reduce the difference besides the image itself.
ii. Simplify color: Convert the image of 8×8 pixels into 64 gray levels.
iii. Average calculating: Calculate the gray average of 64-pixels, denote it as aver.
iv. Gray value comparing: Denote the pixel gray value as I(x, y), where (x, y) is a coordinate. The I(x, y) can be expressed as follows.
1, ( , ) ( , )
0, ( , )
I x y aver
I x y
I x y aver
≥
=
<
. (3)
aver is the gray average of 64 pixels.
vi. Hash value calculating: Combine the results of the iv in a certain order to form the fingerprint whose length is 64 bits.
According to the definition of PHA, the two images are very similar if the different data bits between them are less than 5. If the different bits are larger than 10, means two different images. In this paper, we apply PHA to find out the duplicated regions of images, so we need to preserve the details of images as much as possible. Combined our demands, the algorithm has been improved as follows:
i. Size maintaining: Each 8×8 sub-block is remained to the next step without compression.
ii. Color maintaining: Keep the gray levels of overlapping sub-blocks and keep the details as much as possible.
iii. Normalization: Normalize before calculating the average to reduce the difference. iv. Step 4, step 5, step 6 are the same as step 3, step 4, step 5 of the above algorithm.
In this paper, a tested image is divided into overlapping blocks, with size 8×8, so the dimension q
of the feature vector is 64. The position of the fth sub-block represented by the vertex coordinates
of the top left corner is added to the end of the eigenvector Vf , shown as formula (4):
1 2, , , , 1, 2, , , (0.5 1)(0.5 1)
f f f fq f f
V =V ,V V x y ,f = … num num= M −K+ N−K+
. (4) num is the total number of sub-blocks.
Each Vf
is sorted as one row of the feature matrix-Data.The ‘f’ row of Data denotes the feature vector of ‘f’ sub-block.
1 2
[ T, T, , T ]T num
Data= V V V
. (5)
Feature Matching
After the matrix Data is sorted lexicographically in row, the vectors with high similarity are arranged in the adjacent positions. According to Luo et al.’s [6] study on a large number of natural images, it is difficult to find out two identical or similar regions in natural images with size larger than 0.85% of the image itself. We define Region of Interest (ROI)and calculated as follows:
0.85%
ROI≥ ×M ×N. (6) M, N are the width and height of the test image respectively.
This paper uses the Chebyshev distance to initially match similar sub-blocks. Chebyshev distance is a common metric in vector space, and Kang et al. [7] proposed an algorithm based on Singular Value Decomposition (SVD) also chose Chebyshev distance as the spatial measure. Assuming a pair of image blocks u and v, whose coordinates are (i, j) and (k, l) respectively. Because the duplicated
region doesn’t intersect with the original, the Chebyshev distance between u and vCuv should be
max ( ), ( ) ,
uv uv
C = abs i−k abs j−l C ≥ RIO
. (7)
Most references do not discuss the value of Cuv.Thispaper selects 30 copy-paste forgery images
from CASIA1 to obtain the statistical Chebyshevdistance to make the value of Cuv more
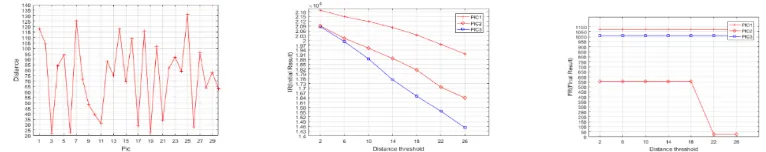
reasonable. The results are shown in Figure 2(a), and we can see that the distance is random. We randomly select three images, the initial matching result IR (Initial Result) only based on Chebyshev distance and the final matching result FR (Final Result) after adding the decision
conditions are as shown in Figure 2(b) and Figure 2(c) respectively with the change of Cuv. As can
be seen from Figure 2(b), IR decreases as Cuv increases. From Figure 2(c), it can be seen that if
the forgery is detected successfully, the FR keeps unchanged as Cuv increases. However, if the
value of Cuv is large, such as PIC2 in Figure 2(c), when the distance value is greater than 18, no
forgery can be detected and that means the detection fails. When the size of the image is 256×384,
uv C
=29 is calculated according to the formula (6), (7) and (8), and the output image size of DWT is 128×192. We combine the distance calculation formula and image analysis results, select 14 more reasonable.
[image:4.612.111.494.309.385.2]
Figure 2. Analysis results for (a) Chebyshev distance, (b) initial matching result and (c) final matching result.
The shift vector or displacement vector Mv of a pair of matching blocks is calculated as:
(
)
1 2 1 1 2 2
( , ) ,
v v v
M = m m = i − j i − j
. (8)
Where
(
i i1, 2)
and(
j1,j2)
are the position of two matching blocks mv1 and mv2 respectively.The displacement vectors -Mv and +Mv represent the same displacement. Hence, we only
consider the absolute values Mv
of displacement vector. If an image is tampered, only one or a few sub-blocks have the same displacement vector is impossible. Assuming that the minimum
displacement of the tampered region occurs at frequency Ft, in the case of an image size of M×N
and a sub-block size of K×K, the ROI should contain sub-blocks not less that Ft. Here we take
equal-mark, and calculate Ft as follows:
0.85% /
t
F = ×M×N K
. (9) A matching vector counter C is used to record the frequency of occurrence of a matching block
pair-Mv, and the initial value is 0. For every potential pair of matching block, the counter C is
increased by one.The value and the frequency counter should meet the formula (10):
(
v1, v2)
(
v1, v2)
1 ( v1, v2) tC m m =C m m + ,C m m ≥F
. (10)
Region Marking
: ( , ), : ( , )
i i i j j j
V x y V x y
respectively. The Hamming distance between Vi and Vj
isexpressed as tan ( ,i j)
hamdis ce V V
, then the marked block should meet the following conditions:
, , tan ( , ) 5
j i j i i j
x −x =m y −y =n hamdis ce V V ≤
. (11)
Result Output
For some images, there may be exist many free blocks (satisfy the region marking condition but not the duplicated region). To eliminate these unexpected free blocks, we convert the mark image into a binary image first, then calculate the region size of each connected region, and then select the region with the second largest area as the threshold, finally, delete the remaining connect regions (whose area are less than the threshold) and output the detection result.
Experimental Results and Analysis
The tested images in this paper are select from CASIA1, the image size is image size is 256×384,
the simulation platform is MATLAB R2016a, and the sub-block is 8×8, Cuv=14, Ft=26. The
algorithm performs copy-paste detection, anti-JPEG compression, anti-Gaussian noise and anti-Gaussian blur test on the randomly chosen images. Finally, the comprehensive performance of the algorithm is analyzed and compared with that of other common algorithms.
Copy-paste Forgery Detection
First, the basic copy-paste forgery is detected, and then the approximation sub-band images processed by the DWT are demonstrated in Figure 3(a), (b) and (c), respectively. The marking results are shown in Figure 3(d), (e) and (f). In the end, Figure 3(g), (h) and (i) are the final results.The test results prove that the proposed algorithm is effective on copy-paste tampering.
(a) (b) (c) (d) (e)
(f) (g) (h) (i)
Figure 3. (a), (b) and (c) are the approximation sub-bands images, (d), (e) and (f) are the marking results, (g), (h) and (i) are the final results
Anti-JPEG Compression
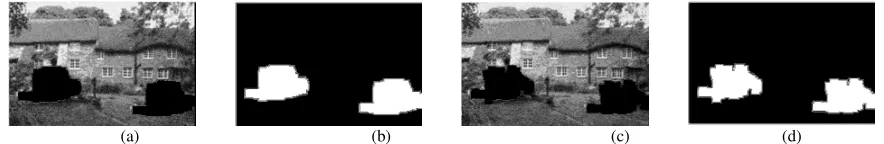
The marking results with the quality factors of 70 and 50are shown in Figure 4(a), (c), and Figure 4(b), (d) are the final results. The results illustrate that the detection results for two quality factors are only slightly different and valid. Other test results for different quality factors also prove that the proposed algorithm is effective on JPEG compression.
(a) (b) (c) (d)
[image:5.612.99.518.418.548.2] [image:5.612.75.517.657.729.2]Anti-Gaussian Noise Test
The marking results with Gaussian noise (mean m of 0 and variance var of 0.005 and 0.01) are
shown in Figure 5(a) and (c), and the Figure 5(b) and (d) are the final results. It can be seen that the Gaussian noise has a great influence on the performance of the algorithm, but the tampered region can still be detected accurately.
(a) (b) (c) (d)
Figure 5. (a) and (c) are the marking results, (b) and (d) are the final results.
Anti-Gaussian Blur Test
The marking results with processing of Gaussian blur (w=5, σ=1, 2)are shown in Figure 6(a) and (c),
and Figure 6(b) and (d) are the final outputs. The results illustrate that the algorithm can detect Gaussian blur accurately.
(a) (b) (c) (d)
Figure 6. (a) and (c) are the marking results, (b) and (d) are the final results.
Analysis of Experimental Results
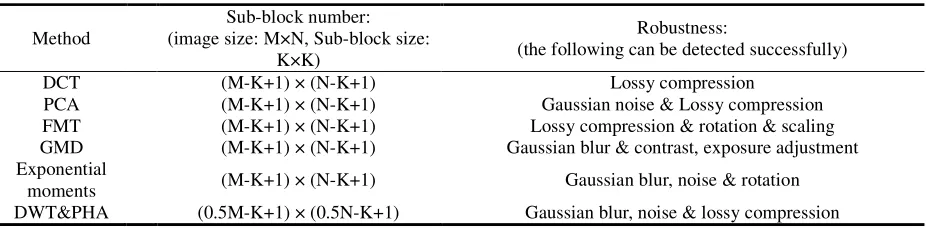
[image:6.612.71.520.141.214.2]This paper based on the PHA and DWT achieves higher accuracy while it greatly reduces the number of blocks and increases the calculation speed obviously. The comparison between our detection algorithm and the algorithm proposed before is as follows.
Table 1. The algorithm feature extraction and robustness comparison.
Method
Sub-block number: (image size: M×N, Sub-block size:
K×K)
Robustness:
(the following can be detected successfully)
DCT (M-K+1) × (N-K+1) Lossy compression
PCA (M-K+1) × (N-K+1) Gaussian noise & Lossy compression FMT (M-K+1) × (N-K+1) Lossy compression & rotation & scaling GMD (M-K+1) × (N-K+1) Gaussian blur & contrast, exposure adjustment Exponential
moments (M-K+1) × (N-K+1) Gaussian blur, noise & rotation DWT&PHA (0.5M-K+1) × (0.5N-K+1) Gaussian blur, noise & lossy compression
Conclusion
[image:6.612.74.518.300.374.2] [image:6.612.75.538.475.589.2]Acknowledgement
This research was financially Supported by GUET Excellent Graduate Thesis Program (16YJPYSS13).
References
[1]R Dixit, R Naskar.: ‘Review, analysis and parameterization of techniques for copy-move forgery detection in digital images’. Let Image Processing, 2017, 11(9): 746-759.
[2]Fridrich J, Soukal D, Lukas J.: ‘Detection of copy-move forgery in digital images [C]. Proceedings of Digital Forensic Research Workshop’, IEEE Computer Society, Washington, USA, 2003:55-61.
[3]Popescu A C, Fraid H.: ‘Exposing digital forgeries by detecting duplicated image region[R]’. Dartmouth College, Handover, USA: TR2004-515, 2004.
[4]Sevinc Bayram, Husrev Taha Sencar, and Nasir Memon.: ‘An efficient and robust method for detection copy-move forgery’. In: International Conference on Acoustics, Speech, and Signal Processing, 429-432.
[5]J Zhao, J Guo, B Wu.: ‘Detection of image region-duplication forgery based on Geometric Mean Decomposition’. Journal of Chinese Computer Systems, 2012, 33(9):002105-2018.
[6]W Luo, J Huang, G Qiu. Robust Detection of Region-Duplication Forgery in Digital Image[J]. In: Chinese Journal of Computers, 2007, 4(11):746-749. (in Chinese).