2018 International Conference on Computational, Modeling, Simulation and Mathematical Statistics (CMSMS 2018) ISBN: 978-1-60595-562-9
A Bayesian Network for Symptom-diagnosis Data
Ying YU
*, Jian-ye LU, Zheng YANG and Wen-wen YANG
Institute of Electromechanical Engineering and Automation, Shanghai University, Shanghai 200072, China
*Corresponding author
Keywords: Bayesian, Markov chain-Monte Carlo, Metropolis-Hastings sampling, K2 algorithm, BDE scoring function.
Abstract. Bayesian network is an important expression tool of uncertain knowledge by integrating probability table and graph. This paper applies Bayesian network into clinical data for knowledge discovery and constructs a Bayesian network for symptom-diagnosis data with optimal structure. First of all, a Markov chain-Monte Carlo based Metropolis-Hastings sampling method is introduced to fill in the missing data; Then, a K2 algorithm is used to search for all possible Bayesian networks among the relationship between symptoms and diagnoses; Further, the BDE scoring function is used to determine the optimal network structure illustrating the relationship between symptoms and diagnoses. The results show that the network structure accuracy has greatly improved after filling the missing data with the method of Metropolis-Hastings sampling.
Introduction
With the development of data mining, how to convert the tools of data mining into practical productivity has become a major concern in academicals, medical, and business fields[1]. In medical
field, compared with other data mining methods, Bayesian network has its unique advantages[2]: it is
usually presented in graphical form to facilitate understanding; it can handle incomplete information, and even when data is lost learning is still possible. Due to these advantages, this paper considers applying Bayesian network for clinical data by learning network, aiming to construct an optimal model structure to illustrate the relationships between symptoms and diagnoses.
Learning Bayesian network includes 2 parts: parameter learning and structural learning. Parameter learning refers to obtaining the posterior probability distribution of parameters on the basis of the prior distribution of parameters and existing data samples[3]. For parameter learning
from incomplete data, scholars have made quite a few studies. Friedman[4] et al. proposed a
Structural EM algorithm that combination the standard EM algorithm with structure search for model selection.. Li Changjun[5] introduced an E-SEM algorithm combined with simulated
annealing and BC algorithm, and applied it to recognize the “five pathogenic factors” in the medical records. Sehgal et al. [6] presented a novel missing value imputation algorithm to use multiple
covariance based matrices for predication of missing values. In this paper, a Markov chain-Monte Carlo based Metropolis-Hastings sampling method is applied to predict missing values for clinical data, and a K2 algorithm combined with BDE scoring function is used to determine the optimal network structure illustrating the relationship between symptoms and diagnoses.
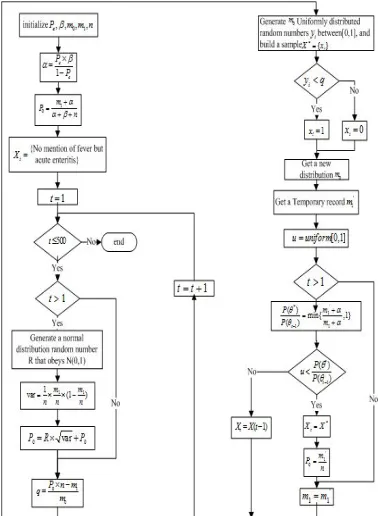
Metropolis-Hastings Sampling Based Data Filling
The Metropolis sampling algorithm was proposed by Metropolis et al., in 1953, and was extended to the Metropolis-Hastings (MH) sampling algorithm by Hastings in 1970[7], and has been applied
widely in various fields since then.
Metropolis-Hastings sampling directly extracts a sequence of random samples from a certain probability distribution for certain sequences which are difficult to sample directly[8]. Similar with
First, the target probability density function and its distributionP( ) are given. is in the range
of , the Markov chain sequence is given as:
1 2 t
Where, ( )t
shows the state of the tth generation of Markov chain. Then, initialize( )1. With the given transition probability ( | ( 1)t )
q , generates a new candidate
point( ) which would be accepted or rejected with a certain probability. Unlike the Metropolis method, the acceptance probability of Metropolis-Hastings sampling is related to the previous state(t1)and the new candidate point( ) . The acceptance probability is shown in (1):
1
( ) ( ) ( )
( 1) ( ) ( 1)
( ) ( )
( ,
) ( 1
)
t
t t
p q
min
p q
∣
∣ (1)
When the transition probability satisfies the symmetry condition[9], (1) can be simplified as(2).
)
) 1 (
(
( ) ( ) 1, p t
min p
(2)
This process is repeated until the sampling process converges, and thus ( )t is the sample from target distribution P( ) .
In the massive medical records where symptom-disease relationship could be found, there are a lot of records in which the symptoms are not mentioned, or the values of symptom attributes are missing, and it is necessary to fill in such missing parts for following discovery of knowledge about symptom-disease relationship.
Here the Metropolis-Hastings sampling is considered to be used in medical data to predict the missing data by considering target distribution of symptom-disease relationship. Besides, the expert experience about the prior distribution of symptom-disease relationship is also considered.
Usually, when sample data is not big enough or is incomplete, expert experience is necessary for empirical assistance. In this paper, in the initializing stage of the sampling algorithm, expert experience is considered in the sampling algorithm, and the experts’ opinion about the target distribution, or, the prior distribution, is incorporated into the process of generating new candidate point.
Figure 1. Sampling Flowchart of Metropolis-hastings.
Learning Bayesian Network Structure
As symptoms relative to diseases are various, to construct a Bayesian network illustrating symptom-disease relationship explicitly and concisely, it is necessary to select symptoms that matter most to the particular disease. Thus a network learning is implemented via a heuristic K2 algorithm combined with BDE scoring measure for model selection[10], so that an optimized model could be
obtained. Compared with conventional algorithms such as an enumeration algorithm, the algorithm has higher computational efficiency[11].
BDE Scoring Function
To search the optimal network structure, this paper uses BDE scoring function to evaluate the network structure.
For a given sample data D , its BDE score function is as follows[12]:
1 1 1
( ) ( )
( | )
( ) ( )
qi
n ri
ij ijk ijk
ij ij ijk
i j k
a a N
P D G
a N a
(3) Where, Gis a network.n is the number of variables. qiis the number of configurations of the parent
set. ri is the number of discrete states of variablexi.Nijkis the number of times xitook on the value
k given the parent configuration j.
1
ri
ij ijk
k
N N
,ijkis the Dirichlet hyper-parameter in Bayesiannetwork.
1
ri
ij ijk
k
.( )n is the gamma function, for any n n( N),( ) (n n1)!.K2 Algorithm
Herskovits and Cooper proposed K2 algorithm[13] in 1992. Since then, the K2 algorithm has
scoring function is used to measure the efficiency of the network structure. For two random discrete variablesX Y, , their mutual information entropy is as follows[14]:
( , ) ( ; ) ( ) ( | ) ( , ) log
( ) ( )
x X y Y
p x y I X Y H X H X Y p x y
p x p y
(4)Where, I X Y( ; )denotes the degree of association of random variablesX Y, .This paper uses the mutual information entropy to rank the symptoms by measuring the relevance between the symptom and the target disease.
The process of the K2 algorithm is as follows: Input:
D : A set of symptoms sorted by the mutual information entropy between symptom and disease
: The maximum number of parent nodes. Output:
A Bayesian network with the maximum BDE score Gold.
Step 1: Gold ,V0 0
Step 2: Ranking xj according to the relevance between the symptom xj and the target disease x0.
Step 3: for j=1 to n Step 4: Gnew Step 5: Aj ;
Step 6: Vold BDE(xj,x0,Aj) ; (Where )
, , (xj x0 Aj
BDE refers to a network composed of
symptom xj, the disease node x0 , and a set of nodesAj)
Step 7: if (Vold V0)
Step 8: V0 Vold,Gold Gnew
Step 9: end if Step 10: while (true)
Step 11: 1 argmax ( , 0, { })
,k j j j k
k
x x
A BDE
k
;
Step 12: VnewBDE(xj,x0,Aj{xk1}); Step 13: if (VnewVold)and(Aj ) Step 14: Vold Vnew
Step 15: Aj Aj{xk1};
Step 16: Add an edge xk1x0 in Gnew
Step 17: else Step 18 : Break; Step 19: end if Step 20: if (Vold V0)
Step 21: V0Vold,Gold Gnew
Experimental Results
The proposed methodology is proposed to search the key symptoms about the disease “acute gastroenteritis” from 18 symptom words listed in Table 1. About 4000 online medical records are used for training data, and 100 records are used for testing data.
Table 1. Some symptoms.
Key words no. Key words Sorting Key words no. Diarrhea/pulling/pulled/de
fecate 1 fart 7 water in the lungs 13
Threw up 2 Constipation / can not pull out 8 Pus 14
Stomach pain 3 Bloating 9 Bloodshot 15
Uncomfortable 4 Rash 10 isoenzymes are high Creatine kinase 16
Fever 5 Pain of bulge 11 Often nausea 17
Stomach pain 6 Left lower abdomen pain 12 Painful rolling on the ground 18
The information entropy method was first used to sort the first 200 symptom words extracted from the questionnaire, and the first 18 symptom words and their sequences are shown in Table 1.
Then, a Markov chain-Monte Carlo based Metropolis-Hastings sampling method is applied to predict missing values for sample data
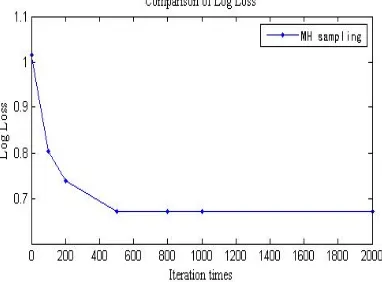
Log Loss as shown in Eq.(5) is applied to measure the accuracy of network structure prediction and that of algorithm learning[15]:
1
1
( log( | )) log ( | )
m
i i
L E T D P t D
m
(5) Where, T is the sample data whose number ism,and ti is the ith sample, and D is the total
[image:5.612.212.403.518.659.2]training data set, and L indicating the prediction accuracy. The smaller the value is, the higher the prediction accuracy is. Setting the times of the Metropolis-Hastings sampling from 0 to 2000, the accuracy is shown in Figure 2. It could be seen that the Log Loss gradually decreases as the sampling times increases from 0 to 2000.
Figure 2. Comparison of sampling times and prediction accuracy of metropolis-hastings.
Thus the accuracy of predication could be improved via sampling by fusing the experts’ experience into the knowledge.
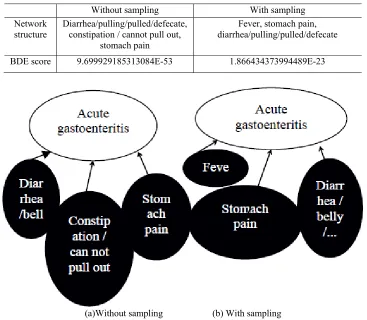
[image:6.612.123.490.202.522.2]Next, a K2 algorithm combined with BDE scoring function is used to determine the optimal network structure illustrating the relationship between symptoms and diagnoses. The optimal network structures for 2 cases are shown in Figure 3. Case 1 is for data without sampling, that is, the missing data is not filled, and Case 2 is for sample data with sampling, that is, the missing data is filled by sampling. The BDE scores and network structure of the test samples with and without sampling are shown in Table 2. From the table 2, it could be seen that the network structure accuracy with sampling is obviously better than that before.
Table 2. Test sample network structure and BDE function before and after sampling. Without sampling With sampling
Network structure
Diarrhea/pulling/pulled/defecate, constipation / cannot pull out,
stomach pain
Fever, stomach pain, diarrhea/pulling/pulled/defecate
BDE score 9.699929185313084E-53 1.866434373994489E-23
(a)Without sampling (b) With sampling
Figure 3. Optimal network model structure without and with sampling.
Conclusion
In this paper, the Bayesian network parameters and structure learning are applied to search the relationship between the symptoms and the specified diseases. Firstly, a Metropolis-Hastings sampling is applied to fill in the missing data, then a heuristic K2 algorithm is used to implement the optimal network search, and the BDE scoring function is employed to determine the network structure. Numerical examples show that the combination of Metropolis-Hastings sampling and heuristic K2 algorithm can build a efficient Bayesian network model structure.
Acknowledgment
References
[1]Li Jia. Data Mining Application System Design for Pharmaceutical Business [D]. Chongqing University, 2002.
[2]Yan Na. Research on Algorithm Application of Bayesian Network in Data Mining [D]. Anhui University, 2012.
[3]Dong Hui. A New Bayesian Network Parameter Learning Algorithm with Incomplete Data [D]. Guangxi Normal University, 2003.
[4]Friedman N. The Bayesian structural EM algorithm [C]// Fourteenth Conference on Uncertainty in Artificial Intelligence. Morgan Kaufmann Publishers Inc. 1998: 129-138.
[5]Li Changjun. Chinese Medicine Case Data Mining Based on Bayesian Network [D]. Xiamen University, 2008.
[6]Sehgal M.S.B., Gondal I., Dooley L.S. Collateral missing value imputation: a new robust missing value estimation algorithm for microarray data [M]. Oxford University Press, 2005.
[7]Bierkens J. Non-reversible Metropolis-Hastings [J]. Statistics & Computing, 2016, 26(6): 1213-1228.
[8]Hu Zhengtao, Zhang Jing, Hu Yumei, etc. Multi-sensor Kalman Filtering Algorithm Based on Metropolis-Hastings Sampling [J]. Electronic Journal, 2017, 45(4): 868-873.
[9]Shao Wei. Monte Carlo Methods and Their Applications in Some Statistical Model [D]. Shandong University, 2012.
[10]GuoTong, Lin Feng. Bayesian network structure learning based on hybrid genetic fish school algorithm [J]. Journal of Zhejiang University (Engineering Science), 2014, 48(1): 130-135.
[11]Jian Min. Bayesian Network Research Based on GA-K2 Algorithm and Its Application in Personal Credit Evaluation [D]. Jinan University, 2016.
[12]Wang Y., Gao H., Chen G. Predictive complex event processing based on evolving Bayesian networks [J]. Pattern Recognition Letters, 2017.
[13]Cooper G.F., Herskovits E. A Bayesian method for the induction of probabilistic networks from data [J]. Machine Learning, 1992, 9(4): 309-347.
[14]Yan Long. Application of Improved Bayesian Network Algorithm in Sub-health Analysis[D]. Xi'an University of Architecture and Technology, 2015