wileyonlinelibrary.com/journal/eva Evolutionary Applications 2017; 10: 68–76 68
|
© 2016 The Authors. Evolutionary Applicationspublished by John Wiley & Sons Ltd
This is an open access article under the terms of the Creative Commons Attribution License, which permits use, distribution and reproduction in any medium, provided the original work is properly cited.
Abstract
Despite wide applications of high- throughput biotechnologies in cancer research, many biomarkers discovered by exploring large- scale omics data do not provide satis-factory performance when used to predict cancer treatment outcomes. This problem is partly due to the overlooking of functional implications of molecular markers. Here, we present a novel computational method that uses evolutionary conservation as prior knowledge to discover bona fide biomarkers. Evolutionary selection at the mo-lecular level is nature’s test on functional consequences of genetic elements. By prior-itizing genes that show significant statistical association and high functional impact, our new method reduces the chances of including spurious markers in the predictive model. When applied to predicting therapeutic responses for patients with acute my-eloid leukemia and to predicting metastasis for patients with prostate cancers, the new method gave rise to evolution- informed models that enjoyed low complexity and high accuracy. The identified genetic markers also have significant implications in tumor progression and embrace potential drug targets. Because evolutionary conser-vation can be estimated as a gene- specific, position- specific, or allele- specific param-eter on the nucleotide level and on the protein level, this new method can be extended to apply to miscellaneous “omics” data to accelerate biomarker discoveries.
K E Y W O R D S
evolutionary medicine, genomics/proteomics, molecular evolution, transcriptomics
1Department of Biomedical Informatics,
Arizona State University, Tempe, AZ, USA 2School of Life Science, Arizona State
University, Tempe, AZ, USA
3Department of Computer Science and
Engineering, Arizona State University, Tempe, AZ, USA
4Department of Bioengineering, Rice
University, Houston, TX, USA 5The University of Texas MD Anderson
Cancer Center, Houston, TX, USA 6Department of Computational Medicine
and Bioinformatics, University of Michigan, Ann Arbor, MI, USA
Correspondence
Li Liu, Department of Biomedical
Informatics, Arizona State University, Tempe, AZ, USA.
Email: [email protected] and
Jieping Ye, Department of Computational Medicine and Bioinformatics, University of Michigan, Ann Arbor, MI, USA
Email: [email protected]
O R I G I N A L A R T I C L E
Evolution-informedmodelingimprovesoutcomepredictionfor
cancers
LiLiu
1
|
YungChang
2
|
TaoYang
3
|
DavidPNoren
4
|
ByronLong
4
|
StevenKornblau
5
|
AminaQutub
4
|
JiepingYe
61
|
INTRODUCTION
In the past two decades, high- throughput biotechnologies have greatly accelerated cancer research and become an indispensable component in scientific and clinical practices. “Omics” data combined with advanced computational modeling, hold promise in discovering novel biomarkers to help improve cancer medicine (Kristensen et al., 2014). However, models constructed from global molecular profiles often consist of a large number of biomarkers that have no obvious
2012; Massuti, Sanchez, Hernando- Trancho, Karachaliou, & Rosell, 2013). Thus, many researchers advocate informed analysis that com-bines biological knowledge, such as functional annotations and bio-logical pathways, with computational modeling to interpret “omics” data, hoping to identify bona fide biomarkers to facilitate biomedical research (Chen et al., 2009; Hill et al., 2012; McDermott et al., 2013).
Cancer is an evolutionary disease (Greaves & Maley, 2012), but cancer biomarker discovery rarely integrates evolutionary selection. Sequence conservation inferred from genomes of evolutionarily di-verse species represents a valuable resource of biological knowledge. As mutations disrupting critical molecular functions have been consis-tently purified from the species pool over eons, sequences of function-ally important genes remain conserved across species. The expression of conserved genes is also under more stringent regulation than variable genes (Liao & Zhang, 2006; Podder & Ghosh, 2010). Thus, evolutionary conservation has been used as an effective indicator of functional importance (Kumar, Dudley, Filipski, & Liu, 2011; Kumar, Sanderford, Gray, Ye, & Liu, 2012; Pei & Grishin, 2001). Evolutionary conservation has left comprehensible signatures in cancers. It has been shown that proto- oncogenes and tumor suppressor genes are among the most highly conserved genes (Shilo & Weinberg, 1981). A majority of somatic cancer driver mutations interrupt positions that do not tol-erate germline mutations (Dudley et al., 2012). Therefore, evolution-ary conservation of genetic elements can provide valuable guidance to cancer biomarker discovery by eliminating spurious markers that show fortuitous statistical associations but little biological relevance.
Not all conserved genes contribute to carcinogenesis and cancer progression, and not all cancer genes are evolutionarily conserved (Ballard- Barbash et al., 2012). Applying evolutionary conservation on cancer biomarker discovery also requires simultaneous consider-ation of statistical associconsider-ation to achieve high predictive power. In this study, we present a computational method that uses evolutionary conservation as prior knowledge within a machine learning framework to assist biomarker selection. We applied this new method to predict therapeutic responses in patients with acute myeloid leukemia (AML) and to predict metastasis in prostate cancers. The results show that evolution- informed models enjoy high predictive accuracy using only a few functionally important biomarkers, thus ameliorated the risk of overfitting. We further show that the identified genetic markers are involved in tumor progression and embrace potential drug targets. These experiments demonstrate that evolution- informed modeling successfully improves biomarker selection to go beyond statistical as-sociation and seek biological implications.
2
|
MATERIALSANDMETHODS
2.1
|
Cancerdatasets
We first developed this method to participate in the DREAM 9 acute myeloid leukemia (AML) Challenge (Noren et al., 2016). A total of 31 teams from around the world, including our team, participated in this challenge. Provided by the challenge organizers and available from their official website (https://www.synapse.org/#!Synapse:syn2455683/
wiki/64007), this dataset consisted of 291 patients who were newly diagnosed with AML and received induction therapy. Treatment out-comes were recorded as complete response or resistance to induc-tion therapy. Each patient was measured on 40 clinical covariates describing demographic, cytogenic, mutation status, and the results of several standard blood tests. Proteomic data were available for each patient sample obtained prior to treatments. The proteomic features represent levels of 231 total or phosphorylated proteins, focusing on proteins involved in apoptosis, cell cycle, and signal- transduction pathways. Seventy- nine of these proteins have confirmed roles in oncogenesis and cancer progression (i.e., cancer driver genes), as an-notated by the Cancer Gene Consensus list in the COSMIC database (Forbes et al., 2015). The goal was to predict if a patient will have a complete response or resistance to chemotherapy using clinical and proteomic markers. Of the total 291 patient samples, the DREAM or-ganizer provided 191 samples to us for biomarker selection and model training. The other 100 samples were depleted of treatment outcome labels and used for blind testing.
The second cancer dataset was downloaded from NCBI GEO database (accession number: GSE10645). This dataset consisted of 401 patients who were diagnosed with prostate cancer and received prostatectomy (Nakagawa et al., 2008). Treatment outcomes were re-corded as metastatic recurrence after surgery or no evidence of dis-ease progression within 5 years. However, all patients have incrdis-eased level of prostate- specific antigen (PSA) that is routinely used to moni-tor disease recurrence. For each patient, a panel of 1,021 oncogenes, tumor suppressor genes, and genes in their associated pathways was interrogated using Agilent custom gene expression microarrays. In particular, 604 genes on this panel have previously been associated with prostate cancer progression. No clinical covariate was available for these patients. The goal was to predict metastatic recurrence using genetic markers.
2.2
|
Estimateevolutionaryconservation
billion years. For a protein of length L, the evolutionary rate (R) was estimated as the average r over all positions (R=1
L
∑L i=1ri).
2.3
|
Evolution-informedmodeling
The purpose of evolution- informed modeling is to prioritize evolu-tionarily conserved and thus functionally important genes during bio-marker discovery (i.e., feature selection in the machine learning field). The selected biomarkers are then used to build a predictive model (i.e., classification). It can be achieved by employing (i) a deliberately de-signed weighting schema, (ii) an effective feature selection algorithm, and (iii) a robust classification model.
2.3.1
|
Compositeweightingschema
Because fast evolutionary rate indicates low conservation, we used its reciprocal (1/R) as the evolutionary weight (WE). For clinical co-variates, there is no meaningful score of evolutionary conservation. Because clinical features tend to have higher predictive power than molecular features in general (Falini, Nicoletti, Martelli, & Mecucci, 2007; Thiede et al., 2006; Walter, Othus, Burnett, et al., 2015; Walter, Othus, Paietta, et al., 2015), we assigned the maximum value of all WEs in the dataset to clinical features. To assess statistical signifi-cance, we performed a Student’s t test for each feature between two clinical outcome classes (poor outcome as the positive class, good out-come as the negative class). In the presence of multiple classes, other statistical tests such as F test can be used. p values from these tests were transformed via negative logarithm (−log(p)) and used as the sta-tistical weight (WS). For each feature i, the final weight was the sum
of evolutionary weight and statistical weight (Wi = WEi+ WSi). In this study, we assumed equal contribution of evolutionary conservation and statistical association to the final weights. However, their rela-tive contributions can be adjusted based on the understanding of a specific cancer phenotype.
2.3.2
|
Featureselection
Within a cancer dataset, we first normalized each clinical and molecu-lar feature by computing z- scores that have a distribution with a mean of 0 and a standard deviation of 1. Let a feature matrix fij denote the normalized values of the ith features for the jth sample (Fig. 2A). We
then transformed this feature matrix by multiplying Wi for each fea-ture. This weighted feature matrix fijw was subjected to feature
selec-tion (Fig. 2B). In particular, we used the l1- norm regularized logistic regression, as implemented in the SLEP package (Liu, Ji, & Ye, 2009). Our purpose is to solve the following problem:
where yj and fjw are the class label and the weighted feature vector for the jth sample, respectively, c is a constant corresponding to the inter-cept in a linear model, λ is the regularization parameter, and x is the solution. By assigning higher weights to evolutionarily conserved and/ or statistically significant features, we increased the absolute value of fjw. In fact, the formulation is (1) is equivalent to the following problem:
In equation (2), a larger penalty is imposed on features with a small weight. Consequently, the solution will favor the features with a large weight.
In equation (1) and (2), the calculation of x requires the selection of the most appropriate regularization parameter (λ), which dictates the number of features selected (receiving nonzero x values). To reduce such dependence, we employed a stability selection method. In par-ticular, 100 bootstraps were performed to identify features that are consistently selected in more than 50% of runs of the algorithm with different λ values.
2.3.3
|
Classification
A classification model was constructed with selected features (Fig. 2C). In this step, the unweighted feature matrix fij was used to avoid biases. The classification model was a random forest with 50 trees, as implemented in the TreeBagger function in Matlab (version R2013a). While we chose to use random forest for classification, other linear or nonlinear algorithms can be employed as well.
2.3.4
|
Bootstrapping
To avoid bias caused by the imbalance of class size (García, Sánchez, Mollineda, Alejo, & Sotoca, 2007), we wrapped a bootstrapping (1)
minx∑m j=1log
(
1+exp (
−yj (
xTf jw+c
))) + 𝜆||x||1
(2)
minx
∑m
j=1log (
1+exp(−yj
(
xTfj+c
))) + 𝜆∑
i
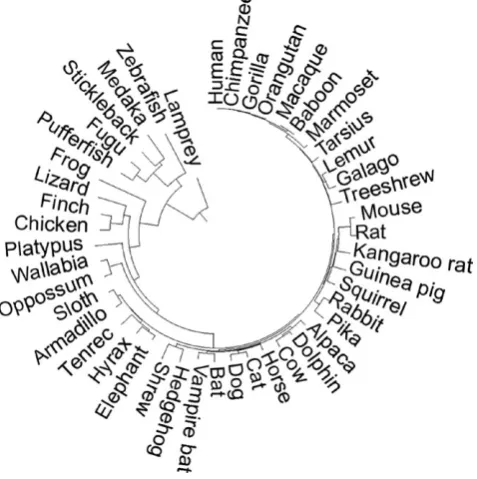
1 Wi|xi| F I G U R E 1 TimeTree of the 46 species used in computing
evolutionary parameters. Branch length is proportional to species divergence times obtained from the TimeTree database (Hedges et al.,
[image:3.595.50.289.53.293.2]process around the above feature selection and classification steps. Specifically, a subset of equal numbers of samples was randomly se-lected from each class. This number was determined as 90% of sam-ples in the under- represented class. For each bootstrap, a classification model was obtained, which is called a submodel. By repeating this pro-cedure 100 times, an ensemble of 100 submodels were produced.
2.3.5
|
Prediction
To classify an unknown sample, 100 predictions were made, one from each submodel. The final prediction was derived by computing a
confidence score, which equals to the percentage of submodels that predict the sample as the positive class label (Fig. 2D).
2.3.6
|
Performanceevaluation
We used balanced accuracy (BAC, defined as the average of true- positive rate and true- negative rate) and area under the receiver op-erating characteristic (AUROC) to assess the predictive accuracy of a model. These two parameters are robust to the imbalance of class size, and thus commonly used and well documented (García et al., 2007; Noren et al., 2016).
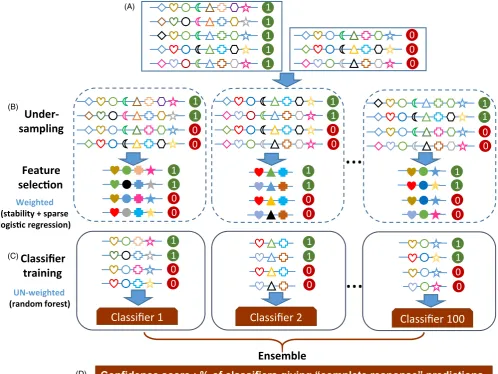
F I G U R E 2 Graphical representation of the workflow of evolution- informed modeling. (A) Input matrix. Each row represents a sample, with positive samples (i.e., with poor clinical outcomes) labeled as “1” and negative samples (i.e., with good clinical outcomes) labeled as “0.” Each column represents a feature, as indicated by different symbols. (B) Feature selection. Subsets of the input data are generated using under- sampling that randomly chooses equal numbers of positive and negative samples. For each subset, feature values are transformed with composite weights. Feature selection is then applied on the weighted features. Using stability selection and sparse logistic regression, informative features are selected. Open symbols represent un- weighted features. Solid symbols represent weighted features. (C) Classification model. For each subset, un- weighted values of selected features are used to build a random forest classifier (a submodel). Collectively, these submodels comprise the ensemble model. (D) Prediction. For an unknown sample, each submodel produces a predicted label. The majority rule is used for the final prediction. The percentage of submodels that predict the sample as the positive class label is used as the confidence score of the final prediction
1
1
1
1
1
0
0
0
1
1
0
0
1
0
0
1
1
0
0
1
1
1
0
0
1
0
0
1
1
0
0
1
1
1
0
0
1
0
0
1
1
0
0
1
Classifier 1
Classifier 2
Classifier 100
Ensemble
Classifier
training
Feature
selecon
Under-sampling
Weighted
(stability + sparse
logisc regression)
UN-weighted
(random forest)
…
…
Confidence score : % of classifiers giving “complete response” predictions
(A)(B)
(C)
[image:4.595.49.548.48.422.2]3
|
RESULTS
3.1
|
Predicttherapeuticresponsesinacutemyeloid
leukemia
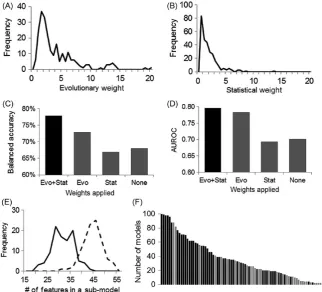
We first examined the distributions of evolutionary weights and sta-tistical weights in the AML training dataset that consisted of 191 pa-tient samples. Both showed left skewness (Fig. 3A,B), indicating that most proteins were not functionally critical and not statistically as-sociated with the treatment outcome. Therefore, only a small number of biomarkers were present (i.e., sparse solution). We then applied the new method to build an evolution- informed model. When evaluated on the held- out testing samples that consisted of 100 unseen patient samples, our evolution- informed model achieved the highest perfor-mance among a total of 31 participating teams from around the world, with balanced accuracy of 77.9% and AUROC of 0.796. The up had a slightly lower AUROC (0.783) but much lower balanced ac-curacy (72.8%) (Noren et al., 2016).
To further understand the impact of evolutionary weighting on feature selection and classification accuracy, we compared four differ-ent models (Me+s, Me, Ms, and M0), in which composite weight, only evolutionary weight, only statistical weight or no weight was used during feature selection, respectively. The rest of the algorithm was kept the same. Our results showed that Me+s achieved the highest performance, with up to 11.0% increase on balanced accuracy and 0.102 increase on AUROC as compared to other models (Fig. 3C,D). Interestingly, Ms that used only statistical weight showed the low-est performance. In an effort to understand this, we split the training
dataset into two random subsets and performed a Student’s t test within each subset. The correlation of p- values between these two subsets was only moderate (coefficient = .37), reflecting high noise level in proteomic data. Therefore, algorithms that solely rely on statis-tical associations to choose biomarkers from “omics” data may suffer from over- fitting, as reported by other studies as well (Liu et al., 2014). Evolutionary information, as demonstrated in our method, can help effectively reduce the noise level and prioritize genes that are biolog-ically important.
Applying weights during feature selection also helped reduce the complexity of the model, as measured by the number of features in-cluded in each submodel (Fig. 3E). In the feature selection step, fea-tures that were selected in >50% bootstrapping runs with a wide range of regularization parameters are regarded as important and informa-tive. Under this setting, Me+s achieved an accuracy of 77.9% with an average of 30 features in each submodel. Contrarily, in M0, the accu-racy dropped to 68% and the average number of features increased to 43 in each submodel. These excessive features are likely false- positive markers. The fact of significantly fewer features achieving significantly higher accuracy demonstrates the power of using evolutionary and statistical weights to assist feature selection and classification for pre-dicting AML outcomes.
Several studies showed that clinical features were more infor-mative than proteomic features in predicting AML outcomes (Cilloni et al., 2008; Gulley, Shea, & Fedoriw, 2010; Moon et al., 2010; Noren et al., 2016), which was also reflected in our model. Among the most frequently used features that were included in more than 80% of sub-models, only two are proteomic (Fig. 3F, Table S1). However, these
[image:5.595.46.369.439.731.2]two proteins, namely PIK3CA and GSK3, both have strong implica-tions in AML therapies. PIK3CA is a well- known proto- oncogene (Zhu et al., 2012). The PIK3CA signaling pathway is a drug target in treating several hematologic malignancies (Jabbour, Ottmann, Deininger, & Hochhaus, 2014). GSK3 plays a role in the control of several regu-latory proteins including the proto- oncogene JUN, and in the WNT and PI3K signaling pathways that are critical in tumor progression. Recently, GSK3A has been suggested as a potential target for treat-ing AML (Banerji et al., 2012). Selection of these two potential drug targets without knowing such information in prior demonstrated that evolution- informed modeling is capable of identifying biomarkers that are computationally powerful and biologically meaningful as well. It is also worth noting that both PIK3CA and GSK3 are conserved proteins although they are not the most conserved ones in this assay. Similarly, their statistical associations are significant but not among the top ones either. Therefore, evolutionary and statistical weights do not over- dominate the selection of features. This gave us the desired ef-fect on the feature selection process, in which functional importance and statistical significance are emphasized, but other factors, such as minimization of classification errors, still play essential roles.
3.2
|
Predictmetastasisinprostatecancer
In this study, we applied the evolution- informed modeling and evalu-ated its performance by followed a strict cross- validation procedure. Specifically, we randomly chose 80% of the samples for training and used the other 20% for independent testing. This procedure was re-peated 10 times, and the averages of balanced accuracy and AUROC
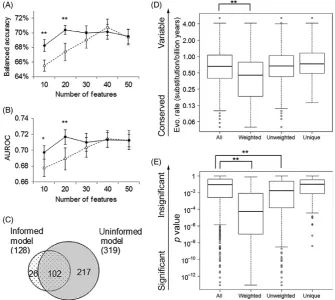
values estimated from the test datasets were reported. For each it-eration, we built an Me+s model that incorporated evolutionary and statistical weights, and an M0 model that did not employ any weight. In addition to finding the optimal model with the highest prediction accuracy, this dataset allowed us to examine the performance of mod-els with varying complexity, as measured by numbers of features in-cluded. We found that Me+s achieved the largest improvement over M0 when the models are the simplest (Fig. 4A,B). If only 10–20 genes were allowed for each submodel, Me+s had 4% higher accuracy (paired t(19) = 4.95, p =4.5 × 10⁻⁵) and 4% higher AUROC values (paired
t(19) = 4.08, p =3 × 10⁻³) than M
0. The improvement became
insig-nificant when the complexity of a model increased and reached 40 genes in each submodel. While the best performance of Me+s is similar to that of M0 (balanced accuracy: 70.8% vs. 70.1%, AUROC: 0.721 vs. 0.731), M0 used twice as many features as Me+s (number of features included in each submodel: 40 vs. 20).
We further examined genes used in models with the best perfor-mance. Summarized over all submodels, 128 and 319 unique genes were included in at least one submodel in the top- performing Me+s model and in the top- performing M0 model, respectively. Most genes (80%) in Me+s were also present in M0, while M0 contained 217 addi-tional genes (Fig. 4C). Compared to all genes assayed, these addiaddi-tional genes are less conserved (t test on log(evolutionary rate), t(396) = 3.11, p =.002, Fig. 4D) and have weaker statistical associations (t test on log(p value), t(499) = 3.30, p =.001, Fig. 4E). Because including them in the predictive models negatively affected the accuracy, they are probably irrelevant to the metastasis phenotype. Indeed, GeneOntology analysis (Mi et al., 2016) showed that these additional genes are not enriched
F I G U R E 4 Evolution- informed modeling to predict metastasis for prostate cancers. Balanced accuracy (A) and AUROC values (B) for evolution- informed models (solid lines) and for un- weighted models (broken lines) that include various numbers of features. Average values with standard errors are plotted. * and ** indicate significant difference with t test p value
[image:6.595.215.551.431.731.2]in any biological process. Contrarily, genes in Me+s have higher conser-vation (t test on log(evolutionary rate), t(150) = −5.33, p = 10−7) and
stronger statistical association (t test on log(p value), t(144) = −10.1, p = 10−18). They are significantly enriched in biological processes that
have been previously implicated in metastasis and tumor progression, such as DNA repair, cell cycle, and DNA metabolism (Table S2).
4
|
DISCUSSION
As one of the leading causes of morbidity and mortality in the modern world, cancer has become a major problem in public health. Accurate prediction of a patient’s response to treatment and prognosis can greatly assist clinicians to choose appropriate therapy and help im-prove patient care. High- throughput biotechnologies have generated a large amount of “omics” data that can be used for this purpose. However, the high noise level in these data impairs the usage in iden-tifying reliable biomarkers. Further, the number of samples tested in an “omics” study is usually several orders of magnitudes smaller than the number of molecular features measured, which makes tradition-ally derived statistical models prone to overfitting. In fact, our analy-sis showed that statistical scores tended to describe random error or noise instead of the true underlying relationship in omics data. Consequently, these models are hard to interpret and lack generaliza-tion capability.
To reduce the noise, we studied the possibility of using evolu-tionary conservation to prioritize functionally important genes as predictive biomarkers. Evolutionary selection at the molecular level is nature’s test on functional impact of genetic elements (Kimura, 1983). Compared to other functional annotations, such as functional do-mains and pathways that vary across tissue and developmental stages, sequence conservation is directly associated with functional conse-quence and rigorously tested over eons of evolutionary history (Pei & Grishin, 2001). In this study, we developed a mathematical framework that favorably includes conserved genes for biomarker discovery. By applying this new method to predict treatment outcomes for a he-matological cancer (AML) and for a solid tumor (prostate cancer), we demonstrated that evolution- informed models indeed improved the prediction accuracy on cancer outcomes. This helps eliminate irrele-vant features that are often included due to stochastic factors. Thus, more reliable biological inferences can be made using features se-lected in the evolution- informed procedure.
Gene expression profiles and protein expression profiles modeled in this study are molecular changes downstream of genomic alter-ations. Genomic aberrations play critical roles in carcinogenesis and fuel tumor heterogeneity in and between patients. Such high molec-ular heterogeneity forms the foundation of diverse clinical outcomes and other cancer phenotypes, as well as makes hunting of cancer driver mutations very challenging (Heng, 2015). Our previous study showed that frequently observed cancer mutations are enriched at evolutionarily conserved positions (Dudley et al., 2012). Thus, evolu-tionary conservation estimated at the nucleotide level may help pri-oritize cancer driver mutations. This suggests that genomic profiles,
transcriptomic profiles and proteomic profiles of patients with cancer can be integrated and prioritized simultaneously under a common evo-lutionary framework.
Another aspect of cancer evolution is subclonal evolution within a tumor (Greaves & Maley, 2012). An increasing number of studies have reported that drug resistance and disease relapse in various types of cancers are attributed to expansion of preexisting or newly emerged subclones (Burrell & Swanton, 2014; Ding et al., 2012; Landau, Carter, Getz, & Wu, 2014). Given the highly dynamic characteristic of sub-clones, similar challenges exist in identifying driver subclones as in identifying driver mutations. As cancer is a disease of evolution that accumulates genetic mutations while it progresses, it is attractive to use mutational load to prioritize subclones. However, we may also argue that functional impact of a subclone is more informative than mutational load. In this sense, species- level evolutionary conservation can be used to derive a composite weight that represents aggregated functional impact of all mutations in a subclone. Integrating evolu-tionary signatures on species level and on individual level would be a promising and exciting new direction of research.
Meanwhile, biomarker discovery shall not leave out clinical co-variates that have been associated with cancer treatment outcomes in numerous studies. One difficulty we encountered in incorporating clinical covariates in evolution- informed modeling was the calculation of meaningful and distinctive priorities for them. Currently, we rely on statistical weights computed from the training data, which do not re-flect the rich domain knowledge. In the future, we will consider deriv-ing scores from meta- analysis, which may serve as a better surrogate of prior knowledge aggregated from existing studies. By integrating multisource omics data and clinical features and comparing evolution-ary contributions and statistical contributions to clinical outcomes, we will gain new insights into the causes of cancer formation and progression.
ACKNOWLEDGEMENTS
We thank Dr. Jean- Pierre Kocher for insightful comments, and Brian Hanratty for editorial support.
DATAARCHIVINGSTATEMENT
This study was conducted using publicly available data that can be downloaded from the DREAM Challenge website and the Gene Expression Omnibus database.
REFERENCES
Ballard-Barbash, R., Friedenreich, C. M., Courneya, K. S., Siddiqi, S. M., McTiernan, A., & Alfano, C. M. (2012). Physical activity, biomarkers, and
disease outcomes in cancer survivors: A systematic review. Journal of
the National Cancer Institute, 104, 815–840.
Berger, B., Peng, J., & Singh, M. (2013). Computational solutions for omics data. Nature Reviews Genetics, 14, 333–346.
Brooks, J. D. (2012). Translational genomics: The challenge of developing
cancer biomarkers. Genome Research, 22, 183–187.
Burrell, R. A., & Swanton, C. (2014). Tumour heterogeneity and the
evolution of polyclonal drug resistance. Molecular Oncology, 8,
1095–1111.
Cawley, G. C. T., & Nicola, L. C. (2010). On over- fitting in model selection and subsequent selection bias in performance evaluation. Journal of Machine Learning Research, 11, 2079–2107.
Chen, L., Xuan, J., Wang, C., Wang, Y., Shih Ie, M., Wang, T. L., … Hoffman, E. P. (2009). Biomarker identification by knowledge- driven multi-level ICA and motif analysis. International Journal of Data Mining and Bioinformatics, 3, 365–381.
Cilloni, D., Messa, F., Arruga, F., Defilippi, I., Gottardi, E., Fava, M., Carturan, S., Catalano, R., Bracco, E., Messa, E., et al. (2008). Early prediction of treatment outcome in acute myeloid leukemia by measurement of WT1 transcript levels in peripheral blood samples collected after
che-motherapy. Haematologica, 93, 921–924.
Ding, L., Ley, T. J., Larson, D. E., Miller, C. A., Koboldt, D. C., Welch, J. S., Ritchey, J. K., Young, M. A., Lamprecht, T., McLellan, M. D., et al. (2012). Clonal evolution in relapsed acute myeloid leukaemia revealed by
whole- genome sequencing. Nature, 481, 506–510.
Dudley, J. T., Kim, Y., Liu, L., Markov, G. J., Gerold, K., Chen, R., … Kumar, S. (2012). Human genomic disease variants: A neutral evolutionary
expla-nation. Genome Research, 22, 1383–1394.
Falini, B., Nicoletti, I., Martelli, M. F., & Mecucci, C. (2007). Acute myeloid leukemia carrying cytoplasmic/mutated nucleophosmin (NPMc+ AML): Biologic and clinical features. Blood, 109, 874–885.
Forbes, S. A., Beare, D., Gunasekaran, P., Leung, K., Bindal, N., Boutselakis, H., Ding, M., Bamford, S., Cole, C., Ward, S., et al. (2015). COSMIC: Exploring the world’s knowledge of somatic mutations in human
can-cer. Nucleic Acids Research, 43, D805–811.
Fujita, P. A., Rhead, B., Zweig, A. S., Hinrichs, A. S., Karolchik, D., Cline, M. S., ... James, K. W. (2011). The UCSC genome browser database: Update
2011. Nucleic Acids Research, 39, D876–882.
García, V., Sánchez, J. S., Mollineda, R. A., Alejo, R., & Sotoca, J. M. (2007). The class imbalance problem in pattern classification and learning. Greaves, M., & Maley, C. C. (2012). Clonal evolution in cancer. Nature, 481,
306–313.
Gulley, M. L., Shea, T. C., & Fedoriw, Y. (2010). Genetic tests to evaluate prognosis and predict therapeutic response in acute myeloid leukemia. The Journal of Molecular Diagnostics, 12, 3–16.
Hedges, S. B., Dudley, J., & Kumar, S. (2006). Timetree: A public knowledge-
base of divergence times among organisms. Bioinformatics, 22,
2971–2972.
Heng, H. H. (2015). Debating cancer: The paradox in cancer research. New
Jersey: World Scientific.
Hill, S. M., Neve, R. M., Bayani, N., Kuo, W. L., Ziyad, S., Spellman, P. T., … Mukherjee, S. (2012). Integrating biological knowledge into variable selection: An empirical Bayes approach with an application in cancer
biology. BMC Bioinformatics, 13, 94. PMC3503557.
Jabbour, E., Ottmann, O. G., Deininger, M., & Hochhaus, A. (2014). Targeting the phosphoinositide 3- kinase pathway in hematologic malignancies. Haematologica, 99, 7–18.
Kimura, M. (1983). The neutral theory of molecular evolution. Cambridge: Cambridge University Press.
Kristensen, V. N., Lingjaerde, O. C., Russnes, H. G., Vollan, H. K., Frigessi, A., & Borresen-Dale, A. L. (2014). Principles and methods of
inte-grative genomic analyses in cancer. Nature Reviews Cancer, 14,
299–313.
Kulasingam, V., Pavlou, M. P., & Diamandis, E. P. (2010). Integrating high- throughput technologies in the quest for effective biomarkers for
ovar-ian cancer. Nature Reviews Cancer, 10, 371–378.
Kumar, S., Dudley, J. T., Filipski, A., & Liu, L. (2011). Phylomedicine: An evo-lutionary telescope to explore and diagnose the universe of disease mutations. Trends in Genetics, 27, 377–386.
Kumar, S., Sanderford, M., Gray, V. E., Ye, J., & Liu, L. (2012). Evolutionary
diagnosis method for variants in personal exomes. Nature Methods, 9,
855–856.
Kwon, S. M., Cho, H., Choi, J. H., Jee, B. A., Jo, Y., & Woo, H. G. (2012). Perspectives of integrative cancer genomics in next generation se-quencing era. Genomics & Informatics, 10, 69–73.
Landau, D. A., Carter, S. L., Getz, G., & Wu, C. J. (2014). Clonal evolution
in hematological malignancies and therapeutic implications. Leukemia,
28, 34–43.
Liao, B. Y., & Zhang, J. (2006). Evolutionary conservation of expression
pro-files between human and mouse orthologous genes. Molecular Biology
and Evolution, 23, 530–540.
Liu, J., Ji, S., & Ye, J. (2009). SLEP: Sparse learning with efficient projections.
Tempe, AZ: Arizona State University.
Liu, Z., Zhang, Y., Niu, Y., Li, K., Liu, X., Chen, H., & Gao, C. (2014). A sys-tematic review and meta- analysis of diagnostic and prognostic serum biomarkers of colorectal cancer. PLoS One, 9, e103910.
Ludwig, J. A., & Weinstein, J. N. (2005). Biomarkers in cancer staging,
prog-nosis and treatment selection. Nature Reviews Cancer, 5, 845–856.
Massuti, B., Sanchez, J. M., Hernando-Trancho, F., Karachaliou, N., & Rosell, R. (2013). Are we ready to use biomarkers for staging, progno-sis and treatment selection in early- stage non- small- cell lung cancer? Translational Lung Cancer Research, 2, 208–221.
McDermott, J. E., Wang, J., Mitchell, H., Webb-Robertson, B. J., Hafen, R., Ramey, J., & Rodland, K. D. (2013). Challenges in biomarker discovery: Combining expert insights with statistical analysis of complex omics data. Expert Opinion on Medical Diagnostics, 7, 37–51.
Mi, H., Poudel, S., Muruganujan, A., Casagrande, J. T., & Thomas, P. D. (2016). PANTHER version 10: Expanded protein families and functions, and analysis tools. Nucleic Acids Research, 44, D336–342.
Moon, J. H., Sohn, S. K., Lee, M. H., Jang, J. H., Kim, K., Jung, C. W., & Kim, D. H. (2010). BCL2 gene polymorphism could predict the treatment outcomes in acute myeloid leukemia patients. Leukemia Research, 34, 166–172. Nakagawa, T., Kollmeyer, T. M., Morlan, B. W., Anderson, S. K., Bergstralh,
E. J., Davis, B. J., … Jenkins, R. B. (2008). A tissue biomarker panel pre-dicting systemic progression after PSA recurrence post- definitive pros-tate cancer therapy. PLoS One, 3, e2318.
Noren, D. P., Long, B., Norel, R., Rhrissorrakrai, K., Hess, K., Hu, C. W., ... Amina, A. Q. (2016). A crowd sourcing approach to developing and
assessing prediction algorithms for AML prognosis. PLoS Computational
Biology, 12(6), e1004890.
Pei, J., & Grishin, N. V. (2001). AL2CO: Calculation of positional
conser-vation in a protein sequence alignment. Bioinformatics, 17, 700–712.
Podder, S., & Ghosh, T. C. (2010). Exploring the differences in evolution-ary rates between monogenic and polygenic disease genes in human. Molecular Biology and Evolution, 27, 934–941.
Sham, P. C., & Purcell, S. M. (2014). Statistical power and significance testing in large- scale genetic studies. Nature Reviews Genetics, 15, 335–346. Shilo, B. Z., & Weinberg, R. A. (1981). DNA sequences homologous to
vertebrate oncogenes are conserved in Drosophila melanogaster. Proceedings of the National Academy of Sciences of the United States of America, 78, 6789–6792.
Thiede, C., Koch, S., Creutzig, E., Steudel, C., Illmer, T., Schaich, M., & Ehninger, G. (2006). Prevalence and prognostic impact of NPM1
muta-tions in 1485 adult patients with acute myeloid leukemia (AML). Blood,
107, 4011–4020.
Walter, R. B., Othus, M., Paietta, E. M., Racevskis, J., Fernandez, H. F., Lee, J. W., Sun, Z., Tallman, M. S., Patel, J., Gonen, M., et al. (2015). Effect of genetic profiling on prediction of therapeutic resistance and survival in
adult acute myeloid leukemia. Leukemia, 29, 2104–2107.
Zhu, Y. F., Yu, B. H., Li, D. L., Ke, H. L., Guo, X. Z., & Xiao, X. Y. (2012). PI3K expression and PIK3CA mutations are related to colorectal cancer
metastases. World Journal of Gastroenterology, 18, 3745–3751.