Avoiding the Buyer’s Fallacy: Consumer Perceptions of Products Before Purchase
By
Elliott Andrew Manzon
A dissertation submitted in partial fulfillment of the requirements for the degree of
Doctor of Philosophy (Design Science) In the University of Michigan
2013
Doctoral Committee:
Professor Richard D. Gonzalez, Co-Chair Associate Professor Carolyn Yoon, Co-Chair Professor Colleen M. Seifert
ii
ACKNOWLEDGEMENTS
iii
Table of Contents
Acknowledgements ii
List of Tables iv
List of Figures v
Abstract vi
Chapter 1: Introduction 1
Chapter 2: How Product Attributes Influence Online Cell Phone Reviews 12 Chapter 3: The Influence of Added Features in Product Preferences for Older and Younger
Consumers 33
Chapter 4: Influencing Consumers to Purchase Easy to Use Products 58
Chapter 5: Conclusion 69
iv
List of Tables
Table 2-1: Product Rating Averages 19
Table 2-2: Smartphone Product Rating Averages 24
Table 2-3: Priority of Top Two Significant Predictors in Studies 1 and 2 27 Table 2-4: Correlations and Beta Values for Linguistic Analysis 29
Table 3-1: Choice Distribution by Age Group 39
Table 3-2: Significance of Age Group in Proportional Odds Analysis 40
Table 3-3: Product Experience Means 40
Table 3-4: Percentage of Responses Mentioning Choice Reason 41
Table 3-5: Liking Ratings 45
Table 3-6: Ease of Use Ratings 46
Table 3-7: Capabilities Ratings 47
Table 3-8: Willingness to Pay 48
Table 3-9: Product Review Rating Means 51
Table 3-10: Proportions Choosing Each Model 53
Table 4-1: Ease of Use ratings 64
v
List of Figures
Figure 1-1: Influence of Product Attributes Before and After Product Purchase 3
Figure 1-2: Diagram of Buyer’s Fallacy 5
Figure 2-1: Lens Model Weightings 15
Figure 2-2: Example Customer Review 18
Figure 2-3: Tree Predicting Overall Evaluation 21
Figure 2-4: Tree Predicting Recommendation 22
Figure 2-5: Tree Predicting Overall Evaluation 26
Figure 2-6: Tree Predicting Recommendation 26
Figure 3-1: Product Reviews Displayed 50
Figure 4-1: Example of Presentation Types 62
vi
Abstract
1
Chapter 1: Introduction
Consumers are faced with an exceedingly difficult decision: how to choose the product with which they will be most satisfied. It is not an easy question to answer. The market is crowded with thousands of products and brands with different attributes, features, and descriptions. Consumers must take what little information they have available, such as information in the store or in online descriptions, and make judgments about which product will best suit their needs. It is often difficult to foresee how one is going to use a product, and the factors that seem important at the time of purchase can differ from those that influence whether one is happy with their purchase. The result is consumers who are often unhappy with the product that they had purchased.
When staring at a shelf of competing products, a consumer may have a variety of questions flowing through their head. How will I use this product? What do I need it to be able to do? Is it worth paying more for more features? Will I regret the choice I make? It is often nearly impossible to accurately answer these questions, yet these are the questions that determine which product one chooses. The buyer can do little beyond making guesses and estimations of which product will be best for their needs. For example, a consumer living in Seattle may not think they need a 4-wheel drive vehicle, but they may recognize its value when on ski trips in the winter months. After purchase, the laptop we thought was the best in the store is too slow, the fashionable cell phone has terrible battery life, and the DVR we planned to use daily is rarely turned on.
2
product that matches one’s needs. Consumers waste money, time, and add stress to their lives when the wrong products come home. Understanding how consumers are choosing, and what can be done to help, is of great importance; however, little research has touched this subject. Too often, the emphasis in marketing is making the initial sale, ignoring the consumer satisfaction after using the product.
However, this strategy is short-sighted. For example, imagine a consumer who needs to purchase a simple digital athletic watch for its stopwatch functionality. Upon arriving at the store, the consumer is attracted to a watch containing many additional features, such as a heart rate monitor and calorie counter. After buying the watch, the consumer experiences the usability struggles and frustration from the additional steps and menus on the watch. It is only after using it that the consumer realizes a simple watch, which was less appealing at the time of purchase, would have actually been the better choice. The consumer incorrectly predicted which attributes are most important to their satisfaction with the product. These outcomes do have consequences for marketers and designers because unhappy consumers express their dissatisfaction through negative word-of-mouth, costly product returns, and switching to competing brands.
3
[image:10.612.62.528.117.657.2]occur; indeed, consumers with more experience and motivation may manage to avoid repeating the same weighting error again in the future.
4
The figure above demonstrates how two factors – usability and the number of features – trade off; that is, as one increases, the other decreases. Adding more features by necessity makes it more difficult to use the product. However, this model can be expanded to account for other factors influencing purchases. Attributes such as design, price, marketing, social identity, and others could result in differences between pre- and post-purchase weightings.
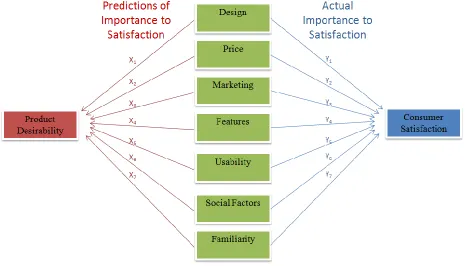
Consider affective forecasting effects, where people are generally poor predictors of later emotional states (Wilson & Gilbert, 2003), such as how they may feel one year after winning the lottery. In the same way, I propose that consumers are poor predictors of which product attributes will impact their satisfaction with a product. Using a lens-model approach, one can compare what a consumer predicts are important factors in their decision, and which factors are actually important once the product is used (Brunswick 1955) (see Figure 1-2). The factors listed in the boxes in the middle of Figure 1-2 are examples of some of the factors influencing purchase decisions. The consumer applies different weightings (indicated with X1, Y1, etc) to these factors based on their beliefs of what is important when making the product selection (left side of the figure). The right side of the figure demonstrates how each of the factors affect the actual experience with the product. If a consumer were to perfectly predict which attributes would be most influential for their product satisfaction, the weightings on each side of the figure would be the same. Figure 1-2 expands upon Figure 1-1 by demonstrating how consumer weightings when making a product choice can differ from the ideal weightings for the many factors that influence product choice.
5
Figure 1-2: Diagram of Buyer’s Fallacy
6
The weights placed on attributes could vary for a number of reasons. The use of a heuristic could lead to focusing on one attribute too heavily, or insufficiently. A lack of experience or knowledge could cause factors to fail to come to mind when making evaluations. And overconfidence in one’s abilities could cause a person to underweight attributes that they recognize may cause problems. There could also be several ways that the Buyer’s Fallacy may be mitigated, such as by creating interventions that allow consumers to focus their attention on critical attributes. For example, a salesperson telling a customer that they strongly recommend buying products which are easy to use could influence attribute weightings. Repeated purchases that result in learning could also potentially reduce the Buyer’s Fallacy in some instances. For example, highly experienced or motivated consumers may learn to change their weightings over time.
As the affective forecasting literature shows (Wilson & Gilbert, 2003), discrepancies between consumers’ perceptions and later experiences are relatively common. Consumer choice is often based on heuristics, basic “rules of thumb” used to simplify a decision process. For example, consumers tend to follow a heuristic by assuming that more expensive products are better, an effect known as the Price Heuristic (Mitra, 1995). Although this heuristic may hold true in some situations, there are many cases where this heuristic leads to a poor choice, and a less expensive model (such as a generic) can be of equivalent or superior quality.
Although there are many factors that could lead to a Buyer’s Fallacy, this dissertation focuses on the role of ease of use and the number of product features in product choices. Consumers often commit the Buyer’s Fallacy by under-weighting ease of use when evaluating a product, and focus instead on the number of features available with a product.
In previous research, consumers have been found to weight ease of use as less important prior to using a product than after use (Thompson, Hamilton, & Rust, 2005; Lee & Koubek, 2010). These results suggest that consumers undervalue the importance of ease of use prior to using a product and that ease of use only becomes an important factor for consumers after using a product.
7
poor judges of product ease of use. Younger adults were found to be relatively poor judges of which aspects of a product design would impact ease of use (Stephens, Carswell, & Schumacher, 2006). Other evidence suggests that perceptions of ease of use are strongly influenced by aesthetics (Tractinsky, Katz, Ikar, 2000). Consumers tend to be over confident in their ability to learn how to use a product leading to them over-predict the ease of use of a product prior to use (Billeter, Kalra, & Loewenstein, 2010).
Hence, the problem with consumer perceptions of ease of use appears to be both underweighting of ease of use prior to use as well as a relatively poor ability to judge ease of use. Consumers are committing what we refer to as the Buyer’s fallacy because they are misjudging and undervaluing ease of use when making product judgments and are instead focusing on other factors such as the number of product features.
Research in marketing has established that consumers have a tendency to choose products with a higher number of features (e.g. Thompson, Hamilton, & Rust, 2005; Sela & Berger, 2012). However, too many features tend to cause usability problems, resulting in consumers who are less happy with their selection. This effect, known as feature fatigue, describes one way in which the Buyer’s Fallacy can lead to less satisfied customers after using a product. In one study using a digital video player, consumers used models with either 7, 14 or 21 features (Thompson, et al., 2005). Prior to use, participants rated the video player more favorably with more features. After using the product, the models with many features were evaluated less favorably and the models with fewer features were evaluated more favorably. Participants who used the models with fewer features also were more confident in their product choice and rated the choice as less difficult.
8
desired feature (Heo, Ham, Park, Song, & Yoon, 2008; Hicks, 1952). Physical challenges can also arise if buttons and text become smaller to accommodate more features (Fitts, 1952).
Construal level theory is one potential way to explain why consumers are subject to the Buyer’s Fallacy. According to construal level theory, events or objects which are further away psychologically (temporally, spatially, or socially) are represented abstractedly and events or objects which are psychologically closer are represented more concretely (Liberman & Trope, 1998). Taking a concrete construal tends to cause a focus on feasibility and therefore a preference for products with higher ease of use. Taking an abstract construal tends to cause a focus on product desirability (Hamilton & Rust, 2007). Prior to using a product, consumers have a more abstract construal and therefore focus more on desirability (e.g. features, aesthetics). Using a product leads to concrete construals and a focus on feasibility (e.g. ease of use). Therefore, the low weighting that ease of use receives at the time of product evaluation may be explained by construal theory.
Another explanation for consumers ignoring ease of use by choosing products with many features is through perceptions of product capabilities (Sela & Berger, 2012). Hedonic products are those which are consumed for enjoyment, and utilitarian products are those consumed for usefulness. Since hedonic products are viewed as relatively lacking in capabilities, increasing the number of features, which increases perceived capabilities, has a larger impact on hedonic products than utilitarian products (Sela & Berger, 2012). The effect was found to be strongest when participants faced time constraints, and the effect was stronger for people low in need for cognition. These results suggested that the attraction towards products with many features is being processed heuristically and based on the belief that more features increases a products capabilities.
9
demonstrate using the product in front of others, an exercise which could have negative social effects with products that are not easy to use. Another study found that aesthetics but not ease of use had a significant effect on consumer preferences prior to using a website; however, after using the product, ease of use was then also evaluated as an important attribute for consumers (Lee & Koubek, 2010).
People try to maximize utility. This leads to the common belief that one benefits from buying the product with the most features since each feature would add to the potential utility, assuming the product is within budget constraints. The sentiment is reiterated through popular culture and marketing. AT&T launched a marketing campaign with the slogan “more is better.” The more is better culture is also displayed through product bundling, offering multiple components together for a lower price, and with “supersizing” products, increasing the amount purchased for a lower per unit price. It seems unlikely that consumers could benefit from products offering less in marketplace consistently promoting the benefits of more. A focus on the potential capabilities of additional features comes naturally when evaluating products because consumers are focused on maximizing what a product can add to their life. Marketers also focus on the potential benefits of more features when selling a product.
10
This dissertation addresses three main research questions related to the Buyer’s Fallacy focusing on ease of use and the number of product features: Study 1 establishes that the Buyer’s Fallacy impacts consumer evaluations and recommendations. Study 2 identifies a moderating factor of the Buyer’s Fallacy based on consumer age. Study 3 creates an intervention to help consumers avoid the Buyer’s Fallacy. Though I focus on usability, the Buyer’s Fallacy framework of discrepancies between perceived importance and experienced importance can apply to a number of other attributes. For example, consumers could initially perceive products that have to be assembled as a negative factor; however, the assembly process may actually make the product significantly more satisfying to the consumer (Norton, Mochon, & Ariely, 2012). Aiding consumer decision making also has significant benefits for marketers who can better match customers with their products, potentially leading to increased brand loyalty. Product returns and negative word-of-mouth both have serious fiscal consequences that can be avoided by better matching consumers with products with which they will be satisfied.
The current literature in feature fatigue, consumer perceptions, and product design gives rise to some key questions addressed in this dissertation. Currently, there is little field work into what product design aspects affect consumer perceptions of products. The majority of work has been done in lab settings, and has typically examined the tradeoffs between two attributes. It is yet to be determined whether ease of use or other attributes are important predictors of product evaluations in the real world, where there are more factors, interactions, and products are used over a longer course of time. In order to improve consumer judgments of products based on their design, I first aim to establish which design attributes are most influential on one’s satisfaction. I do this by examining product reviews to determine which product design attributes are most influential on consumer evaluation ratings. The research design also allows us to further examine construal level theory on product choice by comparing how attributes affecting evaluations differ from attributes affecting recommendations for others.
11
features. Little research has suggested whether some groups are able to avoid the negative effects of the Buyer’s Fallacy by initially focusing on ease of use when choosing products. No research has been done on how age affects the Buyer’s Fallacy. I address this question by examining how older adults differ from younger adults in their choice of products varying on the number of features. I aim to determine if older adults may be better at avoiding the Buyer’s Fallacy, and why this may be.
The third major gap in the literature I identified is a lack of actionable advice on how consumers and marketers can avoid the Buyer’s Fallacy. My work addresses this need by establishing a visual representation of ease of use to allow consumers to better evaluate the usability of a product.
12
Chapter 2: How Product Attributes Influence Online Cell Phone Reviews
Co-Authors: Elliott Manzon Richard Gonzalez Colleen M. Seifert
Abstract
13 Background
Consumers have always spread “word-of-mouth” advice about products and services for purchase (Dierkes, Bichler, & Krishnan, 2011); but, with the growth of the internet and online retailers such as Amazon.com, consumers are increasingly receiving product information through consumer reviews posted online (Hennig-Thurau, Gwinner, Walsh, & Gremler, 2004; Li & Zhan, 2011). Fifty-seven percent of respondents were found to consult online reviews prior to purchasing consumer electronics (Nielson Company, 2010). Consumer reviews can have a significant impact on online purchases given that the product cannot be physically handled as it can in the retail environment (Smith, Menon, & Sivakumar, 2005). For marketers, there is significant value in understanding the factors influencing evaluations and recommendations for a product. Prior research has analyzed how online reviews vary based on product type, review depth, and review quality (Mudambi & Schuff, 2010). However, little is known about the judgment processes underlying online evaluations and recommendations.
In practice, consumers’ evaluations of products may not always line up with their recommendations. A product that consumers say they like does not necessarily receive positive word-of-mouth, perhaps accounting for why some products test well before launch but then fail to catch on. Do people always like what they recommend to others? For example, consider the articles, “Why I love the Galaxy Nexus but can't recommend it,” (Hiner, 2011) and “Didn’t like it, would still recommend it,” (A.V. Club, Aug, 2011). In both cases, reviewers wrote about movies or products that they did not enjoy but still recommended to others and vice versa. These inconsistencies suggest one’s personal evaluation of products can indeed differ from decisions to recommend them. But, what accounts for differences in these two judgments? Given the increasing availability of consumer reviews, it is important to understand how evaluations and recommendations are created.
14
the recommendation of the product; however, different attribute weightings may be applied when consumers consider products for themselves versus others, potentially leading to differences between evaluations and recommendations.
Attributes Affecting Product Evaluation
Standard multi-attribute utility theory suggests that different attributes, such as value, brand, aesthetics, functionality, social desirability, ease of use, and expectations, combine to form an evaluation of a product (Huber, 1974). Some research indicates that these attribute weightings can change for an individual in different situations. Two components of product evaluation that have been found to change weightings are ease of use and the number of features. The weighting of these two attributes has been shown to change with product use (Sela & Berger, 2012; Thompson, Hamilton, & Rust, 2005). When making an evaluation at the time of purchase, the number of features was weighted more heavily, and perceived ease of use was weighted less heavily. After using the product, these valuations reversed; that is, ease of use was weighted more heavily than number of features (Thompson, Hamilton, & Rust, 2005). Aesthetics and usability have also been shown to change attribute weightings in different situations (Lee & Koubek, 2010). Before use, consumer preference was significantly affected by aesthetics, but only slightly affected by usability; after use, both usability and aesthetics were found to have a significant effect on product evaluation. So, previous research suggests that product attribute weightings can change; in these examples, a product may be evaluated by different criteria at time of purchase than after use.
15
Figure 2-1. Lens Model Weightings: Overall product evaluations and recommendations for others may involve applying different weights to product attributes like “Ease of use” and
“Features.”
For example, consider a college student evaluating her experience with a cell phone. This individual rarely makes phone calls, and uses the phone almost exclusively for internet access and texting. Her overall evaluation of the phone is then strongly influenced by these features. However, when she is considering whether to recommend her phone to others, she notes that others may make more calls, and be concerned about call quality. Therefore, she may decide not to recommend the phone for others despite her own satisfaction with the product. Such separate evaluations for oneself vs. others has important implications for how we conceptualize online reviews and recommendations systems.
Self vs. Other Judgments
Prior studies have documented that one’s own choice may be inconsistent with one’s recommendation for others. When choosing between two job options, people chose a different job option if they were making a recommendation for a friend vs. choosing for themselves (Kray & Gonzalez, 1999). Similarly, in risk-taking behavior involving approaching a relationship interest, people were more willing to recommend that a friend should take the risk
Correlation
Ease of Use
Features
Display
Battery
Design
Recommendation Evaluation
16
(Beisswanger et al., 2003). Self-other differences have also been found in medical decisions (Zikmund-Fisher, Sarr, Fagerlin, & Ubel, 2006), waiting time decisions (Krishnamurthy & Kumar, 2002), and use of confirmatory information search (Jonas, Schulz-Hardt, & Fey, 2005). This difference in judgments for oneself vs. others does not appear to be a matter of expending lower effort for recommendations; rather, it seems the judge recognizes that other’s preferences can be different from their own (Kray, 2000). One explanation offered is that attributes are more evenly weighted when making a choice for oneself, whereas a prominent attribute is emphasized when making a recommendation (Kray & Gonzalez, 1999). Based on these results, we expect that a prominent attribute will receive the highest weighting in recommendation, but attributes will be given more even weighting in evaluation.
But which attribute will be most important in a recommendation? Changes in attribute weighting based on differing situations has been addressed by construal level theory (Castaño, Sujan, Kacker, & Sujan, 2008; Trope, Liberman, & Wakslak, 2007). According to this theory, events or objects that are further away psychologically (temporally, spatially, or socially) are represented abstractly, while events or objects that are “psychologically closer” are represented more concretely. Product evaluations may induce more concrete construals, whereas the more distant task of recommendation for others may lead to more abstract construals (Liberman & Trope, 1998). Concrete construals may lead to greater emphasis on feasibility considerations, such as Ease of use, while abstract construals may lead to a greater emphasis on desirability considerations, such as Features.
Hamilton & Thompson (2007) support this construal theory prediction. They observed that after using a product, people tended to prefer products that they deemed to be more concrete, with high feasibility (ease of use) yet low desirability (fewer features). When choosing for others, people take a more abstract mental representation and are relatively less influenced by ease of use following direct product experience. For evaluations, people appear to prefer products based on concrete, feasibility concerns, such as ease of use. Choices for others, on the other hand, were more weighted toward desirability concerns such as the number of features.
17
Tenbrunsel, Wade-Benzoni, & Blount, 1999; Hsee, Loewenstein, Blount, & Bazerman, 1999). In a separate evaluation, when assessment of attribute quality can be difficult without a comparison, attributes that are easy to evaluate may receive greater weighting. The evaluability hypothesis suggests that recommendations, where preferences of the person receiving the recommendation can be ambiguous, will result in greater weighting on easily observable attributes of a product (i.e., the concrete attributes). Readily observable attributes are preferred in recommendations because they are easier to justify by direct observation. For a cell phone, these attributes would include aesthetics (Design) or desirable capabilities (Features).
Hence, the evaluability hypothesis predicts that recommendations will give more weight to observable attributes such as “design” and “features” because they can be justified to others, whereas construal theory predicts that evaluations will give more weight to concrete attributes which are easy to relate to oneself such as Ease of use. We designed a study to test these opposing predictions using a Lens Model formulation to guide our conceptual and analytic framework. We used public data available through product websites to examine whether the evaluation of a product differs when it is evaluated for one’s own use or recommended to others. We focused on publically posted online product reviews of cell phones by consumers. The database contained an overall evaluation rating, a recommendation, and evaluations of individual product attributes. We analyzed how consumers weighted these individual attributes when providing product evaluations and recommendations.
Study 1: Cell Phones
Method
18
non-smartphones with a wider range of physical interfaces and fewer capabilities. Non-smart phones were selected for Study 1. To reduce effects of a changing marketplace and new technologies, only reviews posted within the prior six months were considered. Six of the nine non-smartphones on the site were included in the study because they had a minimum of 120 different consumer reviews posted within the timeframe. 120 reviews were randomly selected from the posted database for each of the six phones. The phones included 3 different brands, and the models were varied, with 2 phones with purely touch screen keyboards, 3 phones with horizontally sliding keyboards, and 1 with a vertically sliding keyboard.
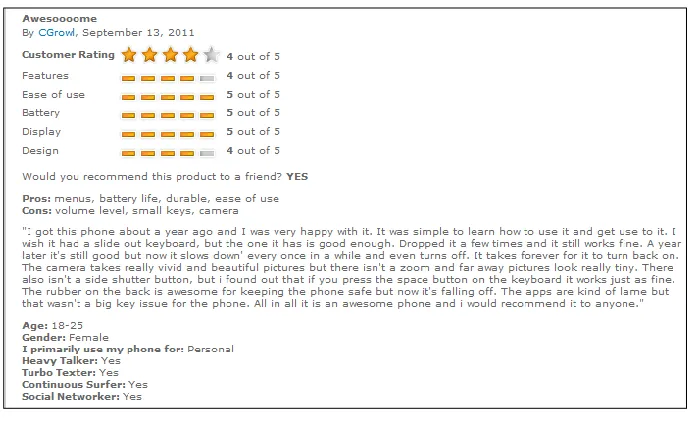
[image:25.612.133.478.377.588.2]Many websites, such as Amazon.com, offer consumer-entered product evaluations using a 1 to 5 star scale, along with a qualitative product review in which consumers describe their product experience. This cell phone website used the same star rating system for the overall evaluation, and in addition, consumers were asked to post ratings on five specific attributes of cell phones: Features, Ease of Use, Battery, Display, and Design (see Figure 2-2). A text block allowed free-text entry of a qualitative description of the consumer experience.
Figure 2-2: Example of a Customer Review Used in the Study
19 Results
The gender distribution was 61% female and 28.3% male, with 10.7% unlisted. Reviewers reported their age in ranges on a dropdown menu: 21.1% were between ages 13-17, 16.5% were between 18-25, 14.4% were 26-35, 16.3% were 36-45, 15.8% were 46-55, 5.4% were 56+, and 10.4% were unlisted. Reviewers responded to four yes or no questions about phone usage: 33% selected yes for “heavy talker”, 62% selected yes for “turbo texter”, 11% selected “continuous surfer”, and 18% selected “social networker” (reviewers could select more than one).
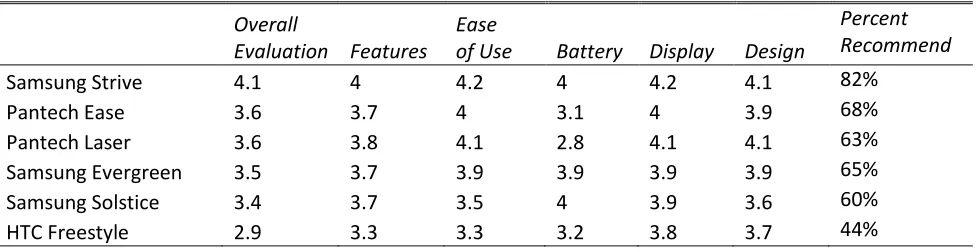
[image:26.612.64.554.369.495.2]The overall evaluation for the six phones, the five attributes, and the percentage of participants recommending the phone are presented in Table 2-1. In these real-world data, evaluations are usually in the form of Likert scales while recommendations are typically on binary scales. We address this confound through statistical modeling.
Table 2-1: Product Rating Averages on 1-5 scale
Overall
Evaluation Features
Ease
of Use Battery Display Design
Percent Recommend
Samsung Strive 4.1 4 4.2 4 4.2 4.1 82%
Pantech Ease 3.6 3.7 4 3.1 4 3.9 68%
Pantech Laser 3.6 3.8 4.1 2.8 4.1 4.1 63%
Samsung Evergreen 3.5 3.7 3.9 3.9 3.9 3.9 65%
Samsung Solstice 3.4 3.7 3.5 4 3.9 3.6 60%
HTC Freestyle 2.9 3.3 3.3 3.2 3.8 3.7 44%
A cross-tabulation of evaluations and recommendations shows that when the overall evaluation was 5 stars, 100% of the reviewers recommended the phone. With an overall evaluation of 4 stars, 95% of the reviewers recommended the phone. Recommendations dropped to 27% for phones with 3 star evaluations, and to 4% and 0% for phones with a 2 star evaluations and a 1 star evaluation, respectively. The point biserial correlation between evaluation and recommendation was .84, X2(4) = 573.7, p < 0.001. This suggests that overall evaluation was significantly related to whether the phone was also recommended.
20
independent variables. All five attributes were significant predictors of the overall evaluation (p < 0.01), demonstrating that all were contributors to, and unique predictors, of the overall evaluation. Similar results were observed with proportional-odds ordinal regression.
A logistic regression was then performed on the binary recommendation data. Features, Ease of Use, Battery, and Design were all significant predictors (p < 0.001), and Display was a marginally significant predictor (p = 0.071). Similar results are observed when the nested structure of the data was included in the analysis (i.e., 120 reviews nested within 6 phones) through random intercept generalized linear regression models (identity function link for evaluation, logistic link function for recommendation), with the exception that for recommendation the Display variable is also statistically significant in this analysis, p = 0.03. This suggests that all five attributes were related to the decision about whether to recommend the phone.
Another analysis was performed using the seemingly unrelated regressions (SUR) framework to model the correlation between the evaluations and recommendations in the context of the full model. The results were the same as with the separate regressions. All five attributes were significant predictors (p < 0.01) of the overall evaluation, and four attributes (Features, Ease of Use, Battery, and Design) were significant predictors of the recommendations (p < 0.001), while Display was again marginally significant (p = .061). Thus, the findings from the separate regressions remain significant even after controlling for the correlation between evaluations and recommendations.
21
[image:28.612.85.533.276.448.2]branches. A Bonferroni corrected p value is provided next to each predictor variable. The first tree (see Figure 2-3) presents the results for the overall evaluation, and depicts a boxplot for the n participants who followed each path in the tree (n is printed above the boxplot). The top node predictor was Ease of Use, with a break point of three. When Ease of Use was ≤ 3, then Features was the second most important predictor; however, when Ease of Use was > 3, then Design emerged as the second most important predictor. The tree displayed in Figure 2-3 continues through one more branching process showing that all five variables contribute, with Ease of Use emerging as a key variable in predicting whether the median evaluation is high or low.
Figure 2-3: Tree Predicting Overall Evaluation
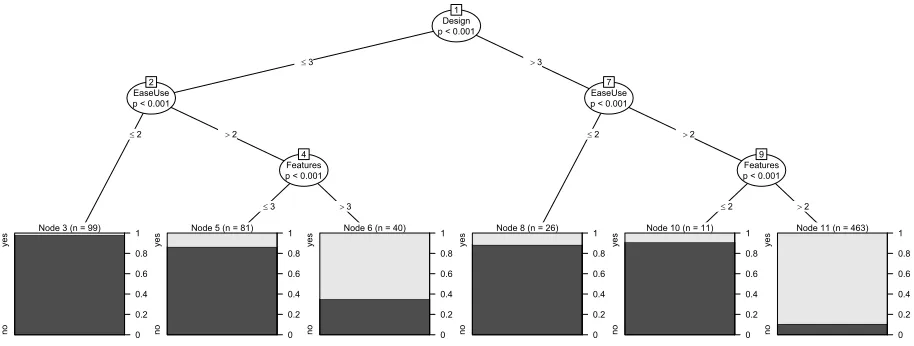
The second tree (see Figure 2-4) involves the recommendation variable (a binary variable), and includes a bar graph indicating the percentage of “no” responses at the end of each branching process. We found that Design becomes the most important predictor of recommendations, with Ease of Use and Features as the second and third most important predictors, respectively. This figure illustrates the complicated interaction patterns that tree analysis can detect. For example, for weak Designs that are perceived as Easy to Use (> 2), Features becomes the key variable determining whether the phone is recommended or not. Even a phone with a good Design (> 3) and reported to be Easy to Use (> 2) may not be recommended if the Features are not evaluated positively.
EaseUse p < 0.001 1
£3 >3
Features p < 0.001 2
£2 >2
Display p < 0.001
3
£3 >3
Node 4 (n = 80)
1 2 3 4 5
Node 5 (n = 18)
1 2 3 4 5 Design p < 0.001
6
£2 >2
Node 7 (n = 34)
1 2 3 4 5
Node 8 (n = 107)
1 2 3 4 5 Design p < 0.001
9
£4 >4
Design p < 0.001
10
£3 >3
Node 11 (n = 64)
1 2 3 4 5
Node 12 (n = 155)
1 2 3 4 5 Battery p < 0.001
13
£3 >3
Node 14 (n = 58)
1 2 3 4 5
Node 15 (n = 204)
22
Figure 2-4: Tree Predicting Recommendation
For recommendations, Design was the first cut predictor, followed by Ease of Use at the second level, and finally Features.
These results show that reviewers used different weights and attributes depending on whether they were evaluating a product for themselves, or recommending it for others. We hypothesized that an even weighting of attributes would be used for evaluations, with a few primary attributes used for recommendations. The regression data shows some evidence for this hypothesis. All five attributes were significant predictors for evaluations, but only 4 out of 5 were significant for recommendations. The conditional tree algorithm, which demonstrated that all 5 attributes were used for evaluations, but only 3 attributes for recommendations, also supports this hypothesis.
Discussion
Based on construal theory, we predicted that evaluations would give more weight to concrete attributes easily related to oneself. The results show Ease of Use was the key predictor of evaluations, followed by Features and Design. For recommendations, the evaluability hypothesis predicted greater weight for easily justifiable, observable attributes, such as Design and Features. The results for recommendations partially support this prediction, with Design as the key predictor, followed by Ease of Use and Features. This latter finding is contradictory to a
Design p < 0.001
1
£3 >3
EaseUse p < 0.001 2
£2 >2
Node 3 (n = 99)
no ye s 0 0.2 0.4 0.6 0.8 1 Features p < 0.001 4
£3 >3
Node 5 (n = 81)
no ye s 0 0.2 0.4 0.6 0.8
1 Node 6 (n = 40)
no ye s 0 0.2 0.4 0.6 0.8 1 EaseUse p < 0.001 7
£2 >2
Node 8 (n = 26)
no ye s 0 0.2 0.4 0.6 0.8 1 Features p < 0.001 9
£2 >2
Node 10 (n = 11)
no ye s 0 0.2 0.4 0.6 0.8
1 Node 11 (n = 463)
23
construal level prediction that recommendations for others would focus on more abstract attributes.
Evaluating a product’s Ease of Use requires experience using the product (Billeter, Kalra, & Loewenstein, 2011). Reviewers could view their ease of use experience as reflecting their own abilities, and therefore place less weight on it when considering recommendations for others. More observable attributes, such as Design and Features, may seem more important to consider when making recommendations to others.
One potential limitation of the study is that subjects could have interpreted terms such as “Design” and “Features” differently. A follow-up study asked 15 new participants to define each of the terms from the ratings task. We found that these definitions were consistent among individuals. “Design” was defined by most subjects as the “look and feel” of the phone, including aesthetics and “fit in one’s hand.” “Features” was defined as the capabilities of the phone beyond the basic calling functions (whether it had applications, a camera, internet access, etc). “Ease of Use” was defined as how quickly and easily one was able to complete and learn to perform tasks. “Battery” was defined as how long the battery lasts between charges. And “Display” was defined as screen brightness, clarity, and size. It appears people shared an understanding of the ratings task questions.
This study examined basic cell phones without the enhanced features of smartphone technology. In a second study, we repeated the methodology using smartphone products in order to determine whether the findings were generalizable to more sophisticated technical products.
Study 2: Smart Phones
Our predictions for discrepancies in evaluations and recommendations were the same for smartphones as for more basic phone products. Based on the evaluability hypothesis, we predicted that recommendations give more weight to observable attributes such as “design” and “features” because they can be justified to others. For evaluations, following construal theory, we predicted that evaluations give more weight to concrete attributes that are easy to relate to oneself.
24
For study 2, smartphone reviews were collected using the same US cellular phone company website as in Study 1. One hundred and twenty reviews were recorded for each of 6 different models of phones. The phones represented 3 different manufacturers and 3 different operating systems. Four phones used the Android Operating System, 1 used the Windows Operating system, and 1 featured the Blackberry operating system. The method followed the randomized sampling of recent reviews described in Study 1.
Results
Reviewers were 38.8% female and 50.6% male (10.4% unlisted). Reviewers reported their age in ranges on a dropdown menu: 6.7% were between ages 13-17, 22.8% were between 18-25, 24.1% were 26-35, 18.4% were 36-45, 12.1% were 46-55, 6.5% were 56+ (9.5% were unlisted). Reviewers responded to four “yes or no” questions about phone usage: 37% selected “yes” for “heavy talker”, 64% selected “yes” for “turbo texter”, 60% selected “continuous surfer,” and 54% selected “social networker.” A single user contributed 2 reviews for the Samsung Captivate, so the second review was dropped from the analysis.
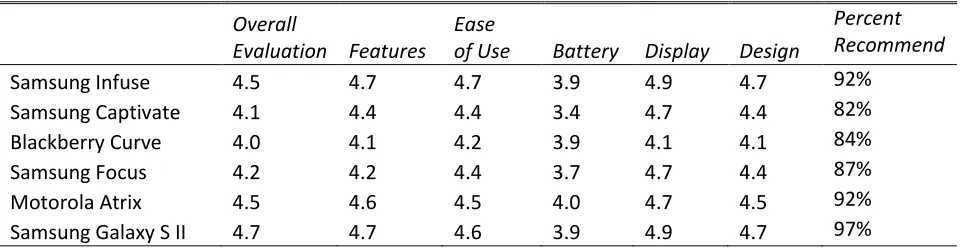
[image:31.612.67.549.460.584.2]Descriptive statistics for the overall evaluations, the ratings on the five attributes, and the percentage of recommendations are presented in Table 2-2.
Table 2-2: Smartphone Product Rating Averages on 1-5 scale
Overall
Evaluation Features
Ease
of Use Battery Display Design
Percent Recommend
Samsung Infuse 4.5 4.7 4.7 3.9 4.9 4.7 92%
Samsung Captivate 4.1 4.4 4.4 3.4 4.7 4.4 82%
Blackberry Curve 4.0 4.1 4.2 3.9 4.1 4.1 84%
Samsung Focus 4.2 4.2 4.4 3.7 4.7 4.4 87%
Motorola Atrix 4.5 4.6 4.5 4.0 4.7 4.5 92%
Samsung Galaxy S II 4.7 4.7 4.6 3.9 4.9 4.7 97%
25
correlation between evaluation and recommendation was 0.72, 2(4) = 442.8, p < 0.001. Again, the two tasks of evaluating the product and recommending it for others were strongly correlated.
The results were then collapsed across all six smartphones (n = 719). A linear regression was conducted with overall evaluation as the dependent variable, and the attribute ratings as the independent variables. Features, Ease of Use, Battery, and Design were all significant predictors (p < 0.001), but Display was not a significant predictor (p = .944). Similar results were observed with proportional-odds ordinal regression. A logistic regression was performed on the binary data for recommendations. Features, Battery, and Design were significant predictors (p < 0.001), Ease of Use was marginally significant (p = 0.054) and Display was not a significant predictor (p = 0.214). Identical statistical patterns were observed with generalized linear mixed models that accounted for the nesting of reviews within phones.
The SUR model analysis found that for evaluations and recommendations, all of the attributes were significant (p < 0.001) except for Display (p = 0.94 for evaluation and p = 0.18 for recommendation). Thus, Display does not appear to be a key predictor for reviewers evaluating and recommending smartphones. One possibility is that the Display variable exhibited a restriction in range given that all devices were smartphones. Seventy-seven percent of the Display ratings were perfect “5”s (in contrast to 43% in Study 1). This diminishes the role for display as a weight in either type of judgment.
26
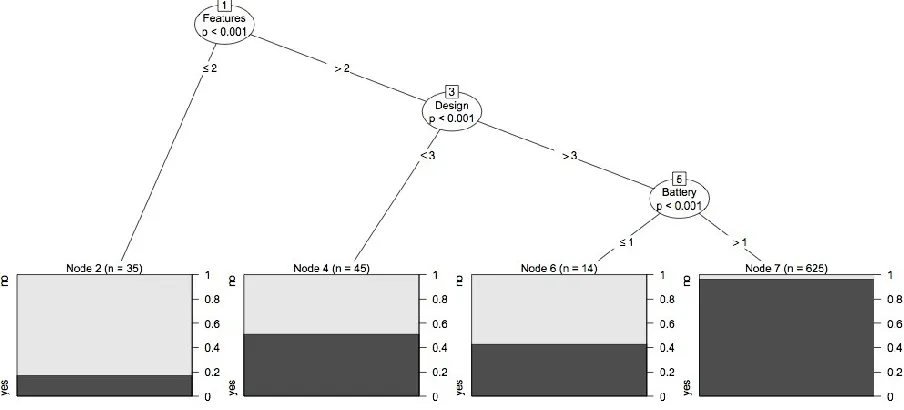
Figure 2-5: Tree Predicting Overall Evaluation
27
Figure 2-6: Tree Predicting Recommendation
In Study 2, the results for evaluations showed that Features, Ease of Use, Battery, and Design were all significant factors, but Display was not. For recommendations, Features, Battery, and Design were significant factors, and Ease of Use was marginally significant, but Display was not. The conditional tree analyses showed Features, Ease of Use, and Battery as prominent factors for evaluation, while the pattern for recommendation featured Features, Design, and Battery.
Discussion
[image:34.612.56.556.532.626.2]These results from a sample of smartphone reviews differ somewhat from those in Study 1 with non-smartphone products. For the non-smartphones, evaluations were predicted by Ease of Use, followed by Features and Design, while recommendations were predicted by Design, followed by Ease of Use and Features. While the results are similar (see Table 2-3), the smartphone product reviews showed less concern about Ease of Use and more about Features. Apparently, when consumers spend more money for a smartphone, available features (such as internet access and GPS) represent core added benefits over non-smartphones. The smartphone owners are significantly more likely to be “continuous surfers” (X2(1, N = 1430) = 369.8, p < .001) and “social networkers” (X2(1, N = 1430) = 179.8, p < .001). This provides one account for why Features would be the top node for both evaluations and recommendations of smartphones.
Table 2-3: Priority of Top Two Significant Predictors in Studies 1 and 2
Tasks Features
Ease
of Use Battery Display Design
Study 1: Cell phones Overall evaluation 2 1 2
Recommendation 2 1
Study 2: Smartphones Overall evaluation 1 2
Recommendation 1 2
28
Ease of Use was uniquely applied to evaluations but not to recommendations, in support of the hypothesis that evaluations would focus more on ease of use. Design emerged as a secondary node in the recommendation tree, providing partial support for the hypothesis that recommendations focus on observable, easily justifiable attributes. Design was not a significant predictor for evaluations, indicating its unique application to recommendations.
In sum, the comparison of findings from the two studies suggests that different features were weighted more heavily for smartphones than for non-smartphones. Features emerged as a key factor in both evaluation and recommendations for smartphones, while playing a less prominent role in judgments about non-smartphones. However, as in Study 1, different features emerged as most relevant in evaluation compared to recommendation, lending support to the overall hypothesis about discrepancies in judgments between the two tasks. As in Study 1, recommendations involved fewer attributes than evaluations, but recommendations included more attributes with smartphones than with non-smartphones.
Study 3: Linguistic Analysis
29
[image:36.612.73.547.520.705.2]The qualitative responses were analyzed with correlations and regressions to examine the role that emotions play in evaluation versus recommendation. Table 2-4 presents a summary of the correlations and the regression betas for the evaluation and recommendation dependent variables. The number of positive words in the review was positively correlated with each of the five attributes, as well as the overall evaluations and recommendations (r ranges from 0.28 to 0.39, ps < 0.001). The number of negative words in the review was negatively correlated with each of the five attributes, the overall evaluations, and recommendations (r ranges from -.20 to -.27, ps < 0.001). A linear regression was performed with evaluation as the dependent variable and the linguistic categories as independent variables. Both positive and negative emotions were significant predictors of evaluation (p > 0.001). A binary logistic regression was performed with recommendation as the dependent variable; again, both positive and negative emotions were significant predictors (p < 0.001). In both the linear and logistic regressions, the number of self-references was also a significant predictor of evaluation and recommendation (p = 0.001 and p = 0.016, respectively). The likelihood of recommendation and of higher evaluations increased with higher degrees of self-reference. The number of articles (e.g. “a,” “the”) was also a significant predictor for both recommendation and evaluation (ps < 0.001). More articles were associated with increased positive evaluations and recommendations. The other linguistic categories were not significantly related.
Table 2-4: Correlations and Beta Values for Linguistic Analysis Evaluation
Correlation
Evaluation Beta (OLS regression)
Recommendation Correlation
Recommendation Beta Logistic regression
Positive Emotions .394** .374** .377** .346**
Negative Emotions -.271** -.179** -.275** -.355**
Self-References .048 .119** .022 .062*
Social Words .045 .047 .023 .020
Cognitive Words .004 .002 .038 .023
Articles .108** .161** .122** .125
Big Words -.083* -.038 -.071 .008
30
The linguistic analysis demonstrates that consumers matched the emotions in their qualitative review with their quantitative evaluations and recommendations. This finding suggests that the evaluations and recommendations provide a representation of the consumer’s feelings about the product consistent with the narratives provided in their review. These results also suggest emotions play a strong role in product reviews and recommendations.
General Discussion
Studies 1 and 2 support our hypothesis that a different set of criteria are applied to one’s evaluation of a product as compared to one’s recommendation for others. These results suggest that some products can be well liked, yet not receive positive “word-of-mouth” recommendations. Consumers may weight their judgments of products differently when they consider whether others will feel the same about them.
Products showed different weightings of attributes for evaluations compared to recommendations. For non-smartphones that people tend to buy for their simplicity and low price, Ease of Use was weighed more heavily than with smartphones. For non-smartphones, Ease of Use was a first-cut variable for evaluations and a second-cut variable for recommendations. However, for smartphones, Ease of Use was not a predictor for recommendations, and was a second level predictor for evaluations. Instead, judgments about smartphones weighted Features more heavily. While there is substantial overlap in the first-cut predictors, there is a clear difference both in the task (overall evaluation vs. recommendation) and in the type of product (cell phone vs. smartphone).
31
through quotes from the website such as, “… if you are somewhat of a heavy talker…”, “if you are a user who just wants to call and text…”, and “if you’re not a patient person….”.
Based on the evaluability hypothesis, we predicted that recommendations would be most influenced by observable attributes that are easier to justify (Hsee, Loewenstein, Blount, & Bazerman, 1999). The higher level of importance of Design (the “look and feel” of the phone) found for recommendations is consistent with this prediction. These aesthetic attributes are an easy point of focus to justify a recommendation since positive aesthetics influence perceptions of overall product quality (Tractinsky, Katz, & Ikar, 2000). Many would likely find it difficult to recommend an unattractive phone to others even if all other attributes were acceptable simply due to the belief that aesthetics are an important factor for others.
Previous research on self-other differences led to the prediction that recommendations would focus on fewer attributes relative to evaluations. Our studies in the context of cell phone reviews provide some support for this hypothesis, with more factors considered in evaluations than in recommendations.
Finally, the analysis of the free-text responses suggests that recommendation and evaluation are valid indicators of reviewers’ feelings. Reviews containing positive emotions are correlated with positive evaluations and recommendations and negative emotions are correlated with negative evaluations and recommendations.
32
33
Chapter 3: The Influence of Added Features in Product Preferences for
Younger and Older Consumers
Co-Authors: Elliott Manzon Richard D. Gonzalez
Carolyn Yoon Colleen M. Seifert
Abstract
34
Every day, consumers choose products based on what they believe will lead to the greatest satisfaction. However, the new product which consumers buy to make their lives’ better can often lead to a frustrating struggle to figure out how to use the product. The remote control which can set a DVR, cable box, and television often has so many buttons and options that just turning on a single setting can be a challenge.
Prior literature has demonstrated that at the time of purchase consumers prefer products with many features and tend to overlook ease of use (Thompson, Hamilton, & Rust, 2005). Despite the initial attraction of these products, excessive features tend to lead to worse usability and less satisfied customers once consumers use the product. We focus on consumers initial overlooking and underweighting ease of use while focusing on other attributes, which we refer to as the Buyer’s Fallacy. Prior literature has not yet examined whether certain demographics of consumers are able to avoid the Buyer’s Fallacy and attraction of products with many features. We expand on the existing literature by examining how the Buyer’s Fallacy affects older adults. Furthermore, we provide evidence for the process by which older adults avoid products with many features, which provides insight into how the general population can avoid the Buyer’s Fallacy and subsequent feature fatigue.
Background
35
the weightings change and consumers prefer products with fewer features that are easier to use. Construal theory has been used to explain how consumers balance desirability and feasibility (Hamilton & Thompson, 2007). Indirect product experience (pre-purchase evaluation) leads to an abstract construal and therefore a focus on desirability. Direct product experience (using a product) leads to a concrete construal and a focus on feasibility (usability).
Additional features beyond what is necessary for a product can be appealing to consumers for a variety of reasons. Features are an indicator of product capability; each capability is an additional reason to choose the product particularly for products lacking in perceived usefulness (Sela & Berger, 2012). Feature loaded models can also provide social benefits by making consumers of more complex products appear more “tech-savvy,” and open to new experiences (Thompson & Norton, 2011). Even trivial features can be beneficial in helping provide a reason for consumers to choose between multiple competing models when only one model possess a unique feature (Carpenter & Brown, 2000).
A series of studies by Sela and Berger (2012) demonstrated that the number of features can be perceived as a cue for the usefulness of a product. The mere number of product attributes presented influenced choices. Perceptions of utility increased with more features listed even when the content appeared in a different language. More features resulted in increased option attractiveness; however, this effect was more evident when practicality was at issue. In their studies, hedonic choices were made more practical by added features that justified the choice. For utilitarian options, the added features had less impact on choice, presumably because their value was already apparent. In other words, adding features helps when the utility of the product is in question, but less so if it is already justified.
36
Affective forecasting literature has detailed how decisions are based on assessments of how different options will make one feel (Wilson & Gilbert, 2003). People are often poor judges of the impact and duration of future events. Correctly matching one’s needs and abilities to a product can be challenging (Burson, 2007). Consumers tend to display overconfidence in their abilities (Alba and Hutchinson, 2000), which could lead one to over predict the benefits derived from additional product features and display overconfidence in their ability to use these features. Part of the reason why additional features lead to worse outcomes is that consumers do not end up using the features for which they were willing to pay more at the time of purchase (Meyer, Zhao, & Han, 2008). Consumers focus on the benefits of a feature at the time of purchase and do not adequately account for the learning costs. When faced with actually using the product, consumers avoid the short-term cost of learning how to use the new features and therefore often do not utilize them. Problems can still arise when consumers do try new features because they often over predict how long it will take them to learn how to use that feature and abandon the feature all together (Billeter, Kalra, Loewenstein, 2011).
Prior studies have indicated that increasing the number of features increases product desirability despite the usability tradeoff. Could certain consumers avoid the Buyer’s Fallacy by focusing on the importance of product usability? Some successful products targeted at aging consumers, such as the Jitterbug(TM) cell phone, are marketed as simpler designs with fewer features (GreatCall, Inc., 2013). This suggests that older adult consumers could be attracted to products advertising fewer features. Understanding the feature preferences of this group is an important challenge for marketers and product designers with consumers over the age of 60 forming one of the fastest growing demographic segments (United Nations, 2011).
37
(Yoon, 1997) to counteract these effects. Research has found that older adults are better able to regulate their emotions and avoid negative affect (Mather, 2006). Although stereotypes might predict that older adults are prone to avoid risk, such as that associated with buying an unfamiliar product, older adults have generally been found to be no more risk adverse than younger adults (Mather, 2006). Contrary to stereotypes, older adults are not scared of technology and generally hold positive opinions about technologies and the benefits they provide. Motivation to adapt new technology appears to be largely driven by perceived benefits rather than avoiding negatives (Melenhorst, Rogers, Bouwhuis, 2006). Focus groups have found older adults like technology for its support of activities, convenience, and features (Mitzner, Boron, Fausset, Adams, Charness, Czaja, Dijkstra, Fisk, Rogers, & Sharit, 2010). Furthermore, older adult performance using technology devices is also not necessarily worse than younger adults. Older adults were found in two studies to have equal or only slightly worse success relative to younger adults when the interface design on cell phones was simple (Jastrzembski & Charness, 2007; Zeifle & Bay, 2005).
Human factors research has also shown that older adults are better at identifying which aspects of a product’s design are likely to impact usability (Stephens, Carswell, & Schumacher, 2006). As a result, older consumers may be more sensitive to cues relating to ease of use. They may recognize the usability costs of added features and successfully predict that those products will be harder to use. If so, older consumers should demonstrate preferences opposite of the Buyer’s Fallacy: Rather than preferring as many features as possible to maximize the capabilities of the product, older consumers may use the number of features as an index of the difficulty of use, and so avoid products with more numerous features.
38
avoid added features in order to evade usability issues. The present study contributes to the current literature by testing whether a large (but understudied) portion of the population may be avoiding the feature fatigue that results from choosing products with excessive features; that is, focusing on the usability challenge of added features rather than on their potential utility. In the study, we also seek evidence regarding the cognitive processes behind avoidance of the Buyer’s Fallacy; in particular, we predict that:
H1: Older adults will prefer products with fewer features;
H2: Preference for products with fewer features in older adults will be motivated by a desire to avoid negative usability experiences;
H3: Preference for products with fewer features in older adults will be moderated by the ability to evaluate ease of use.
Study 1: Choice among Product Models
In study 1, we investigate hypothesis H1 to determine whether younger and older consumers vary in product choice. We also examine hypothesis H2 to determine how motivation for product choice varies between age groups.
Method
39
ranged from basic, necessary features to superfluous, uncommon features. The model with the fewest features had only the most essential features, the next model had all of the features of the previous model plus the next most useful features, and so on, until the last model with 21 features included all of the features of the previous models plus the least necessary features.
Participants were instructed that price was not a factor. They were asked to select the model that they would most prefer for themselves and then to write a rationale for their choice. This procedure was repeated for three products in the study, including an alarm clock, a digital camera, and a media player. Participants then rated their experience with each of the product categories on a four point scale ranging from 1 = “No experience” to 4 = “Very experienced.” The survey was completed by most participants within two to four minutes.
Results
[image:46.612.67.552.547.685.2]Proportions of participants choosing a product model was compared between older and younger participants for each product using a series of logistic regressions. Younger adults were more likely than older adults to choose the model with 21 features for all three products - the alarm clock (B=1.33, p=.004), digital camera (B=1.76, p≤.001), and media player (B=2.36, p≤.001), (see Table 3-1). Older adults were more likely than younger adults to choose the two simplest models (with 3 or 7 features) for all three products - alarm clock (B=-1.62, p≤.001), digital camera (B=-2.22, p≤.001), and media player (B=-1.60, p≤.001).
Table 3-1: Choice Distribution by Age Group Age Group Model 1
(3 Features)
Model 2 (7 Features)
Model 3 (14 Features)
Model 4 (21 Features)
Alarm Clock Older Adults 18% 48% 21% 13%
Younger Adults 16% 11% 37% 36%
Camera Older Adults 2% 30% 49% 18%
Younger Adults 0% 5% 39% 57%
Media Player Older Adults 21% 34% 29% 16%
40
[image:47.612.207.409.306.365.2]A proportional odds model was calculated to account for the ordinal nature of the data and compare choice differences across models varying in the number of features. A separate proportional odds analysis was computed for each product type with model choice as the dependent variable, age group as an independent variable, and gender and experience with that product category as covariates (see Table 3-2). Age group was a significant predictor of the model choice for each of the three products (p<.001) indicating that older and younger adults make different choices based on the number of features a product has. Gender and experience with each product were not significant predictors for any of the three products. The results of the choice analysis support hypothesis H1 that older adults prefer products with fewer features.
Table 3-2: Significance of Age Group in Proportional Odds Analysis
Beta value P Value
Alarm Clock -.750 ≤.001 Digital Camera -1.078 ≤.001 Media Player -1.110 ≤.001
Younger adults reported similar levels of experience for all three products, and were more experienced than older adults for the digital camera, and media player but reported less experience than older adults with alarm clocks (ps < .05) (see Table 3-3). Older adults reported being most experienced with alarm clocks of the three products (ps < .001).
Table 3-3: Product Experience Means (4 = very experienced)
Alarm Clock Camera Media Player
Older Adults M = 3.48 (SD = .671) M = 2.69 (SD = .861) M = 2.41 (SD = .866) Younger Adults M = 3.11 (SD = .777) M = 3.08 (SD = .802) M = 3.10 (SD = .907)
[image:47.612.59.545.522.567.2]41
[image:48.612.64.547.181.353.2]multiple categories. A second coder was used on a subsample of 60 responses to verify the accuracy of the coding (Kappa = .880, p <.001). The percent of participants providing a specific reason for their choice are shown in Table 3-4.
Table 3-4: Percentage of Responses Mentioning Choice Reason
Age Group Ease of Use/ Avoiding
Excess
Wanting More features
Better Value Familiarity Desire to Learn New Technology
Alarm Clock Older Adults 77% 2% 0% 2% 4%
Younger Adults 57% 31% 10% 2% 0%
Camera Older Adults 40% 9% 0% 4% 11%
Younger Adults 32% 40% 11% 0% 0%
Media Player Older Adults 53% 5% 2% 0% 7%
Younger Adults 26% 38% 3% 3% 2%
Responses were split by age group to compare proportions of older adults to younger adults on how they explained their choices. Chi-square tests were computed to compare the older and younger adults on each of the coded response categories. Older adults were more likely to explain their product choice with responses about the ease of use (e.g. “simpler is less apt to have trouble”, “Model 4 has more functions than I would use; probably a pain to figure out”) for the alarm clock (X2(1, N=105) = 4.47, p=.034) and the media player (X2(1, N=101) = 8.03, p=.005). These responses provide evidence in support of hypothesis H2 that feature avoidance in older adults is motivated by a desire to avoid negative usability experiences.
42
Both age groups were equally likely to mention familiarity as impacting their decisions. Older adults were more likely to mention wanting to learn how to use more complicated digital cameras compared to younger adults (X2(1, N=102) = 6.60, p=.01), suggesting that it is not a fear of technology driving the results and that the older adults who are choosing feature loaded models are doing so out of a desire to learn.
Discussion
The results across all three products demonstrate that younger adults are more likely to choose products with more features, while older adults demonstrate an avoidance of the Buyer’s Fallacy by choosing product models with fewer features in support of hypothesis H1. This finding is noteworthy because prior research has found that consumers prefer more features (Thompson, Hamilton, & Rust, 2005); however, when comparing age groups, it is clear this holds true only for younger consumers. Contrary to previous literature, this study finds that for older consumers, increasing the number of features can be undesirable. This suggests a major portion of the consumer market is sensitive to added features in an unexpected direction.
We analyzed the reasons that participants gave for their product choices. The responses demonstrate that older adults focus on obtaining just the necessary benefits and avoiding the potential negative impact of unnecessary features on a product. Older adults were more likely to mention “ease of use” or “avoiding excess” as their rationale. Younger adults focus on obtaining the additional benefits of more features. Younger adults mentioned “wanting more features” or “getting more value.” Younger adults focused on the potential benefits of features, seeing each additional feature as adding value to the product. In contrast, older adults focused on taking only the features they needed. Common statements from older adults when choosing products with fewer features included, “It has everything I need,” and "Simpler is less apt to have trouble.”