LEABHARLANN CHOLAISTE NA TRIONOIDE, BAILE ATHA CLIATH TRINITY COLLEGE LIBRARY DUBLIN OUscoil Atha Cliath The University of Dublin
Terms and Conditions of Use of Digitised Theses from Trinity College Library Dublin
Copyright statement
All material supplied by Trinity College Library is protected by copyright (under the Copyright and Related Rights Act, 2000 as amended) and other relevant Intellectual Property Rights. By accessing and using a Digitised Thesis from Trinity College Library you acknowledge that all Intellectual Property Rights in any Works supplied are the sole and exclusive property of the copyright and/or other I PR holder. Specific copyright holders may not be explicitly identified. Use of materials from other sources within a thesis should not be construed as a claim over them.
A non-exclusive, non-transferable licence is hereby granted to those using or reproducing, in whole or in part, the material for valid purposes, providing the copyright owners are acknowledged using the normal conventions. Where specific permission to use material is required, this is identified and such permission must be sought from the copyright holder or agency cited.
Liability statement
By using a Digitised Thesis, I accept that Trinity College Dublin bears no legal responsibility for the accuracy, legality or comprehensiveness of materials contained within the thesis, and that Trinity College Dublin accepts no liability for indirect, consequential, or incidental, damages or losses arising from use of the thesis for whatever reason. Information located in a thesis may be subject to specific use constraints, details of which may not be explicitly described. It is the responsibility of potential and actual users to be aware of such constraints and to abide by them. By making use of material from a digitised thesis, you accept these copyright and disclaimer provisions. Where it is brought to the attention of Trinity College Library that there may be a breach of copyright or other restraint, it is the policy to withdraw or take down access to a thesis while the issue is being resolved.
Access Agreement
By using a Digitised Thesis from Trinity College Library you are bound by the following Terms & Conditions. Please read them carefully.
Temporal and spatial dynamics of fisheries
discards from Irish waters
Mafalda Viana
Thesis submitted to the University of Dublin, Trinity College, for the degree of Doctor of Philosophy
J
TRINITY COLLEGE 2 k MAY 2013LIBRARY DUBLIN ^
Declaration
\ J ■■ . i'Vf <. . J
’ »"k H • 'V •.' •■ ■ • V .
J' - _v.-
t:--Ii'- I ‘‘i 'In '■ •. “s' .• ' I ' , • , II , • I ^ -.111 _ ' ■
■ . V • :
M-S’. *
I
' '• .1 ' • .■•-,1 •. I r • 1 '
II .'V ’ll, -.1 • •• .
•J •. 1 ' ■ i-,.' X:,.'
II ^ 11
■ "
^
,
■" V .11 • - “ r ^" I ■ „ »■> * - ^ ■ i '.iC. r
V-:,
>"■
'^•1*.,^ ^ Vi" - ' r"' ' H r ’ >J ■ ' U r* !p L-pftfci/ V .*M -V - i^-v c’ .-'.I .
K " *'Jt «. r >1" ' •.* r- . . ’ H ^1-:
11*^ ■ ' ini" i"!' • s I '! Ill .’I I. c'" 'll ji ■■ 1 •.'' -■f •' ‘ !;■ ' . 1 V ■• .1 •."
^ ^■ 1 . I • ' "v. ' ‘ ■
,1 iri*
u I - -I , 'ir- i\ r
I I
< II 1 ii
■< N i :'.v I t I • • • II I ii
1 . : ■■ i'
^ I. V , •- l-f.
\\ •' -.ll n. ri'i.
r .11 II I
/i:.. J1-1
=-’ r-/ — — St
1
Summary
There is worldwide recognition that fisheries discards (i.e. the portion of the catch returned to sea) are not only a waste of resources but are also responsible for numerous adverse ecological impacts in the marine environment. Indeed, the discards mortality rate can be as high as 100% and fisheries such as Nephrops trawls discard approximately 60% of their total catch. Therefore, with the evolution of fisheries management strategies from being concerned with single stocks to ecosystem-based fisheries management (EBFM), discards is becoming an increasingly important topic. EBFM recognises that fisheries should be managed taking into account their effects on, and interactions with, the ecosystems to which the target species belong. As such, to sustain healthy marine ecosystems and preserve the services that depend on them, it is crucial to fully understand the impacts of discards and to find ways to mitigate and incorporate them in any fisheries or marine ecosystem assessment.
This thesis has three main objectives: (1) characterise the spatial and temporal patterns of discarding in the Irish Sea in order to suggest adequate mitigation plans. Spatial and temporal controls and restrictions to fishing in areas with high concentrations of juveniles or unwanted species, most of which are discarded, have been recognised as one of the most effective ways to mitigate discards. However, very little is still known about their spatio-temporal distribution mainly owing to the lack of data but also the complexity of the methodologies required; (2) further the understanding of discards as a constituent of fishing impacts on marine biodiversity. Discards are considered a key component of fishing impacts worldwide but to date there is little or no empirical evidence supporting this belief. Additionally, studies that provide ways to assess these impacts for management purposes are also missing and; (3) provide modeling frameworks to quantify and describe discarding patterns and processes that can be extended to any fishery and that can be used to compare and contrast various management options.
These objectives are achieved by modelling discards data collected during 17 years by the Irish onboard observers programme. Most methods developed in this thesis are implemented under a Bayesian framework, owing to its ability to estimate uncertainties, include prior knowledge and its flexibility to combine various distributional and functional forms that allow for a more complete description of the data.
temporal closures (e.g. every second year) should be implemented over spatial closures to mitigate discards in the Irish Sea. However, these temporal controls should be coupled with other measures targeting certain characteristics of the fishing trip. The temporal patterns of discards from three commercially important species, haddock {M. aeglefinus), whiting {M. merlangus) and cod (G. morhua) in the Irish Sea were therefore investigated further through temporal harmonic regressions. The results corroborate the suitability of temporal controls to mitigate discards as they reveal annual cycles of discards that peak in late Spring. This reflects the species biology and fisher behaviour and can be used to mitigate discards.
To understand the impacts of discards on the ecosystem and inform management decisions, several aspects of discards biodiversity were investigated. A comparison of the relationships among seven key ecological metrics calculated for landings and discards with those calculated for catch show that ignoring discards can lead to both less accurate and less precise estimates of fisheries impacts in Irish waters. Notable effects are the overestimation of the mean tropic level and the underestimation of the diversity impacted. Additionally, a multinomial harmonic regression on the discards composition in the Irish Sea illustrated that discards assemblage composition has changed over time indicating either shifts in the fishing behaviour or in environmental conditions. Linear regressions on various diversity indices detected an increase in the mean trophic level and biodiversity of the Irish Sea discarded assemblage. The results suggest that already implemented management strategies, such as improved gear selectivity, are being successful in reducing the capture of smaller and lower trophic level fish. Nonetheless, the proportion of rare species caught has increased which makes fisheries management more complex, especially owing to the presence of species inter-dependencies. Impacting one species seems to influence the dynamics of other discarded species. Overall, the results highlight that discards are key to gain a robust picture of the fisheries impact in order to implement a robust EBFM approach to fisheries in Ireland.
Acknowledgements
A research project is never a one person job, as such it is a pleasure to thank the many people who made this thesis possible.
It is difficult to overstate my gratitude to my PhD supervisor, Dr. Andrew Jackson. His enthusiasm, guidance and encouragement throughout my PhD years made this thesis possible.
I will be eternally grateful to Dr. Andrew Parnell for the support and comments on my work but above all for the invaluable statistical advice, innumerable hours of coding and debugging and for making statistics fun and easy (easier). I would have been lost without him.
Special thanks are due to Dr. Norman Graham for making me step back at the right times in order to regain perspective of my work and also for the enthusiastic discussions about fisheries. Because of him, I finish this PhD with enough ideas for a second PhD.
I would also like to thank my steering committee advisors: Dr. Ken Irvine and my co supervisor Prof. James Wilson; and the many people who provided insightful discussions and commented on my work: Dr. David Reid, Dr. Ian Donohue, Dr. Tamara Jurca, Celine Bourdon, Dr. Colby Tanner and Sara-Jane Moore. They all helped steer my research to a better place.
Finally, I am forever indebted to Luke McNally for enduring my many frustrations and mood swings, for his understanding and endless patience to discuss ideas when it was most required. His unequivocal support throughout often drag me back to sanity.
Table of Contents
Declaration i
Summary iii
Acknowledgements v
Table of contents vii
Glossary x
CHAPTER 1. General introduction 1
1.1. Ecosystem-based fisheries management ... 3
1.2. Concept and drivers of discards... 4
1.3. Significance of discards... 5
1.4. Discards management... 7
1.5. Discards in Irish waters ... 9
1.6. Research outline... 9
CHAPTER 2. Material & Methods 13 2.1. Discards data... 15
2.1.1. Irish discards data collection ... 15
2.1.2. Raising procedure...17
2.1.3. Irish discards data...17
2.2. Methods...19
2.2.1. Bayesian inference... 20
2.2.2. Bayesian fitting via MCMC ...22
2.2.3. Bayesian model evaluation...23
3.2. Methods... 29
3.2.1. Data...29
3.2.2. Analyses... 29
3.3. Results ... 32
3.4. Discussion ... 38
CHAPTER 4. Quantifying hierarchical variability in discards across Irish waters 41 4.1. Introduction... 43
4.2. Methods... 45
4.2.1. Data... 45
4.2.2. Analyses... 45
4.3. Results ... 46
4.4. Discussion ... 47
CHAPTER 5. Disentangling spatio-temporal processes that drive discards 51 5.1. Introduction... 53
5.2. Methods...56
5.2.1. Discards data...56
5.2.2. Hierarchical predictive process... 56
5.3. Results ...61
5.4. Discussion ... 66
5.4.1. Methodology performance & other applications...68
5.5. Conclusions...70
CHAPTER 6. Temporal trends and oscillations of discards 71 6.1. Introduction... 73
6.2. Methods...74
6.2.1. Data... 74
6.2.2. Time-series analysis...76
6.3. Results ...78
6.3.1. Long-term trends... 78
6.3.2. Seasonal trends... 78
6.4. Discussion ... 82
6.4.1. Long-term trends... 82
6.4.2. Seasonal trends... 82
CHAPTER 7. Temporal patterns in the species composition of discards 85
7.1. Introduction... 87
7.1.1. Why monitor discards species composition?...88
7.2. Methods... 89
7.2.1. Data... 89
7.2.2. Composition model...90
7.2.3. Biodiversity indices...93
7.3. Results ... 94
7.3.1. LASSO regression...95
7.3.2. Composition over time... 96
7.3.3. Biodiversity indexes... 99
7.4. Discussion ...101
CHAPTERS. General discussion 105 8.1. Tactical mitigation ... 107
8.2. Managing the impacts of discards ...108
8.3. Bayesian methods and discards data... Ill 8.4. Conclusions... 114
References 115
Appendix A 133
Appendix B 135
Appendix C 140
Appendix D 149
0 ' n %t •
-‘ • 1 \y
■(;•-•
I • - •4 • I HJ
r M,'l, '
' I- ■ . ''*• I 'V
.• • ■ • K- •:' i i' j "•'<
IlJ'" 1 *“ •" ‘ .■« ■^-: ■'. ./ r
i-t, :< .
M'. iS ' .
Kr' '•' « : ' ' I
r
lli, -,.1' ■ ■ .
-■ I*- - :■
■V K \i
ft -'"A, ’ *' ■ “"if*. -4 ■*’
I ^ -.J.. .• - • I M J,_ .'.r. •■•■ •
I
Glossary
AlC Akaike information criterion. Measure of the relative goodness of fit of a statistical model.
By-catch Portion of the catch caught incidentally to the target species.
Catch Total number (or weight) of organisms caught by fishing operations. Catch=Discards+Landings.
CFP Common Fisheries Policy. Fisheries policy of the European Union. OCR Data Collection Regulation. Legislation and guidelines to collect both
economic and biological data about all aspects of fisheries management in the European Union.
Die Deviance Information Criterion. Measure of the relative goodness of fit of a Bayesian statistical model.
Discards Portion of the catch returned to sea during a fishing operation. Dpue Discards per unit effort (kg.h'').
EBFM Ecosystem-based fisheries management.
FAT Fisheries Assessment Technician. Observer for the discards sampling programme.
HREG Harmonic regression. Method to describe time series that show cyclical pattern.
ICES International Council for the Exploration of the Sea. Intergovernmental organisation concerned with marine and fisheries science.
JAGS Just Another Gibbs Sampler. Software to perform Bayesian statistics. Landings Portion of the catch brought ashore from a fishing operation.
LASSO Least absolute shrinkage and selection operator. Statistical method of regularization.
Ml Marine Institute. Ireland's national agency responsible for advice on and implementation of marine research, technology, development and innovation policy and marine research services.
Metier Homogeneous subdivision of a fishery by vessel type and target species assemblage.
MLS Minimum landing size. Smallest length at which it is legal to land a fish. MTL Mean trophic level. Indicator of the position a group of marine organisms
takes in a food chain.
0TB Otter board trawl. Type of fishing gear.
PP Predictive Process. Gaussian process for large spatial datasets.
RF Raising factor. Value used to scale discards from a sample to haul level. TAG Total allowable catch. Catch limits that are set for most significant
commercial fish stocks.
TBB Beam trawl. Type of fishing gear. TWR Twin rig otter trawl. Type of fishing gear.
VMS Vessel monitoring system. Satellite-based positional tracking system for monitoring the location of fishing vessels.
WinBUGS Bayesian inference Using Gibbs Sampling. Software to perform Bayesian statistics.
Chapter 1
1.1. Ecosystem-based fisheries management
In the last century, following the world’s industrial revolution, fishing moved from an artisanal and relatively small-scale activity to a high technology and large-scale activity (Kesteven 1996, Pauly et al. 2002). Developments in naval architecture such as the steam engine and subsequently the trawling, navigational equipment and sonar technology to find fish greatly increased the power and efficiency of fishing units, which coupled with new investment, allowed the fishing industry to grow to the level we currently witness (Kesteven 1996, Graham 2006). The consequence of this expansion was the instigation of overfishing (Jackson et al. 2001, Pauly et al. 2002) which is believed to be steadily transforming marine ecosystems into depauperate systems (Cochrane 2001, Jackson et al. 2001, Loreau et al. 2001). According to a Food and Agriculture Organization (FAO; FAO 2008) estimate, over 52% of the world’s fish stocks are fully exploited, 19% overexploited and at least 8% are depleted. However, fishing is central to the livelihood and food security of millions of people around the world. For these reasons, finding ways to maintain fishing at a sustainable rate so that future generations can also prosper from it, is the ultimate goal of all the world’s nations that depend on and exploit the marine environment (Rosenberg etal. 1993, Cochrane 2001, Pauly etal. 2002).
EBFM is aimed at individual fisheries but considers their effects on, and interactions with, the ecosystems to which the species belong, and also the human dimensions of fisheries and their relationships with other marine activities (Rudd 2004, Bellido et al 2011). The goal is to maintain a healthy, productive and resilient ecosystem in order to safeguard its services to future generations (FAO Fisheries Glossary, http://www.fao.org/fi/ glossary/default.asp). How to achieve this new ethos is still a work in progress. However, there is a general consensus that incorporating both target and non-target species (i.e. total catch) in fisheries assessments is one of the key factors (if not the most important one) to its success (Bellido etal. 2011).
1.2. Concept and drivers of discards
Catch consists of two components, landings and discards. Landings are the portion of the catch that is brought ashore and it may consist of target and non-target species. Non target species are also called by-catch which is the term given to the portion of the catch caught incidentally. Some by-catch species have economic value and are landed, others are returned to sea. The portion of the catch that is returned to the sea is called discards. It is estimated that approximately 7 million tonnes of organisms, corresponding to 8% of the total world catch, are discarded annually by the worlds fisheries (Kelleher 2005). From those, 1.3 million tonnes are thought to have been discarded by the Northeast Atlantic fisheries.
There are a variety of factors driving discards that form a complex network of often cyclical causes and effects (Cuclas 1997, Catchpole etal. 2005). The spatial coexistence of marine species combined with imperfectly selective gear and incentive-distorting management policies (e.g. quotas and minimum landing size, hereafter MLS) lead a significant portion of catch to diverge from the desired species, sex, body condition or size, which ultimately culminates in discarding (Abbott and Wilen 2009). In the EU, the main reasons for discarding are likely to be linked with economic/market considerations or to comply with legislation.
such, unless the quotas are exceeded, discards of marketable species consist mainly of juvenile individuals smaller than the MLS (Alverson et al. 1994). However, if the quotas are not exceeded and the fish is above the MLS, personal and economic considerations can drive discards. In this case, discards of marketable individuals would likely have a low value in the market owing to price fluctuations, poor body condition or undesirable size (e.g. high-grading, when only large individuals are kept as they are more valuable). Since non-marketable species are not managed and are worthless in the markets, discards occur regardless of the amount caught, size, species or body condition of the individuals.
Despite being a legal requirement in many countries, discarding is often seen as a waste of resources. Societal demands to reduce discarding and other impacts associated with fishing (in particular with trawling owing to its damage to the sea floor) are therefore growing which increases the pressure on policy makers, fishermen and scientists to find mitigation tools and solve the discarding problem (Hall and Mainprize 2005, Zeller and Pauly 2005, Zhou 2008, Bellido et al. 2011). Discards of charismatic species such as marine mammals and turtles is one of the most recognised and emotive bycatch issues (Graham 2006). In March 2007, the European Commission issued a communication “on a policy to reduce unwanted by-catch and eliminate discards in European fisheries". According to the European Common Fisheries Policy (hereafter CFP), this overall objective should be achieved fishery by fishery, using discard bans and supplementary measures to reduce by-catch and should be seen as an integral part of the EBFM, reaching maximum sustainable yield by 2015.
1.3. Significance of discards
(e.g. Van Opzeeland et al. 2005, Votier et at. 2004), increased food for scavengers such as sea birds and changes in the benthic community structure (Brown et at. 2005). Economically, the impact of discarding is determined mainly by the costs associated with the act of discarding (e.g. loss of potentially valuable catch and time spent sorting) and the costs tied to objectives of monitoring or preventing discards. For example, the costs of new technology required by changes in the law to prevent discarding (e.g. gear alterations) and the costs of running discards sampling programmes are typically high. Furthermore, discarding leads to non-productive work by the fishermen (e.g. sorting the catch by species and size instead of active fishing or preparing the landings to enter the market) increasing further the costs associated with discarding (Alverson etal. 1994).
Much more work is needed to adequately assess the true costs and benefits of discards and discards mitigation plans to society as a whole. We should not forget that not all of the biological or ecological impacts of discards are considered negative. Hill and Wassenberg (1990) and Votier et al. (2004) for example, discuss that discarding from trawls transfers large quantities of biological material from the bottom to the surface, making otherwise inaccessible food available to surface scavengers such as sea-birds. Furthermore, in many cases, discarding practices allow fisheries to remain cost effective since only valuable species are landed (Clucas 1997). The potential discard value must therefore be balanced against the conservation and sustainability needs of the fishery.
the market price of the by-catch is typically low.
Finding the balance between over-compensation and encouragement is therefore crucial. The enforced landing of specimens that should not have been caught in the first place, some of which could have survived, brings its own conservation or management problems (Alverson et al. 1994). For example, what to do with this illegal fish is still a contentious topic as the market for sensitive species should not be promoted and fish processors should not be made to buy this fish. However, if nothing is done with the fish it will be dumped anyway without benefiting either the fishermen or the ecosystem (Alverson et al. 1994, Clucas 1997). These are some of the reasons governing entities such as the EU feel the need for further studies considering the implications of discards and a possible ban.
1.4. Discards management
Discarding is recognized as a significant problem in fisheries worldwide. As such, the main goal of a fisheries manager is to create a plan that meets multiple socio-economic and biological objectives, while limiting or preventing discarding (Hall et al. 2000). As discussed in Section 1.2 of this thesis, discarding practices are determined by a wide range of factors, which makes it difficult to attribute changes in discarding to a single regulation. Furthermore, management strategies are typically aimed at protecting one species, which can enhance bycatch or discards of other species (Kelleher 2005).
now the fleets that make the highest contribution to fishing mortality. This includes fleets with high discard rates associated with high fishing effort. Trawl fisheries in particular, are associated frequently with high levels of discards (indeed 60% discard rates are common), especially in mixed demersal fisheries (Kelleher 2005, Catchpole and Revill 2007). Studies that describe and characterise discards are therefore essential to understand how to manage discards while maintaining sustainable fisheries.
Until recently, most studies on discards provided a qualitative description of its causes and effects on fisheries and ecosystems (Alverson 1994, Clucas 1997, Hall 2000, Catchpole et at. 2005). However, over the last decade considerable effort has been made to increase the knowledge about discarding in worldwide fisheries (Catchpole et at., 2008, Kelleher 2005, Worm et at. 2009). The United States Sustainable Fisheries Act 1996 (Magnusun-Stevens, 1996) and European legislation (EC 1639/2001) both identify the need to collect accurate discard data and lay out guidelines for their collection. Consequently, data on discards has become more widely available (ICES 2006, Punt et at. 2006) which opened a door for the development of discards management plans.
1.5. Discards in Irish waters
In Ireland, the discarding process and motivations are similar to the European and broader international context described above. To date, few studies have evaluated the Irish discarding process. Of those studies, most were concerned with identifying strategies to improve and describe the discards sampling programme (Allen et at. 2002, Borges et at. 2004, 2005a, 2006, Davie and Lordan 2009, Lordan et al. 2011). These studies focused on optimising the Irish discards sampling strategy. However, they did not investigate the variation of sampling strategies among different fishing areas. In Chapter 4, I investigate the variance associated with the sampling strategies across the different managerial areas in Irish waters.
High discard rates resulting from the low commercial values of the catch, have been reported in the demersal fisheries of the Irish Sea (Brander 1981, Briggs 1985, Casey 1996). In the Irish Sea, discards are a great source of mortality of some species and age groups, particularly Norway pout (Trisopterus esmarkii), juvenile flatfish and rays. More recently, Borges et al. (2005b) showed that the Irish demersal fleet typically discards commercial species belonging to at least four fish stocks considered to be outside safe biological limits: West of Scotland (ICES division Via) haddock {Melanogrammus aeglefinus) and Celtic Sea, Irish Sea and West of Scotland (ICES division Vllg, Vila and Via respectively) whiting {Merlangius merlangus)', and three stocks of unknown population status, i.e. dogfish (Scyliorhinus canicula), bluemouth {Helicolenus dactylopterus) and grey gurnard (Eutrigla gurnardus). There are no further studies on discards composition in Irish waters. However, these studies suggest that in the last decade discards composition may have changed. Between 2000 and 2002, discarding of haddock and whiting were found to increase possibly as a result of a pulse in recruitment in this period, and/or the product of previous high recruitments. However, an investigation of the temporal patterns of discards in Irish Waters spanning more than 2 years is also missing.
1.6. Research outline
to provide a modelling framework to quantify and describe spatio-temporal patterns and processes in discards that can be extended to any fishery. I accomplish these objectives by describing the patterns of discards and its main causes, and by providing a structural framework in which we can compare and contrast various management options aimed at mitigating discards.
Specifically, in this thesis I will develop the following themes;
Chapter 2: The material and methods are presented. A description of the data collection programme and discards dataset used is provided. In this chapter I also introduce Bayesian statistics since most of the methods developed in this thesis were implemented under a Bayesian framework.
Chapter 3: Discards are considered a key component of fishing impacts worldwide. However, to date there is little or no empirical evidence supporting this observation. In this chapter, evidence is provided by comparing the relationships between six ecological metrics calculated for landings and discards with those calculated for catch. The results show that ignoring discards can lead to both less accurate and less precise estimates of fisheries impacts, such as the overestimation of the mean tropic level and the underestimation of biodiversity impacted. This highlights that discards are indeed key to gain a robust picture of the fisheries impact on the ecosystem.
Chapter 4: Discards data have an inherently hierarchical structure in which samples are taken from hauls that are performed during multiple trips by different vessels. In this chapter, I investigate the significance of this hierarchical structure of the data for discards estimates across areas, species and discards metrics in order to inform the remaining analyses in this thesis. Using multilevel analyses, I quantify the discards variability associated with each sampling level. The results show that the sources of variability in Irish waters are changeable in space, are dependent on the choice of discards metric and are species specific. Therefore, not considering the hierarchical structure of the data could bias discards estimates and consequently jeopardize the accuracy of the assessments and mitigations measures implemented. These results are subsequently considered in the following chapters by incorporating this hierarchical structure in the analyses to account for these sources of uncertainty.
Chapter 5: Avoiding or closing areas where discarding is high is one of the most effective ways to mitigate discards. In this chapter, I aim to understand the spatio- temporal patterns of discards in order to identify discarding hotspots. I do this by
developing a Bayesian predictive framework that disentangles the various processes involved in the formation of those spatial-temporal patterns in the Irish Sea Nephrops metier. This approach considers the outcome of Chapter 4 and also investigates the effect of the sampling strategy in determining the discards hotspots. The results reveal that the location and shape of discards hotspots change with the inclusion of sampling structure indicating that its omission from the analyses could lead to inappropriate closures to fishing. Discarding in the Irish Sea is relatively homogeneous in space but the results suggest that temporal closures could be an appropriate mitigation strategy for the Nephrops metier.
Chapter 6: Taking into consideration the results from Chapter 5, in this chapter I characterize the temporal patterns of discarding practices of three commercially important species, haddock (M. aeglefinus), whiting {M. merlangus) and cod (G. morhua) of the Irish Sea. Through Bayesian harmonic regression models I show that discarding of whiting and haddock have increased over time though cod has remained constant. Additionally, both short and long-term cycles of discards were detected. The former were consistent among species and allowed the identification of a peak of discards during late Spring. On the other hand, the long-term cycles are particular to each species and can vary between 5 and 7 years cycles. These patterns reflect species biology and fisher behaviour and can be used to mitigate discards.
f- K ■y
-e _l __ 5a
,''J.-I - ,''J.-I I ' I r-l ..' •. I ■ I-• . I ‘ '
r;-/
. r t;.- ■' ■
? k'-." - ■•r ■'!
c-:r' '■
'. ■••' '■ i' . ' A. ■
i'
i< * I*, » • -'
itiiT I
■ /ia’ •'l..iC‘ I
L. .,n - ’ .. ,y -vu -j , (r"\ i
II I'l / ^ ^
tr r ■' ■ r-' ■
12
t ■ ' ■ iL •
n'
.1 •
■%. -::
Chapter 2
^;<v ", ^ ' I .
. — _ A — »• — I
!?■= «;- I k }..
|| “ ■ :
!j ;r:
X .:<T=- . SijL ... . I ^ C^i j ■ II
liW^I J - 1 „ ' ?„lp^. >1 !:‘l.:'"^
> . . iV
f j II .'r ... 1*. “ftfi,: ■' iiTi-s
j?'Ti'»iii -jE'
H-it'IjJf ;'■ *’ ^ •-'■- - '-...S ^ «■_!_ ,;^i ■ i "■ 1. »* 1 . II ,, II r^^s^i:i:nK t--' ’
!,>■%."'■• if ;■
14
-tjil <;
z' 1 •
^ ■;.i: ? »* «<
r . ".•«-! i
2.1. Discards data
The collection of discards data is essential to sustainably manage marine resources
worldwide and for the success of EBFM (Beliido et al. 2011). Since the establishment
of the Data Collection Regulation (DCR, EC No. 1639/2001) in 2002 by the European
Union, monitoring fisheries discards became a mandatory part of the European fisheries
sampling programme. Previously, the European discard sampling programmes existed
in few countries and were usually funded as relatively short-term projects, rather than
as an integral part of the fisheries information collection process. Ireland is one country
that, under the guises of many EC projects, has been monitoring discarding from the
Irish demersal fisheries since 1994. Even though the sampling frequency prior to the
implementation of the DCR was lower, today Ireland possesses one of most complete
discards datasets available, spanning 17 years with regular sampling throughout. Current
levels of discard sampling in Europe remain low, typically less than 1% of the total effort in
any given fishery. Nevertheless, the way discards data are collected in Ireland is thought
to be representative of the Irish fishing activity (Marine Institute 2009).
2.1.1. Irish discards data collection
The Marine Institute (Ml) in Ireland conducts an extensive data collection programme
involving the sampling of landings at ports, at-sea sampling for discards, analyses of Irish
fleet activity and research surveys on commercial and research vessels. Additionally,
they conduct laboratory-based work on age estimation, egg and larval identification
and histological work on fish reproduction. These data are used in the national and
international stock assessments that form the basis of the scientific advice on the status
of the stocks. The international stock assessments are carried out at the ICES and their
advice is then used by the Irish Government, Fishing Industry and the European Union
in the formulation of management policy for the fisheries resources.
The Ml collects the discards data onboard Irish commercial fishing vessels operating
mainly in Irish waters. The discard data collection programme starts with placement
of Fisheries Assessment Technicians (FATs) in the main ports and is supplemented by
Fishery Sampling Contractors. The FATs and sampling contractors are coordinated to
sample the main fleets in order to accomplish the annual targets established by the ICES.
a metier approach, i.e. depending on the quarter and metier a certain number of trips
are sampled for discards. A metier is defined as a homogeneous subdivision of a fishery
by vessel type and target species assemblage (e.g. Nephrops-directed otter trawl fishery by vessels in the ICES area Vila or Irish Monk and Megrim directed otter trawl fishery
by vessels in the ICES area VIlb, c, j and k). The metiers are defined every year with
regards to the DCR and are based on landings percentage composition. However, most
remain the same year on year. In 2009, the Ml discards sampling protocol referred to
the monitoring of 24 metiers in Irish waters, each to be sampled two or three times per
quarter (Marine Institute 2009).
According to these annual targets, and given skippers agreement to cooperate, FATs
choose the vessels and trips to sample. During each trip, all data relevant to each
haul (e.g. time, depth and coordinates of both shot and haul, sediment type, vessel
characteristics) are recorded. Discards data are therefore sampled at a haul level and
as many hauls as possible are sampled in each trip. Once a haul has been completed
and lowered onto the deck, a visual estimation of the bulk catch is obtained either by
the skipper or the FAT, depending on the level of experience. The bulk catch is usually
estimated in 40kg box equivalents (i.e. how many 40kg boxes the bulk catch would fill).
The total discards weight of a haul is then estimated by subtracting the landings weight
from the total catch weight estimated by the skipper or observer when the bulk catch is
hauled on board.
Afterwards, a random box of discards (assumed to have mass 40 kg) is obtained from
the sorting pound or the conveyor belt. All fish in the box are counted and identified,
whenever possible to the species level. The length composition of all species present
in the box is also recorded, assuring that the discard sample is representative of the
discards taken in the catch. Demersal species are measured to the nearest cm, and
sprat {Sprattus spp.) and herring (Clupea spp.) to the nearest 0.5 cm. In order to collect information on the age and mass of the commercially discarded species, a selection of
five individuals per 1 cm length group is made per species, ICES Division, gear type and
quarter. These fish are stored for later examination in the port laboratories. After all fish
have been sorted and measurements taken, the sampled box will contain the non-fish
discards. These non-fish discards are estimated by measuring the height of what was left
in the box after measuring all fish discards, and converting it into the taken percentage of
the box. Non-fish discards are composed mainly of rubbish, seaweed, stones, molluscs,
jelly fish and crustaceans except for Nephrops in a Nephrops directed fishery.
Finally, the data obtained from the sampling box (e.g. number of fish per species and
size) are raised from the box to the haul level (please see Section 2.1.2 for further details
on the raising procedure) to match the sampling unit (haul) and be used in the various
assessments. All data collected are input into the Ml discard database by each FAT and
verified by the Discard Sampling Coordinator for quality control.
2.1.2. Raising procedure
The total discards per haul are obtained by subtracting the landings weight from the
total catch weight estimated by the skipper or FAT. However, the data obtained from the
sampling box is the discards sample. Therefore, to estimate the total discards of a single
species per haul, the total weight for that species in the sample must be raised to the haul
level. This practice is called the raising procedure. The raising factor (RF) is the ratio of
total weight of fish discards present in a haul to the weight of discards sampled for that
haul. Once the RF is estimated, the total weight discarded of a certain species in a haul
is obtained by multiplying the RF by the total weight of all discarded species in that same
haul. The total weight of a discarded species is, in turn, obtained by a species specific
length-weight relationship derived from several references such as Coull etal. (1989) and
Pereda and Perez (1995) or from the online database FishBase (www.fishbase.com).
To estimate the total discards of fish in a haul (which excludes crustacean, molluscs,
cnidarians etc.), the proportion of non-fish discards in the haul is subtracted from the total
weight of discards in the haul. As the proportion of non-fish discards is obtained from the
discards sample (at the 40kg box level), it is first raised to haul level by multiplying it by
the RF.
2.1.3. Irish discards data
In this thesis, data collected from 1994 until 2009 from all around the island of Ireland
were used. Figure 2.1 shows the geographic location of the starting position of all hauls
sampled for discards by the Ml from 1994 until 2009 (n=6548). Hauls were sampled from
vessels using 20 different gear types in order to accurately represent the fishing activity
in Irish waters. Samples from twin otter board trawls (TWR), otter board trawls (0TB) and
beam trawls (TBB) comprise the majority of the samples, which, depending on the ICES
division, can collectively comprise over 90% of all samples.
Longitude
Figure 2.1: Locations of the starting positions of the hauls sampled for discards (blue dots) from 1994 until 2009 by the Irish Marine Institute. The roman numerals identify the
ICES divisions around Ireland.
The Irish sampling programme defines sampling targets by metiers to ensure coverage of all sectors of the fishing activity. However, stock assessment and other management advice are made by ICES division, which is a broader division that comprises many metiers. Table 2.1 shows the number of hauls sampled in the 9 ICES divisions located around Ireland. Between 1994 and 2009, 6548 hauls were sampled by the Ml under the discards sampling programme. These hauls were sampled during 649 trips that were performed by 308 different vessels operating in the 24 Irish metiers (Table 2.1). The more inshore ICES divisions (Via, Vila, Vllb, Vllg and Vllj) were the most sampled areas as they contain the most important commercial fisheries in Ireland. The Irish Sea, ICES division Vila, was the most sampled division with 1602 hauls sampled for discards from 134 trips and 26 vessels.
In the 6548 samples taken during the 17 years of the discards sampling programme, approximately 160 different species were identified in the samples. From those 160 species, approximately 40 are considered marketable species (e.g. cod [Gadus morhua], whiting [Merlangius merlangus], haddock [Melanogrammus aeglefinus], dab [Limanda limanda], plaice [Pleuronectes platessa], monkfish [Lophius piscatorius], etc.). From the remaining 120 non-marketable species that were discarded, many such as grey gurnard {Eutrigla gurnardus), john dory (Zeus faber) and dogfish (Scyliorhinus spp.) frequently occur in the samples, while others such as pipefish (Indostomus paradoxus), ribbon fish
{Procambarus bivitattus) and blue sharks {Prionace glauca) were rare events.
In the subsequent chapters, different subsets of the data will be investigated depending on the questions addressed. More details on the particular subsets used are given in the respective chapters.
Table 2.1: Number of hauls, trips, vessels and metiers sampled by the Marine Institute in each ICES division from 1994 until end of 2009.
ICES division Hauls Trips Vesseis Metiers
Via 839 74 26 9
VIb 220 12 7 4
Vila 1602 134 55 9
Vllb 1261 122 59 11
Vile 248 33 25 6
Vllf 4 1 1 1
Vllg 1406 136 63 12
Vllj 897 129 65 11
Vllk 71 8 7 3
2.2. Methods
nature of Bayesian inference as it accommodates the increasing need for maximizing all the information available (Punt and Hilborn 1997, Gelman et al. 2004, McCarthy 1997)
and also the need for a more flexible and holistic approach to data analysis, including the estimation of uncertainties in key parameters that in conventional analyses are often
forced to be constant for analytical tractability (Gelman etal. 2004). Additionally, Bayesian
methods provide a natural framework for accounting for missing values without the need to rely on ad hoc imputation (Lunn et al. 2000). A review of this debate is beyond the scope of this thesis. However, a brief overview of the Bayesian framework and a
discussion of its main advantages and criticisms are given in order to clarify the choice of methodology used and give context to some of the analysis performed in this thesis.
2.2.1. Bayesian inference
Conventional “frequentist” statistical analyses are performed by investigating the probability of obtaining the observed data assuming a particular null hypothesis is true.
Bayesian inference however, is performed by investigating the probability of a hypothesis being true in light of the available data (Wade 2000) and is accomplished through the Bayes theorem:
p{^\y) = p{e) *p{y\e)
p{y) (2.1)
Where p(6\y) is the posterior probability or the joint probability distribution of 0, i.e. the unobserved quantities (which most often represents the parameters in statistical models); occurring given that the observed data y also occurs. The posterior distribution
summarises the current state of knowledge about all the uncertain quantities (including
unobservable parameters and also missing and unobserved potential data) in a Bayesian
analysis. The statistical inference about 9 is made in terms of probability statements (Gelman et al. 2004). The probability statements are constructed under Bayes’ theorem
(equation 2.1) which in turn is based on conditional probability, i.e. the inference made
about 6 is conditional on the observed value y. Analytically, the posterior probability can
therefore be written as a product of the prior probability distribution of the parameters p{9) and the likelihood p{y\9) of the data, i.e. the probability of the data y occurring given that the parameters 6 also occurs. p{y) represents the probability of obtaining the data y independently.
Data used in Bayesian approaches may also include information obtained prior to
inclusion of the newly collected data. Bayesian methods naturally integrate both these
sources of information, old and new, by incorporating the relevant prior information into
the analyses through the specification of appropriate prior probabilities for the parameters
B. The prior distribution represents the probability distribution for the parameter before
consideration of the new data (Schweder 2008) and may represent either parameter
estimates from previous analyses and/or expert opinion. Once the prior probability is
specified, it is possible to combine the prior distribution with the information contained in
the observed data to obtain an updated (posterior) probability distribution, representing
the probability distribution after the data have been considered. In contrast, conventional
statistical methods are forced to ignore any relevant information other than that contained
in the data. This is often considered unrealistic and a waste of information (Gelman
et al. 2004). In addition to the ability to integrate information from diverse sources,
Bayesian methods are highly appealing to quantitative scientists due to their explicit use
of probability for quantifying uncertainties in inferences based on statistical data analysis
(Gelman et al. 2004). This arises from the prior distribution effectively treating the model
parameters as random variables rather than fixed estimates.
The use of informative priors has been criticised for subjectivity, however it is important
to note that there are also non-subjective justifications of the Bayesian approach
(O’Hagan and Forster 2004). Bayesian supporters also argue about the subjective
nature of all information and equate both prior and posterior probability distributions with
belief functions. Indeed "frequentists”, who often criticise the prior distribution for being
subjective, are guilty of subjectivity themselves when assume a priori that their data are
normally (or otherwise) distributed. Additionally, under a maximum likelihood approach,
the setting of numerical limits for parameter search is an implicit use of prior assumptions.
In many applications, at least for some parameters, very little is known and one would
like the posterior distribution to be solely influenced by the data and not the prior; this
is where non-informative priors are used (Wade 2000). Furthermore, many scientists
may include informative priors differently based on personal and subjective beliefs. For
a given study, the prior might be a posterior from previous studies and thus be based
on data, but some study must have been the first and then the prior cannot have been
supported from previous data. In defense of the Bayesian approach, the use of non-
informative priors does, in some sense, minimise the subjective element, e.g. if asked for
should take: a strictly positive number that is likely no bigger than 200kg. However, if
there are remaining concerns over unjustified reliance on arbitrary priors, we can assess
their robustness through sensitivity analysis. Nonetheless, increasing sample size should
lead to equivalence between Bayesian and ’’frequentist” approaches.
Bayes’ theorem estimates the posterior probability distribution and subsequently all
statistical inference is made from this posterior distribution (Wade 2000). The output is
defined as an individual’s degree of belief in the likelihood of an event, rather than relative
frequencies of events as in conventional statistical analyses (Gelman et at. 2004). The
difficulties in evaluating the posterior distribution analytically is another main criticism
of the Bayesian methods. However, with the development of fast computers and readily
available software such as WinBUGS (Lunn et al 2000, 2009) and JAGS (Plummer 2003),
simulation techniques are no longer a problem (Schweder, 2008). These two softwares
(used interchangeably in this thesis) approximate the Bayes theorem by implementing
the Markov Chain Monte Carlo (MCMC) sampling technique through a Gibbs sampler.
Further details on model fitting through MCMC are given in the next section.
2.2.2. Bayesian fitting via MCMC
MCMC simulates the posterior distribution, and it is used when it is not possible to sample
6 directly from p{6\y). It works by simulating direct draws from probability distributions
of interest and then correcting those draws to better approximate the target posterior
distribution {p{9\y)). The samples are drawn sequentially and the previous sample values
are used to randomly generate the next sample value (hence, forming a Markov chain).
This technique is successful because the approximate distributions are improved at every
step until convergence to the unknown target distribution (Gelman etal. 2004). As such,
in order to achieve full convergence of the MCMC approximation to the true posterior
distribution, it is common to discard the first few samples (a process known as burn-in).
The Gibbs sampler, which is a particular Markov chain algorithm designed to
sample from a high dimensional distribution (or joint probability distribution), is crucial
in the Bayesian model fitting process because p{y) is extremely difficult to calculate or
approximate directly. However, the Gibbs sampler allows us to generate a sample from
the parameters of the conditional distributions which will be proportional to, but does not
require p{9). Therefore, the power of Gibbs sampling is that the joint distribution of the
parameters will converge to the joint probability of the parameters given the observed
data. This means that the Gibbs sampler finds estimates for the parameters of interest in order to determine how well the observable data fits the model of interest, and also whether or not data independent of the observed data fits the model described by the observed data.
2.2.3. Bayesian model evaluation
Gelman et al. (2004) summarized Bayesian data analysis in three steps: (1) construct the full probability model i.e. the joint probability distribution for all observed (y) and unobserved {0) quantities; (2) conditioning on the observed data which includes estimate and interpretation of the posterior distribution and; (3) evaluation of the model fit. Steps (1) and (2) are accomplished as described above through Bayes’ theorem. Step (3) model performance, is done by a variety of statistical tools that allow models to be compared relative to one another and choose what is considered a parsimonious model (McCarthy, 2007). Model performance is defined broadly as the ability of a model to explain observed data, make predictions or minimise error.
Under a Bayesian framework, the Deviance Information Criterion (DIC; Spiegelhalter
I '
I'' ■
r I • I ' - r.'v
i’- • ;
■ *1
•i
I ''' I
V . * '
-..-s-I ” ''ll ' I I ■ . -' I ' ■•
>- -... '4'-: 'll ■= *^V"s 'Jr "i r ■ ■:
I .■ • M r" ' '■• '* * I . . . I » . . - , I • • _ ^ ' '-'ll* * I " ■ " i I ' ' ' ' I'l
.• - . ' 1. .. . - ■ i! •*' = II . 1 . r- ' » •
. - • . - , • - 7 • I • >;< " - 'Vi ; - -• ■, '4 '
</- *„ J ^ .1' .'..la* I / '■k' • r**-i’'* ■ ■ •• ” ."l' II Ly ij ^1 “v ‘ ' - « ' , I ■’ 1 I ' • I I ■ ' j ' ^1* I I
'y I-''- ' • I I •>
’*11 II •' ' **' ' r '■ I ■ ' V ' • *' " ‘1; A ■ III I _ '11 I ' ■ - J 1'^ '^ ' ' Il ' . • *
•* »
r ■. ‘ r ''^1,' 1 I,." ■ - J '
I I
\ -1- \ I * 1 f ■I ' . •. Il
• • I • :.?•
24
. --.j
\
Chapter 3
The role of discards in the assessment of fisheries
ecological fingerprint
This chapter is partiy being prepared for publication:
Authors: Viana M., McNally L, Graham N., Reid D. & Jackson AL
Authors’ contributions: MV and LM conceived the idea; MV, LM and AJ developed the
methodology; MV analysed the data; MV, LM, NG, DR and AJ discussed the results; MV
T , - . - : t — -s - •
I ^ •I :
• I
S I
I" ''.J- <, '
I 'y^;; V’. . V ‘‘'• = '1
I
■ ^ u “ ^ ^
Lii'-y -V rV.’^ 'i
e^X'.V-;,,. I!:?*?'" ■;■-'■
-5- :
- y'
■i.
Si* y .= .'* “■ y,^„. V’ -' - <■'""' - .. - ij ... ._ . II. .. •* r I * II ■ III « 'iV IP > I > •, I I I I I " ' •!- ". v •, 1 ' ’ 1. •.• ‘r
lA
J.L..M ' ■ 'ih ■" .'C <t'. *|‘"J, !„■ " II •'■ S "
f'; -', ^ .ii.v-’: t V' -.■ „ I ,' J, 7’ ■ .'
f il.jIIJf,:'. ■ II ,|fi i"" • 'i.-P'■“'* J' „ •'ll rr •' "i.-' •• II ^ j'-'-' < '
L ,>. ' *• H J/i II i ". 1. ' II . .• , - .
r%■* c -'* III -.• > *■' '•" '■ ^ ‘
tfr," ■ " ■' II ,
*1 - h II
■T.i
\
I 26
’■. . . .‘ J * .V.‘ ' J-’s
. I■ .-yi “• I j-to ’••• • . • I ' I ^ 1, . '
i
3.1. Introduction
The most important impact of fisheries on the marine ecosystem is arguably the removal
of individuals (Pauly et al. 2002). These removals, which constitute the catch, increase
the mortality rate of the target and some non-target species which can endanger the
biodiversity and productivity of ecosystems, but also destabilise its function and structure
such as food web topology and community demographics (Pikitch et al. 2004). For
example, fishing changes the relative abundance of species through removals and acts
as an agent of directional selection in the ecosystem by favouring species with certain
life history characteristics (e.g. selection of early over late maturation; Law 2000),
thereby altering community structure and diversity (Botsford et al. 1997, Jennings and
Kaiser 1998). As a consequence, EBFM has been accepted recently as crucial in the
establishment of healthy ecosystems and sustainable fisheries (Botsford et al. 1997,
FAO 2003, Pikitch et al. 2004). This means that, in addition to all target species,
their competitors, predators and prey should be considered in any management plan or
assessment of fisheries impacts on the ecosystem. As such, the best available measure
of the fisheries impact on the marine ecosystem is the catch which comprises both
landings and discards (Rochet and Trenkel 2003).
At least two fundamental adjustments have been recognized as key for the success
of EBFM. These comprise switch from single to multiple species assessment and the
inclusion of fisheries discards in assessments (Bellido et al. 2011). The former is already
visible in the literature (Pikitch et al. 2004), however, there are still very few studies of
fisheries impacts or management that include discards, most likely due to lack of available
data (Dickey-Collas et al. 2007, though see e.g. Punt et al. 2006, Aarts and Poos
2009 and Fernandez et al. 2010 which provide methods for incorporating discards in
stock assessments). Undoubtedly, there is worldwide recognition that discards are a key
component of fishing impacts on ecosystems and that numerous detrimental ecological
consequences such as impacts on biodiversity and on food webs (Hall et al. 2000,
Zhou 2008) are associated with discarding alone. However, to date there is no empirical
evidence clearly supporting this hypothesis.
Several biodiversity indicators have been used successfully to assess the impacts
of fishing. Indeed, Rochet and Trenkel (2003) suggest that looking for fishing effects
is mainly looking for changes in indicators for assemblages. The mean trophic level
(MTL) has been widely applied (Pauly et al. 1998, 2005; Rochet and Trenkel 2003)
marine biodiversity (Convention on Biological Diversity 2006). The MTL detects shifts in the catch assemblage function (i.e. position in the food chain) such as shifts from high to low trophic levels which may indicate the decline in predators (Pauly et al. 1998, 2005). Other diversity indices such as species richness, evenness and the Shannon index have also been used extensively for the assessment of aquatic environments (Hall 1999, Rochet and Trenkel 2003). Species richness quantifies the actual number of species, evenness is a measure of how similar the abundances of different species in the system are and the Shannon index is a measure of the order within a system as it consists of the proportional abundance of each species. However, as these indices quantify different aspects of biological diversity they should not be used independently. The interpretation of integrated indices also requires the examination of species composition, usually accomplished by investigating the average distance (e.g. Euclidean distance) between compositions (Kenkel and Orloci 1986), to assess shifts in the community structure. Although the individual use of some of these indices have been recently questioned (e.g. Rochet and Trenkel 2003, Branch et al. 2011), appropriate alternatives are still missing, making the coupling of different diversity estimators the most pragmatic way of assessing the impacts of fishing.
The main objectives of this chapter are threefold: 1) show empirical evidence that discard mortality is an important component of the effect of fishing on marine ecosystems; 2) explore how the omission of discards affects the measures of fishing impacts by the comparing ecological estimators of catch with those of its two components i.e. landings and discards; and 3) understand the motivations for discarding and how this affects the measures of fishing impacts by comparing ecological estimators of catch with those of the different components of discards, i.e. commercial species discards and non-commercial species discards. Commercial species discards comprise the species that have the potential to be marketed but for some reason were discarded, e.g. fish that are below the MLS, damaged or outside the TAG. In turn, non-commercial species comprise all the other species (rare or not) that are never landed since they have no value in the market, mostly because they are not part of the diet of the local country. To sustainably manage marine resources and to reduce the fisheries ecological fingerprint we must understand the individual impact of the different components (landings and discards) of the total fishing mortality (the overall catch).
3.2. Methods
3.2.1. Data
To investigate the impacts of the two catch components, landings and discards, data
collected quarterly from 1996 to 2009 onboard Irish commercial fishing vessels were
used. As described in Chapter 2, landings and discards samples were taken at the
haul-level and all the organisms in the sample were counted, measured and identified,
when possible to the species level. The estimated weight of each individual was derived
afterwards through length-weight relationships. The catch estimates were calculated from
summing discards and landings, therefore only data from hauls sampled for both landings
and discards were included. Approximately 2875 hauls sampled around all Ireland, i.e.
ICES divisions Vila, Via, Vllb, Vllj, Vllg and to a lesser extent Vllk, VIb and Vile; were
used in this chapter. More details on the data and sampling program can be found in
Chapter 2 of this thesis.
One of the ecological metrics used in this chapter is the mean trophic level (i.e.
abundance or biomass-weighted average of trophic levels of taxa recorded in a particular
quarter). To calculate this metric, the values for the trophic level of each species were
obtained from the online database FishBase {www.fishbase.com). Owing to the high
number of species in this study and the lack of information available for many species,
the values used here correspond mostly to the trophic level of adult organisms. This will
increase the overall MTL of the catch and its components. However, since the interest
is in the relative difference between the MTL of discards and landings and that of catch,
instead of the actual values of MTL, this approach is considered suitable.
3.2.2. Analyses
The data were aggregated at the level of quarter as most analyses of fisheries’ impacts
use time-series data aggregated at the level of quarter or above (e.g. Pauly et al. 1998,
Branch et al. 2010), and also to better represent the fishing pressure as the sampling
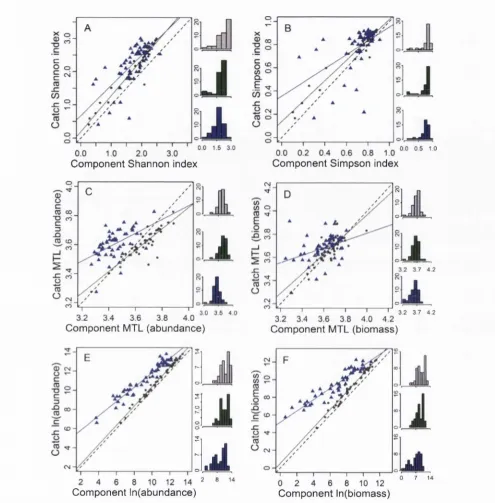
targets are set by quarter. To accomplish the first two objectives, six key ecological
metrics: the Shannon and Simpson indices, MTL in abundance and biomass (g), species
richness, total log biomass and total log abundance; calculated quarterly for catch were
regressed against those calculated from landings and against those calculated from
Table 3.1: Description of the ecological metrics used in this chapter: Abundance, biomass, Shannon and Simpson indices, mean trophic level (MTL), species richness.
Euclidean distance and Bray-Curtis dissimilarity.
Measure Description
Abundance Number of individuals.
Biomass Weight of individuals.
Shannon Diversity measure. Quantifies the uncertainty in predicting the species
identity of an individual; i.e. if there is only one species, the Shannon
index is 0 and the maximum possible value (log(number of species))
occurs when all species are present at equal frequency.
Diversity measure. Probability that two randomly sampled individuals
are from the same species (bounded between 0 and 1); i.e. if there is
only one species, the Simpson index is 1.
Measure of the mean position of a group of individuals in the food chain
(bounded between 1 and 5), which can be weighted by abundance or
biomass. High trophic-level organisms eat low trophic-level organisms.
Diversity measure. Number of species found.
Measure of compositional dissimilarity. Distance between two points in
space (bounded between 0 and -i-oo). Used to represent n-dimensional
species space; i.e. if two sites share the same composition, the
euclidean distance is 0.
Bray-Curtis Measure of compositional dissimilarity. Quantifies the compositional
difference between two different sites based on abundance at each site
(bounded between 0 and 1); i.e. if two sites share all the species in the
same relative abundance, the Bray-Curtis dissimilarity is 0. Simpson
MTL
Richness
Euclidean
This approach allows detect which component of catch is more similar to catch, i.e.
which component best predicts the true measure of fishing impacts. For example, if we
regress the species richness of discards against the species richness of catch, and obtain
a slope of 1 and an intercept of 0 (i.e. 1 to 1 line), it means that the number of species in
discards was the same as the number of species in the catch, i.e. the species richness
of discards are a perfect predictor of the species richness of catch. Qn the other hand, if
we obtain a regression line with the same slope (i.e. 1) but a higher or lower intercept, it
means that using the species richness of discards as a predictor of the species richness
of catch, will provide proportional over or underestimates, respectively, of the species
richness of catch. Finally, if the slope increases or decreases, but the intercept remains 0,
it means that there is an increase in the over or underestimation, respectively, of species
richness of catch with the increase of species richness in discards.
In order to compare the relative performance of the linear regressions of catch against
landings and discards, the regression coefficients and p-values (significant if <0.05) were
investigated, and the Akaike Information Criterion (AlC) of these models compared. A
lower AlC value constitutes a more parsimonious model and a difference of at least 2
is considered a significant improvement of the model fit (Burnham and Anderson 2002).
Additionally, the accuracy of each regression was also compared by subtracting these AlC
values from those of the respective null model i.e. a model with intercept of 0 and slope
of 1. The difference between the AlC of the model and the AlC of the null model indicates
which model is closer to the scenario of perfect prediction in which the dependent variable
is explained entirely by the independent variable.
The same approach was taken to explore the motivations for discarding, however,
instead of regressing the ecological metrics of catch against those of landings and
discards, they were regressed against those calculated from commercial species
discards and those from non-commercial species discards. In addition to detect which
portion of the discards (commercial or non-commercial) is dominant in the catch, and
consequently which is a bigger contributer to the fishing impacts, these analysis allow
to detect in which way the different components of discards are affecting the biological
diversity of the ecosystem.
Finally, the similarity of the quarterly species compositions of catch and those of
landings and discards was explored by calculating the Bray-Curtis dissimilarity and
Euclidean distance between the proportional composition of catch and landings and catch
and discards at each time point (quarter). A description of these two measures can be
found in Table 3.1. Both measures provide differents insights into the species composition
of a community. While the former is determined by the representation of the species in the
samples, giving little importance to the abundance of each species, the latter is unaffected
by shared zero counts but it is based on the relative abundance of each species in a
sample. To assess whether either landings or discards were closer in composition to
catch, Welch t-tests were used on these values with which lower dissimilarities/distances