R E S E A R C H A R T I C L E
Open Access
Osteoporosis in ankylosing spondylitis
-prevalence, risk factors and methods of
assessment
Eva Klingberg
1,2*, Mattias Lorentzon
2, Dan Mellström
2, Mats Geijer
3, Jan Göthlin
4, Elisabet Hilme
5, Martin Hedberg
6,
Hans Carlsten
1,2and Helena Forsblad-d
’
Elia
1,2Abstract
Introduction:Osteoporosis can be a complication of ankylosing spondylitis (AS), but diagnosing spinal osteoporosis can be difficult since pathologic new bone formation interferes with the assessment of the bone mineral density (BMD). The aims of the current study were to investigate prevalence and risk factors for reduced BMD in a Swedish cohort of AS patients, and to examine how progressive ankylosis influences BMD with the use of dual-energy x-ray absorptiometry (DXA) of the lumbar spine in different projections.
Methods:Methods of assessment were questionnaires, back mobility tests, blood samples, lateral spine
radiographs for syndesmophyte grading (mSASSS), DXA of the hip, radius and lumbar spine in anteroposterior (AP) and lateral projections with estimation of volumetric BMD (vBMD).
Results:AS patients (modified New York criteria), 87 women and 117 men, mean age 50 ± 13 years and disease duration 15 ± 11 years were included. According to World Health Organization (WHO) criteria 21% osteoporosis and 44% osteopenia was diagnosed in patients > = 50 years. Under age 50 BMD below expected range for age was found in 5%. Interestingly lateral lumbar DXA showed significantly lower BMD and revealed significantly more cases with osteoporosis as compared with AP DXA. Lumbar vBMD was not different between sexes, but women had significantly more lumbar osteoporosis measured with AP DXA (P< 0.001). Men had significantly higher mSASSS (P< 0.001). Low BMD was associated with high age, disease duration, mSASSS, Bath Ankylosing
Spondylitis Metrology Index (BASMI), inflammatory parameters and low body mass index (BMI). Increasing mSASSS correlated significantly with decreasing lateral and volumetric lumbar BMD, while AP lumbar BMD showed tendency to increase.
Conclusions:Osteoporosis and osteopenia is common in AS and associated with high disease burden. Lateral and volumetric lumbar DXA are more sensitive than AP DXA in detecting osteoporosis and are less affected by syndesmophyte formation.
Introduction
Ankylosing spondylitis (AS) is a chronic inflammatory rheumatic disease, mainly affecting the sacroiliacal joints, vertebrae and intervertebral discs, leading to syn-desmophyte formation and impaired back mobility. In AS two enhanced but opposite bone remodelling pro-cesses are taking place in close vicinity within the spine;
these are pathologic new bone formation in the cortical zone of the vertebrae, the zygapophyseal joints, and the ligamentous apparatus and excessive loss of trabecular bone in the centre of the vertebral body leading to osteoporosis. Earlier studies have demonstrated an increased prevalence of osteoporosis and significantly lower bone mineral density (BMD) in AS patients com-pared with sex and age matched controls [1,2]. Osteo-porosis has also been shown to be present in mild AS and in early disease [2,3]. AS patients have a high risk * Correspondence: Eva.Klingberg@vgregion.se
1Department of Rheumatology and Inflammation Research, Sahlgrenska
Academy at University of Gothenburg, Guldhedsgatan 10A, S-413 46 Göteborg, Sweden
Full list of author information is available at the end of the article
of vertebral fractures, which can be complicated by neu-rological injuries [4,5].
In advanced AS it can be difficult to interpret lumbar spine BMD measured with dual-energy x-ray absorptio-metry (DXA) in the anteroposterior (AP) projection. The new bone formation that is characteristic of AS causes an overestimation of the total BMD and values can be normal or high, even when osteoporosis is pre-sent. Spinal hyperostosis in AS is frequently located around the zygapophyseal joints, the vertebral endplates and the annulus fibrosus of the discs, and to a lesser extent, on the lateral sides [6]. Lateral DXA scanning of the lumbar spine allows exclusive examination of the vertebral body, which consists of 80% trabecular bone, and excludes the zygapophyseal joints, endplates and both anterior and posterior syndesmophytes from the measurement. Consequently, lateral scanning could be a way to reduce the problem of overestimation of lumbar spine BMD in AS. With older single-beam DXA systems patients were examined lying on their side and the pre-cision was low. Modern lateral scans with the patient positioned supine offer precision similar to regular AP spine DXA scans [7].
The combination of AP and lateral DXA allows assess-ment of three-dimensional volumetric BMD (vBMD = bone mineral content/volume). Areal BMD (aBMD) is measured two-dimensionally, without taking the size of bone in the third dimension into account. Consequently, aBMD depends on both bone density and bone size, whereas vBMD is independent of bone size. Men have lar-ger bones than women and consequently have higher aBMD, but vBMD is equal in both sexes [8,9].
BMD varies between different populations. Sweden has a high prevalence of osteoporosis and osteoporosis-related fractures [10-12]. Although studies of osteoporo-sis in AS have been performed in other countries, this is to our knowledge the first study in Scandinavia. The aims of the present study were to investigate the prevalence of, and risk factors for osteoporosis in patients with AS, to compare lumbar spine BMD measured in the AP and lat-eral projection, including estimated vBMD, and to study how these measures change with progressive ankylosis.
Materials and methods
Patients
The patients were recruited from three participating centres in western Sweden; the Rheumatology Clinic at Sahlgrenska University Hospital in Gothenburg and the Rheumatology Clinics at the Borås and Alingsås county hospitals. The inclusion criterion was AS according to the modified New York criteria [13]. Exclusion criteria were psoriasis, inflammatory bowel disease, dementia, pregnancy and difficulties in understanding Swedish. All patients meeting the study criteria were invited to
participate. Informed consent was obtained according to the Declaration of Helsinki. The study was approved by the regional ethics committee in Gothenburg.
Physical examination and questionnaires
Physical examinations, including the Bath Ankylosing Spondylitis Metrology Index (BASMI), were all per-formed by the same physician (EK). The patients answered questionnaires concerning risk factors for osteoporosis, medical history, medication and the Bath Ankylosing Spondylitis Disease Activity Index (BAS-DAI), Bath Ankylosing Spondylitis Functional Index (BASFI) and Bath Ankylosing Spondylitis Patient Global score (BAS-G) [14-17]. The Ankylosing Spondylitis Dis-ease Activity Score (ASDAS) was calculated using a pre-viously described formula [18,19].
Physical activity was divided into three levels of inten-sity (light, moderate and heavy) and reported in hours per week for leisure time, at home and at work, using two validated questionnaires; the Leisure Time Physical Activity Instrument (LTPAI) and Physical Activity at Home and Work Instrument (PAHWI) [20]. Lifetime use of glucocorticoids, converted into milligrams of pre-dnisone, was estimated by examining the medical records and questioning patients about previous gluco-corticoid injections and oral prednisone use. Fracture risk assessment (FRAX) for the % ten-year probability of major osteoporotic and vertebral fractures respectively, was calculated using the FRAX tool developed from a Swedish cohort. The FRAX tool applies only to patients 40 years or older. The probability of fracture is calcu-lated using known risk factors for fractures, and BMD of the femoral neck [21].
Bone mineral density
BMD of the lumbar spine in the AP (vertebrae L1 to L4) and lateral (L2 to L4) projections, the left hip (femoral neck and total hip regions) and the non-dominant fore-arm (radius) was measured using a DXA scanner (Holo-gic Discovery A, Holo(Holo-gic Inc, Bedford, MA, USA). The coefficients of variation for repeat scan precision were 0.39% for the AP and 0.60% for the lateral lumbar DXA measurements. For patients aged 50 years or older the following World Health Organization (WHO) defini-tions of osteopenia and osteoporosis were used: osteope-nia, T-score < -1 to > -2.5 SD (compared to the young normal mean), and osteoporosis, T-score≤-2.5 SD. The lowest value of BMD measured in the lumbar spine, total hip or femoral neck was used [22]. For patients
under the age of 50 a Z-score ≤ -2.0 SD (compared to
analysis software. T- and Z-scores were not available for lateral lumbar spine DXA measured in men or for lum-bar spine vBMD measured in men or women.
Radiography
Lateral radiographs of the cervical, thoracic and lumbar spine were acquired and changes related to AS were assessed using the modified Stoke Ankylosing Spondylitis Spine Score (mSASSS). The score includes the anterior corners of vertebrae C2 to T1 and T12 to S1, which are graded with 0 to 3 points each (0 = normal, 1 = erosion, sclerosis or squaring, 2 = syndesmophyte, 3 = bridging syndesmophyte). The remaining thoracic spine is not included in the score. The scoring scale ranges from 0 to 72 [24].
Laboratory tests
Blood samples were analysed by standard laboratory techniques at the participating hospitals. The mean level of erythrocyte sedimentation rate (ESR) during the last five years was calculated using the first recorded ESR test for each year. When the patient had an infection the concomitant ESR test was excluded and replaced by the subsequent test.
Statistics
Statistical analyses were performed using PASW Statis-tics 18.0 (SPSS Inc., IBM, Chicago USA). Descriptive sta-tistics are presented as median and range and/or mean
and standard deviation (SD). The t-test was used for
comparison of normally distributed demographic and disease-related variables and the Mann-Whitney U-test was used to analyse variables that were not normally dis-tributed. The chi-square test was used to compare cate-gorical variables. Correlations were calculated using Spearman’s correlation (rs). For dichotomous variables, yes was coded 1 and no was coded 0. All tests were two-tailed andP< 0.05 was considered statistically significant. Linear regression was run with BMD at different mea-surement sites as the outcome and logistic regression was run with the categorical variable low BMD T-score (yes/no) as the outcome. Covariates in both calculations were the variables that were significantly correlated with BMD in the first analyses.
Results
Of the 538 AS patients registered in the hospitals’ data-bases, 177 patients did not meet the modified New York criteria for AS or had exclusion criteria. Out of a total of 361 patients invited to participate, 72 declined, 60 did not respond to the invitation and 19 did not meet the inclusion criteria. Of the 210 patients included, 6 did not attend the DXA or radiography appointments and were therefore excluded. The patients who fulfilled the
inclusion criteria but declined to participate or did not respond to the invitation (n = 151) were significantly younger than the patients included in the study (46 ± 13 years vs. 50 ± 13 years;P= 0.007), but the sex distri-bution was the same among patients who were or were not included.
A total of 204 patients completed the study; 87 (43%) women and 117 (57%) men. The mean age (50 ± 13 years), time since onset of AS symptoms (24 ± 13 years) and time since diagnosis (15 ± 11 years) were evenly distributed between the sexes. Demographic and dis-ease-related variables are shown in Table 1.
Prevalence of reduced BMD
Among patients under 50 years of age (n = 103), 35
patients (34%) had a BMD Z-score < -1.0 at the hip and/or AP lumbar spine and 5 patients (4.9%) had BMD below the expected range for age, that is, a Z-score ≤ -2.0. Among patients 50 years of age or older (n= 101), 44 (43.6%) had osteopenia and 21 (20.8%) had osteo-porosis using the WHO definition [22]. The lumbar spine was the most common location for osteoporosis or BMD below the expected range for age (10%), fol-lowed by radius (8%) and femoral neck (5%). The preva-lence of reduced BMD in different locations is shown in Table 2.
Men had significantly lower BMD at the femoral neck
(mean Z-score -0.215, P = 0.012), compared with the
age- and sex-matched reference values in the DXA-scanner software. Mean Z-scores were negative at all measurement sites except the lumbar spine (AP projec-tion), but was not significantly different to zero. Signifi-cantly more women aged 50 years or older had osteoporosis on measurement of AP lumbar spine than men (12/44, 30% vs. 4/56, 7%,P< 0.001). Consequently, diagnosis of osteoporosis and osteopenia using the WHO definition was more prevalent among women (13/44, 30% and 21/44, 48%, respectively) compared
with men (8/56, 14% and 23/56, 41%, respectively; P=
0.042). BMD below the expected range for age was equally common in women and men below 50. Men had a significantly higher mSASSS score (median 8, range 0 to 72) than women (median 2, range 0 to 46) (P < 0.001) (Figure 1). Men had significantly higher aBMD at all measurement sites (P < 0.001 for every location), but for lumbar vBMD there was no significant
difference between the sexes (P = 0.36). The BASDAI,
BASFI, BASMI and ASDAS were evenly distributed among women and men.
Table 1 Characteristics of 204 patients with ankylosing spondylitis in western Sweden
Patients, number (%)
Median (range) Mean ± SD
Demographic variables
Sex Women 87 (43)
Men 117 (57)
Age, years NA 49 (17 to 78) 50 ± 13
Postmenopausal women 45/87 (52)
Heredity for fractures 57 (28)
History of vertebral fracture 3 (1)
History of non-vertebral fracture 18 (9)
Current smokers 24 (12)
Ever smoked > 6 months 101 (50)
Daily calcium intake from dairy products NA 600 (0 to 2,640) 668 ± 397
BMI, kg/m2 25 (19 to 46) 26 ± 4
LTPAI total, hours 6 (0 to 42) 7 ± 6
PAHWI total, hours 45 (0 to 160) 40 ± 21
FRAX major osteoporotic fracture (%) (patients≥40 years)
6.7 (1.2 to 68.0) 9.9 ± 9.7
FRAX hip fracture (%) (patients≥40 years)
0.8 (0 to 56.0) 2.4 ± 6.0
Disease-related variables
Years since onset of symptoms 24 (2 to 55) 24 ± 13
Years since diagnosis 12 (1 to 47) 15 ± 11
History of anterior uveitis 102 (50)
History of peripheral arthritis 120 (59)
History of coxitis 17 (8)
BASMI, score 3.0 (0.6 to 7.4) 3.1 ± 1.6
BASDAI, score 3.5 (0.0 to 9.6) 3.6 ± 2.1
BASFI, score 2.3 (0.0 to 8.7) 2.7 ± 2.1
BAS-G1, score (last week) 2.9 (0.0 to 10.0) 3.4 ± 2.6
BAS-G2, score (last 6 months) 3.4 (0.0 to 9.7) 3.8 ± 2.6
ASDAS, score 2.3 (0.8 to 5.9) 2.4 ± 0.9
mSASSS, score 5.5 (0.0 to 72.0) 14.2 ± 19.2
Mean ESR, mm/h (2004 to 2008) 16 (2 to 102) 19 ± 15
ESR, mm/h (at inclusion 2009) 11 (2 to 105) 15 ± 14
CRP, mg/L 5 (3 to 80) 9 ± 10
Hemoglobin, g/L 139 (105 to 166) 139 ± 13
WBC, × 109/L 6.7 (2.7 to 18.1) 7.0 ± 2.1
PLT, × 109/L 287 (133 to 506) 299 ± 75
Creatinine,μmol/L 70 (43 to 148) 71 ± 15
HLA-B27 positive 178 (87)
Patients on NSAID 158 (77)
Patients on DMARD 62 (30)
Patients on TNF inhibitor 42 (21)
Patients on GC 7 (3)
GC lifetime use, mg prednisone NA 100 (0, 56390) 1397 ± 5775
Patients on bisphosphonates 8 (4)
Patients on HRT 5 (2)
Patients on calcium and vitamin D 24 (12)
Bone mineral density
aBMD AP lumbar spine, g/cm2 1.02 (0.63 to 1.54) 1.02 ± 0.17
aBMD lateral lumbar spine, g/cm2 0.72 (0.32 to 1.13) 0.73 ± 0.14
initiated in 30 patients (14.2%) and calcium and vitamin D alone was initiated in 28 patients (13.2%).
Risk factors for reduced BMD
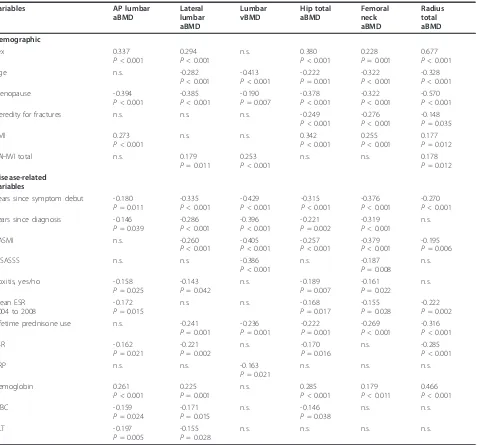
The demographic and disease-related variables explored for association with BMD are shown in Table 1. Low BMD correlated significantly with demographic variables (female sex, older age, low body mass index (BMI), her-edity for fractures, PAHWI and menopausal status for women) as well as disease-related variables (long disease
[image:5.595.49.540.102.141.2]duration, high BASMI, high mSASSS, history of coxitis, high lifetime use of prednisone, low hemoglobin and ele-vated inflammatory parameters, high mean ESR, C-reac-tive protein (CRP), white blood cell count (WBC), platelet count (PLT) (Table 3). No significant association was found between BMD and demographic variables (heredity for osteoporosis, smoking, alcohol intake or LTPAI) or disease-related variables (anterior uveitis, arthritis, BAS-DAI, ASDAS, BASFI or BAS-G). The (MHC class 1) HLAB27-negative patients had significantly lower BMD at
Table 1 Characteristics of 204 patients with ankylosing spondylitis in western Sweden(Continued)
BMD total hip, g/cm2 0.93 (0.54 to 1.42) 0.94 ± 0.14
BMD femoral neck, g/cm2 0.78 (0.48 to 1.20) 0.78 ± 0.13
BMD radius total, g/cm2 0.61 (0.40 to 0.78) 0.61 ± 0.08
BMI, body mass index; LTPAI, Leisure Time Physical Activity Instrument; PAHWI, Physical Activity at Home and Work Instrument; FRAX, World Health Organization Fracture Risk Assessment Tool (% 10 year probability of major osteoporotic, and vertebral fracture respectively, corresponding to patients aged 40 years or older); BASMI, Bath Ankylosing Spondylitis Metrology Index; BASDAI, Bath Ankylosing Spondylitis Disease Activity Index; BASFI, Bath Ankylosing Spondylitis Functional Index; BAS-G1 and G2, Bath Ankylosing Spondylitis Patient Global Score; ASDAS, ankylosing spondylitis disease activity score; mSASSS, modified Stoke Ankylosing Spondylitis Spine Score; ESR, erythrocyte sedimentation rate; CRP, C-reactive protein; PLT, platelet count; WBC, white blood cell count; NSAID, non-steroidal anti-inflammatory drug; DMARD, disease modifying anti-rheumatic drug; TNF, tumour necrosis factor; GC, glucocorticoid; HRT, hormone replacement therapy; aBMD, areal bone mineral density; AP, anteroposterior; vBMD, volumetric BMD
Table 2 Prevalence of reduced BMD measured by dual-energy x-ray absorptiometry at different skeletal sites.
Measurement site
Age-group,
years
BMD, mean ± SD
T-score, mean ± SD
Z-score, mean ± SD
Patients with osteoporosis/BMD
below expected range for age,
number (%)a
Patients with osteopenia, number (%)
Patients with normal BMD
number (%)
Women
AP lumbar spine < 50 1.014 ± 0.134 -0.30 ± 1.22 0.02 ± 1.25 2 (5) 0 (0) 41 (95)
≥50 0.899 ± 0.150 -1.35 ± 1.37 0.14 ± 1.38 12 (27) 15 (34) 17 (39)
Lat lumbar spine < 50 0.741 ± 0.102 -0.94 ± 1.22 -0.25 ± 1.26 3 (7) 0 (0) 40 (93)
≥50 0.616 ± 0.114 -2.43 ± 1.36 -0.05 ± 1.42 20 (45) 15 (34) 9 (20)
Total hip < 50 0.925 ± 0.122 -0.13 ± 1.00 0.07 ± 0.99 0 (0) 0 (0) 43 (100)
≥50 0.832 ± 0.108 -0.89 ± 0.88 0.10 ± 0.85 0 (0) 20 (46) 23 (54)
Femoral neck < 50 0.804 ± 0.127 -0.41 ± 1.15 -0.06 ± 1.13 0(0) 0 (0) 43 (100)
≥50 0.702 ± 0.103 -1.32 ± 0.93 -0.01 ± 0.91 4 (9) 24 (56) 15 (35)
Total radius < 50 0.576 ± 0.038 -0.05 ± 0.70 0.32 ± 0.74 0(0) 0 (0) 43 (100)
≥50 0.517 ± 0.065 -1.14 ± 1.21 0.18 ± 1.09 7 (16) 17 (39) 20 (45)
Men
AP lumbar spine < 50 1.057 ± 0.154 -0.31 ± 1.41 -0.18 ± 1.41 3 (5) 0 (0) 57 (95)
≥50 1.092 ± 0.184 0.18 ± 1.67 0.63 ± 1.72 4 (7) 8 (14) 44 (79)
Lat lumbar spine < 50 0.782 ± 0.131 NA NA NA
≥50 0.740 ± 0.132 NA NA NA
Total hip < 50 0.999 ± 0.137 -0.23 ± 0.92 -0.05 ± 0.90 1 (2) 0 (0) 59 (98)
≥50 0.963 ± 0.136 -0.46 ± 0.90 0.00 ± 0.93 0 (0) 19 (33) 38 (67)
Femoral neck < 50 0.842 ± 0.130 -0.67 ± 0.95 -0.21 ± 0.93 1 (2) 0 (0) 59 (98)
≥50 0.773 ± 0.122 -1.16 ± 0.90 -0.21 ± 0.90 5 (9) 25 (44) 27 (47)
Total radius < 50 0.668 ± 0.050 -0.34 ± 0.93 -0.12 ± 0.91 1 (2) 0 (0) 59 (98)
≥50 0.633 ± 0.063 -1.03 ± 1.21 -0.25 ± 1.20 9 (16) 18 (33) 28 (51)
Definition of reduced BMD in patients younger than 50 years, BMD below expected range for age (Z-score≤-2.0 SD), BMD within expected range for age (Z-score > -2.0 SD); in patients 50 years or older, World Health Organization definition of osteoporosis: T-(Z-score≤- 2.5 SD, osteopenia: T-score < -1 to > -2.5 SD; normal BMD, T-score≥-1SD. For lateral lumbar spine BMD in men there are no reference values available for calculation of T- or Z-scores.a
Data presented as the sum of patients younger than 50 years, with a Z-score≤-2.0 SD and patients 50 years or older with a T-score≤-2.5 SD.
[image:5.595.57.541.370.686.2]Mean mSASSS score per vertebra
Mean mSASSS score per vertebra
Men n=117
V
erte
bra
V
ertebra
[image:6.595.58.537.86.635.2]Women
n=87
Figure 1Mean modified Stoke Ankylosing Spondylitis Spine Score (mSASSS) per vertebra in women and men. C, cervical vertebra; Th,
the total radius compared with HLAB27-positive patients (0.564 ± 0.077 vs. 0.612 ± 0.779 g/cm2; P= 0.005), but there was no difference in BMD at other measurement sites and no difference in Z-scores for total radial BMD between HLAB27-negative and -positive patients. The HLAB27-negative patients were significantly more often female (P= 0.012).
The variables significantly correlated with BMD were entered as covariates in stepwise multiple linear regres-sion analyses with BMD at different measurement sites
as the outcome (Table 4). The most important covari-ates for low BMD were long disease duration, high BASMI, low BMI and menopause in women. AP lumbar spine BMD was mainly associated with demographic risk factors, whereas lateral lumbar spine BMD and vBMD were associated to a greater extent with disease-related risk factors.
[image:7.595.63.543.109.554.2]A low BMD T-score was defined as a T-score < -1.0 measured with DXA at the lumbar spine (AP projec-tion), total hip or femoral neck. Logistic regression with
Table 3 Demographic and disease-related variables showing significant correlation with BMD at different measurement sites.
Variables AP lumbar
aBMD Lateral lumbar aBMD Lumbar vBMD Hip total aBMD Femoral neck aBMD Radius total aBMD Demographic Sex 0.337
P< 0.001
0.294 P< 0.001
n.s. 0.380
P< 0.001
0.228 P= 0.001
0.677 P< 0.001
Age n.s. -0.282
P< 0.001
-0.413 P< 0.001
-0.222 P= 0.001
-0.322 P< 0.001
-0.328 P< 0.001
Menopause -0.394
P< 0.001
-0.385 P< 0.001
-0.190 P= 0.007
-0.378 P< 0.001
-0.322 P< 0.001
-0.570 P< 0.001
Heredity for fractures n.s. n.s. n.s. -0.249
P< 0.001
-0.276 P< 0.001
-0.148 P= 0.035
BMI 0.273
P< 0.001
n.s. n.s. 0.342
P< 0.001
0.255 P< 0.001
0.177 P= 0.012
PAHWI total n.s. 0.179
P= 0.011
0.253 P< 0.001
n.s. n.s. 0.178
P= 0.012
Disease-related variables
Years since symptom debut -0.180 P= 0.011
-0.335 P< 0.001
-0.429 P< 0.001
-0.315 P< 0.001
-0.376 P< 0.001
-0.270 P< 0.001 Years since diagnosis -0.146
P= 0.039
-0.286 P< 0.001
-0.396 P< 0.001
-0.221 P= 0.002
-0.319 P< 0.001
n.s.
BASMI n.s. -0.260
P< 0.001
-0.405 P< 0.001
-0.257 P< 0.001
-0.379 P< 0.001
-0.195 P= 0.006
mSASSS n.s. n.s. -0.386
P< 0.001
n.s. -0.187
P= 0.008
n.s.
Coxitis, yes/no -0.158
P= 0.025
-0.143 P= 0.042
n.s. -0.189
P= 0.007
-0.161 P= 0.022
n.s.
Mean ESR 2004 to 2008
-0.172 P= 0.015
n.s. n.s. -0.168
P= 0.017
-0.155 P= 0.028
-0.222 P= 0.002
Lifetime prednisone use n.s. -0.241
P= 0.001
-0.236 P= 0.001
-0.222 P= 0.001
-0.269 P< 0.001
-0.316 P< 0.001
ESR -0.162
P= 0.021
-0.221 P= 0.002
n.s. -0.170
P= 0.016
n.s. -0.285
P< 0.001
CRP n.s. n.s. -0.163
P= 0.021
n.s. n.s. n.s.
Hemoglobin 0.261
P< 0.001
0.225 P= 0.001
n.s. 0.285
P< 0.001
0.179 P< 0.011
0.466 P< 0.001
WBC -0.159
P= 0.024
-0.171 P= 0.015
n.s. -0.146
P= 0.038
n.s. n.s.
PLT -0.197
P= 0.005
-0.155 P= 0.028
n.s. n.s. n.s. n.s.
a forward conditional method was run with low T-score (yes/no) as the binary outcome and the variables that were significantly correlated with BMD as covariates. Significant covariates for low T-score were long time since onset of AS symptoms (B = 0.036,P= 0.014, odds ratio 1.727, 95% confidence interval 1.007 to 1.068),
high BASMI (B = 0.301, P = 0.016, odds ratio 1.351,
95% confidence interval 1.057 to 1.068), low BMI (B = -0.162, P < 0.001, odds ratio 0.850, 95% confidence interval 0.781 to 0.925) and for women menopausal sta-tus (B = 0.869,P = 0.040, odds ratio 2.384, 95% confi-dence interval 1.041 to 5.461).
Comparison of anteroposterior DXA and lateral DXA
Significantly more women had a lumbar spine BMD T-score≤-2.5 (age≥50) or Z-score≤-2.0 (age < 50) when measured by lateral DXA (n= 23, 26%) compared with AP DXA (n= 14, 16%;P= < 0.001) (Table 2). T- and Z-scores for lateral spine DXA were not available for the men.
Lumbar spine BMD was significantly higher measured in the AP compared with the lateral projection (P < 0.001) (Table 1). The difference (AP minus lateral pro-jection DXA BMD) increased with increasing mSASSS (rS= 0.389,P < 0.001), BASMI (rS= 0.296,P = 0.001), age (rS= 0.309, P = 0.001) and disease duration (rS= 0.268,P= 0.004) in men, but not in women.
Since men had significantly higher mSASSS than women the male subgroup was chosen to further study
the effects of increasing ankylosis on BMD. Increasing mSASSS in men was significantly correlated with lower lumbar spine vBMD (rS= -0.389,P < 0.001), lower lat-eral spine BMD (rS= -0.191, P= 0.041), femoral neck
BMD (rS = -0.324, P < 0.001) total hip BMD (rS =
-0.201, P= 0.030) and total radial BMD (rS= -0.269, P
= 0.004), but not with AP lumbar spine BMD (rS =
0.152,P = 0.103) (Figure 2). Higher BASMI in men also correlated significantly with lower BMD at all measure-ment sites, except for AP lumbar spine BMD, which tended to be higher, but was not significantly so.
Discussion
[image:8.595.61.540.99.330.2]The present study demonstrates that osteoporosis is common in Swedish patients with AS, but is often undiagnosed and thus untreated. BMD was below the expected range for age in 5% of patients under the age of 50 years. Osteoporosis, as defined by the WHO, was diagnosed in 21% of patients aged 50 years or older (in 30% of the women and 14% of the men). Most patients with osteoporosis were undiagnosed before the study. The prevalence of osteoporosis found in the present study is comparable with the prevalence in the Swedish general population aged 50 to 80 years, where 21.2% of women and 6.3% of men have been identified as having osteoporosis [25]. The results indicate that the increased risk of osteoporosis in AS compared with the general population is especially accentuated in male patients,
Table 4 Results from multiple linear regression analyses with BMD at different measuring sites as the outcome.
AP lumbar aBMD
Lateral lumbar aBMD
Lumbar vBMD
Total hip aBMD
Femoral neck aBMD
Total radius aBMD
Constant all variables
0.829 0.539 0.2390 0.783 0.654 0.625
R2all variables 0.290 0.245 0.266 0.402 0.343 0.591
R2for demographic variables 0.254 0.163 0.171 0.338 0.279 0.569
R2for disease related variables 0.079 0.181 0.276 0.174 0.198 0.253
Demographic variables B P-value B P-value B P-value B P-value B P-value B P-value
Sex NA NA NA -0.056 0.009 NA -0.082 < 0.001
Age, years NA NA NA NA NA -0.001 0.002
Menopause -0.156 < 0.001 -0.104 < 0.001 NA -0.053 0.048 -0.076 < 0.001 -0.035 0.009
BMI, kg/m2 0.014 < 0.001 NA NA 0.014 < 0.001 0.011 < 0.001 0.004 < 0.001
Disease-related variables B P-value B P-value B P-value B P-value B P-value B P-value
Years since diagnosis NA -0.003 < 0.001 NA NA NA NA
Years since symptom debut NA NA -0.001 < 0.001 -0.002 0.019 -0.002 0.028 NA
BASMI NA NA -0.006 < 0.001 -0.023 < 0.001 -0.029 < 0.001 -0.008 0.016
Hemoglobin NA 0.002 0.008 NA NA NA NA
WBC NA NA NA -0.007 0.05 NA NA
PLT 0.000 0.003 NA NA NA NA NA
All demographic and disease-related variables that were significantly correlated with BMD in the first analyses were entered as covariates. The table shows only covariates that remained significantly associated with BMD in the stepwise multiple linear regression models. Coding for categorical variables, 1 = yes, 0 = no; for sex, 1 = woman, 2 = man. Beta values are unstandardized regression coefficients.
which is in accordance with findings in another study [26].
In the current study osteoporosis and osteopenia in the lumbar spine were more common in women than in men in the age-group of 50 years or older when mea-sured with AP lumbar DXA, and thus more women were diagnosed as osteoporotic. The prevalence of osteoporosis and osteopenia was equal among women and men at all other locations. The high prevalence of syndesmophytes in the men may have resulted in falsely elevated BMD causing an underestimation of male osteoporosis at the lumbar spine.
The results from the present study indicate that osteo-porosis and osteopenia affect both the central and the per-ipheral skeleton. We found almost as many patients with BMD below the expected range for age or osteoporosis at the radius (n= 17, 8%) as in the lumbar spine (n= 24,
12%). Results from earlier studies indicate that osteoporo-sis in AS is predominantly confined to the central skeleton [27,28]. In one study no correlation was found between bone density at the forearm measured with peripheral quantitative computed tomography (pQCT) and DXA and quantitative CT (QCT) measurements of BMD at the lum-bar spine or hip [29]. Quantitative ultrasound studies of the heel in patients with AS have inconsistent findings, with normal results in one study, and signs of peripheral osteoporosis in another [30,31]. The theory that osteo-porosis is a general process affecting the whole skeleton in AS was supported by a study of bone biopsies from the iliac crest, showing trabecular thinning and low trabecular peripheral bone volume strongly correlated with lumbar spine BMD measured using QCT [32].
There is uncertainty about how to treat osteoporosis in patients with AS. Bisphosphonates have been studied
Fem
o
ral neck
BMD
(m
g/cm
2)
Lum
ba
r v
o
lum
e
tric
BMD
(m
g/cm
3)
Lum
ba
r lateral
BMD
(m
g/
cm
2)
Lumba
r AP
BM
D (mg
/cm
2)
mSASSS
mSASSS mSASSS
mSASSS
rS= 0.152 p=0.103 r
S= -0.191 p=0.042
[image:9.595.58.538.91.487.2]rS= -0.389 p<0.001 rS= -0.324 p<0.001
Figure 2Scatter plots of modified Stoke Ankylosing Spondylitis Spine Score (mSASSS) and BMD measured at different locations.
in respect to their effect on disease activity in AS, but their effects on fractures, BMD and the new bone for-mation in AS needs to be further investigated. Pamidro-nate has been reported to hamper disease activity in AS [33,34]. In a recent placebo-controlled study of alendro-nate 70 mg weekly, no improvement of AS symptoms or disease activity was found [35].
In the current study we found that low BMD was associated with older age, longstanding disease, syndes-mophyte formation, impaired back mobility, history of coxitis, use of glucocorticoids and laboratory signs of inflammation. Menopause was a strong risk factor for women. No connection was found between low BMD and the disease indices BASDAI, BASFI, BAS-G or ASDAS. BASMI and ASDAS were associated with inflammatory parameters (ESR, CRP), but BASDAI, BASFI and BAS-G were not.
The association between extensive syndesmophyte for-mation, restriction of spinal movement and osteoporosis has been demonstrated previously [26,29,36]. One study found significant correlation between low lumbar spine BMD and elevated ESR and CRP [37]. Two follow-up studies have shown that patients with AS and persistent inflammation, that is, with elevated ESR or CRP, devel-oped significant decreases in BMD, whereas patients with low inflammatory activity did not [38,39].
In men, who had significantly higher mSASSS than women, increasing mSASSS and BASMI were signifi-cantly associated with decreasing vBMD and lateral BMD at the lumbar spine, along with lower BMD at the hip and radius, while AP lumbar BMD had a non-signif-icant tendency to increase. Our interpretation of the results is that in comparison with AP spine BMD, lum-bar spine vBMD and lateral lumlum-bar spine BMD are less affected by the new bone formation in AS and hence are more adequate tools in assessing osteoporosis and osteopenia, especially in male patients in AS.
Lateral lumbar spine BMD is usually lower than AP BMD, because the lateral DXA scan measures only the trabecular-rich vertebral body, whereas the AP scan includes both the vertebral body and the posterior part of the vertebra, mainly consisting of dense cortical bone. AP scanning is also affected by artefacts due to to osteo-phytes, aortic calcifications and degenerative changes in the facet joints of elderly people and from hyperostosis in AS. The trabecular bone is more metabolically active than the cortical bone, therefore a decrease in BMD is first found in the trabecular bone. Consequently lateral lumbar spine BMD declines faster than AP BMD in early osteoporosis [40,41].
The current study demonstrates that lateral lumbar spine DXA is more sensitive than AP DXA in detecting osteoporosis and osteopenia in AS. The same results have been reported in two studies using lateral DXA of
vertebra L3 in patients with AS [42,43]. Other studies have shown that lateral DXA is more sensitive than AP DXA in detecting osteopenia and osteoporosis in degen-erative spinal disease [44]. In one study of 100 AS patients and 58 healthy controls assessed with both AP and lateral lumbar DXA using a scanner similar to the one used in the current study, the authors reported that lumbar spine BMD was significantly lower in AS patients compared with healthy controls when measured by lateral projection DXA, but not when measured by AP DXA [45]. However, to apply lateral DXA in clinical practice, reference intervals based on measurements on large populations of healthy men and women are required. Most likely, new threshold values for definition of osteoporosis have to be defined to avoid overestima-tion of osteoporosis with lateral DXA. The current WHO definition of osteoporosis is based on the PA pro-jection and according to the Official Positions of the International Society for Clinical Densitometry 2007, the lateral spine should not be used for diagnosis of osteo-porosis, but it may have a role in monitoring [23].
Conclusions
Osteoporosis and osteopenia are common in Swedish patients with AS and affected half of our study popula-tion. Low BMD was found in both the central and the peripheral skeleton. Osteoporosis was often undiagnosed and untreated, particularly in male patients with AS. Older age and high disease burden, that is, long disease duration, impaired back mobility, syndesmophyte forma-tion and elevated inflammatory parameters, indicated increased risk of osteoporosis. Lateral and vBMD at the lumbar spine were less affected by progressive ankylosis in AS compared with AP BMD. In addition, lateral DXA was more sensitive in detecting osteoporosis and osteo-penia than AP DXA. We suggest that lateral lumbar spine DXA with calculation of vBMD may become valu-able tools in the diagnosis and follow-up of osteoporosis in AS, but validation of the methods in larger reference populations is needed.
Abbreviations
Acknowledgements
We want to thank all the patients who participated in the study. We are grateful to nurses Gunilla Håwi and Ingela Carlberg at Sahlgrenska University hospital for their assistance with the patients and to nurses Angelica Jarlert, Marie-Louise Lindqvist and Ulrika Hjertonsson at the osteoporosis clinic for the DXA measurements. This study has been supported by grants from The Health and Medical Care Executive Board of the Västra Götaland, Rune and Ulla Amlövs foundation for Rheumatology Research, Göteborg’s Association Against Rheumatism, The Medical Society of Göteborg, the Medical Society of Göteborg and the Region Västra Götaland (agreement concerning research and education of doctors), COMBINE and the Margareta Rheumaresearch foundation.
Author details
1Department of Rheumatology and Inflammation Research, Sahlgrenska
Academy at University of Gothenburg, Guldhedsgatan 10A, S-413 46 Göteborg, Sweden.2Centre for Bone and Arthritis Research, Institute of Medicine, Sahlgrenska Academy at University of Gothenburg, Sahlgrenska University Hospital, Vita stråket 11, S-413 45 Göteborg, Sweden.3Centre for Medical Imaging and Physiology, Skåne University Hospital, Lund University, Getingevägen 4, S-221 85 Lund, Sweden.4Department of Radiology, Sahlgrenska University Hospital/Mölndal, Göteborgsvägen 31, S-431 30 Mölndal, Sweden.5Department of Rheumatology, Alingsås Lasarett, Södra Ringgatan 30, S-441 83 Alingsås, Sweden.6Department of Rheumatology,
SÄS Borås, Brämhultsvägen 53, S-501 82 Borås, Sweden.
Authors’contributions
EK participated in the design of the study, examined the patients, performed statistical analyses and drafted the manuscript. HC and HF supervised the study, and were responsible for study design and interpretation of data. HF contributed to statistical analyses. ML and DM were responsible for the bone mineral density measurements. MG and JG were responsible for assessing the spinal radiographs. EH and MH were responsible for including the patients from Alingsås and Borås. All authors have critically reviewed and approved the final manuscript.
Competing interests
The authors declare that they have no competing interests.
Received: 15 January 2012 Revised: 27 March 2012 Accepted: 8 May 2012 Published: 8 May 2012
References
1. Donnelly S, Doyle DV, Denton A, Rolfe I, McCloskey EV, Spector TD:Bone mineral density and vertebral compression fracture rates in ankylosing spondylitis.Ann Rheum Dis1994,53:117-121.
2. Mitra D, Elvins DM, Speden DJ, Collins AJ:The prevalence of vertebral fractures in mild ankylosing spondylitis and their relationship to bone mineral density.Rheumatology (Oxford, England)2000,39:85-89. 3. Will R, Palmer R, Bhalla AK, Ring F, Calin A:Osteoporosis in early
ankylosing spondylitis: a primary pathological event?Lancet1989,
2:1483-1485.
4. Cooper C, Carbone L, Michet CJ, Atkinson EJ, O’Fallon WM, Melton LJ:
Fracture risk in patients with ankylosing spondylitis: a population based study.Journal Rheumatol1994,21:1877-1882.
5. Westerveld LA, Verlaan JJ, Oner FC:Spinal fractures in patients with ankylosing spinal disorders: a systematic review of the literature on treatment, neurological status and complications.Eur Spine J2009,
18:145-156.
6. Wanders AJ, Landewe RB, Spoorenberg A, Dougados M, van der Linden S, Mielants H, van der Tempel H, van der Heijde DM:What is the most appropriate radiologic scoring method for ankylosing spondylitis? A comparison of the available methods based on the Outcome Measures in Rheumatology Clinical Trials filter.Arthritis Rheum2004,50:2622-2632. 7. Blake GM, Jagathesan T, Herd RJ, Fogelman I:Dual X-ray absorptiometry of
the lumbar spine: the precision of paired anteroposterior/lateral studies.
Br J Radiol1994,67:624-630.
8. Faulkner RA, McCulloch RG, Fyke SL, De Coteau WE, McKay HA, Bailey DA, Houston CS, Wilkinson AA:Comparison of areal and estimated volumetric bone mineral density values between older men and women.Osteoporos Int1995,5:271-275.
9. Seeman E:The growth and age-related origins of bone fragility in men.
Calcif Tissue Int2004,75:100-109.
10. Rosengren BE, Ahlborg HG, Gardsell P, Sernbo I, Daly RM, Nilsson JA, Karlsson MK:Bone mineral density and incidence of hip fracture in Swedish urban and rural women 1987-2002.Acta Orthop2010,
81:453-459.
11. Kanis JA, Johnell O, De Laet C, Jonsson B, Oden A, Ogelsby AK:
International variations in hip fracture probabilities: implications for risk assessment.J Bone Miner Res2002,17:1237-1244.
12. Incidence of vertebral fracture in europe: results from the European Prospective Osteoporosis Study (EPOS). J Bone Miner Res2002,
17:716-724.
13. van der Linden S, Valkenburg HA, Cats A:Evaluation of diagnostic criteria for ankylosing spondylitis. A proposal for modification of the New York criteria.Arthritis Rheum1984,27:361-368.
14. Calin A, Garrett S, Whitelock H, Kennedy LG, O’Hea J, Mallorie P, Jenkinson T:A new approach to defining functional ability in ankylosing spondylitis: the development of the Bath Ankylosing Spondylitis Functional Index.J Rheumatol1994,21:2281-2285.
15. Garrett S, Jenkinson T, Kennedy LG, Whitelock H, Gaisford P, Calin A:A new approach to defining disease status in ankylosing spondylitis: the Bath Ankylosing Spondylitis Disease Activity Index.J Rheumatol1994,
21:2286-2291.
16. Jenkinson TR, Mallorie PA, Whitelock HC, Kennedy LG, Garrett SL, Calin A:
Defining spinal mobility in ankylosing spondylitis (AS). The Bath AS Metrology Index.J Rheumatol1994,21:1694-1698.
17. Jones SD, Steiner A, Garrett SL, Calin A:The Bath Ankylosing Spondylitis Patient Global Score (BAS-G).Br J Rheumatol1996,35:66-71.
18. Lukas C, Landewe R, Sieper J, Dougados M, Davis J, Braun J, van der Linden S, van der Heijde D:Development of an ASAS-endorsed disease activity score (ASDAS) in patients with ankylosing spondylitis.Ann Rheum Dis2009,68:18-24.
19. van der Heijde D, Lie E, Kvien TK, Sieper J, Van den Bosch F, Listing J, Braun J, Landewe R:ASDAS, a highly discriminatory ASAS-endorsed disease activity score in patients with ankylosing spondylitis.Ann Rheum Dis2009,68:1811-1818.
20. Mannerkorpi K, Hernelid C:Leisure Time Physical Activity Instrument and Physical Activity at Home and Work Instrument. Development, face validity, construct validity and test-retest reliability for subjects with fibromyalgia.Disabil Rehabil2005,27:695-701.
21. Kanis JA, Johnell O, Oden A, Dawson A, De Laet C, Jonsson B:Ten year probabilities of osteoporotic fractures according to BMD and diagnostic thresholds.Osteoporos Int2001,12:989-995.
22. Assessment of fracture risk and its application to screening for postmenopausal osteoporosis. Report of a WHO Study Group. World Health Organ Tech Rep Ser1994,843:1-129.
23. Baim S, Leonard MB, Bianchi ML, Hans DB, Kalkwarf HJ, Langman CB, Rauch F:Official Positions of the International Society for Clinical Densitometry and executive summary of the 2007 ISCD Pediatric Position Development Conference.J Clin Densitom2008,11:6-21. 24. Creemers MC, Franssen MJ, van’t Hof MA, Gribnau FW, van de Putte LB, van
Riel PL:Assessment of outcome in ankylosing spondylitis: an extended radiographic scoring system.Ann Rheum Dis2005,64:127-129. 25. Kanis JA, Johnell O, Oden A, De Laet C, Mellstrom D:Epidemiology of
osteoporosis and fracture in men.Calcif Tissue Int2004,75:90-99. 26. van der Weijden MA, van Denderen JC, Lems WF, Heymans MW,
Dijkmans BA, van der Horst-Bruinsma IE:Low bone mineral density is related to male gender and decreased functional capacity in early spondylarthropathies.Clin Rheumatol2010.
27. Sarikaya S, Basaran A, Tekin Y, Ozdolap S, Ortancil O:Is osteoporosis generalized or localized to central skeleton in ankylosing spondylitis?J Clin Rheumatol2007,13:20-24.
28. Ralston SH, Urquhart GD, Brzeski M, Sturrock RD:Prevalence of vertebral compression fractures due to osteoporosis in ankylosing spondylitis.BMJ 1990,300:563-565.
29. Karberg K, Zochling J, Sieper J, Felsenberg D, Braun J:Bone loss is detected more frequently in patients with ankylosing spondylitis with syndesmophytes.J Rheumatol2005,32:1290-1298.
31. Toussirot E, Michel F, Wendling D:Bone density, ultrasound measurements and body composition in early ankylosing spondylitis.
Rheumatology (Oxford, England)2001,40:882-888.
32. Lee YS, Schlotzhauer T, Ott SM, van Vollenhoven RF, Hunter J, Shapiro J, Marcus R, McGuire JL:Skeletal status of men with early and late ankylosing spondylitis.Am J Med1997,103:233-241.
33. Toussirot E, Wendling D:Antiinflammatory treatment with
bisphosphonates in ankylosing spondylitis.Curr Opin Rheumatol2007,
19:340-345.
34. Santra G, Sarkar RN, Phaujdar S, Banerjee S, Siddhanta S:Assessment of the efficacy of pamidronate in ankylosing spondylitis: an open prospective trial.Singapore Med J2010,51:883-887.
35. Coates LBA, Creamer P, Hailwood S, Mattey D, Packham J, Taylor G:The effect of alendronate on ankylosing spondylitis; The results of the bisphosphonates in ankylosing spondylitis trial (BIAS).Ann Rheum Dis 2011,70(Suppl3), 128 2011.
36. Lange U, Kluge A, Strunk J, Teichmann J, Bachmann G:Ankylosing spondylitis and bone mineral density–what is the ideal tool for measurement?Rheumatol Int2005,26:115-120.
37. Jun JB, Joo KB, Her MY, Kim TH, Bae SC, Yoo DH, Kim SK:Femoral bone mineral density is associated with vertebral fractures in patients with ankylosing spondylitis: a cross-sectional study.J Rheumatol2006,
33:1637-1641.
38. Gratacos J, Collado A, Pons F, Osaba M, Sanmarti R, Roque M, Larrosa M, Munoz-Gomez J:Significant loss of bone mass in patients with early, active ankylosing spondylitis: a followup study.Arthritis Rheum1999,
42:2319-2324.
39. Maillefert JF, Aho LS, El Maghraoui A, Dougados M, Roux C:Changes in bone density in patients with ankylosing spondylitis: a two-year follow-up study.Osteoporos Int2001,12:605-609.
40. Greenspan SL, Maitland-Ramsey L, Myers E:Classification of osteoporosis in the elderly is dependent on site-specific analysis.Calcif Tissue Int1996,
58:409-414.
41. Grampp S, Genant HK, Mathur A, Lang P, Jergas M, Takada M, Gluer CC, Lu Y, Chavez M:Comparisons of noninvasive bone mineral
measurements in assessing age-related loss, fracture discrimination, and diagnostic classification.J Bone Miner Res1997,12:697-711.
42. Bronson WD, Walker SE, Hillman LS, Keisler D, Hoyt T, Allen SH:Bone mineral density and biochemical markers of bone metabolism in ankylosing spondylitis.J Rheumatol1998,25:929-935.
43. Gilgil E, Kacar C, Tuncer T, Butun B:The association of syndesmophytes with vertebral bone mineral density in patients with ankylosing spondylitis.J Rheumatol2005,32:292-294.
44. Schneider DL, Bettencourt R, Barrett-Connor E:Clinical utility of spine bone density in elderly women.J Clin Densitom2006,9:255-260.
45. Mermerci Baskan B, Pekin Dogan Y, Sivas F, Bodur H, Ozoran K:The relation between osteoporosis and vitamin D levels and disease activity in ankylosing spondylitis.Rheumatol Int2010,30:375-381.
doi:10.1186/ar3833
Cite this article as:Klingberget al.:Osteoporosis in ankylosing spondylitis - prevalence, risk factors and methods of assessment. Arthritis Research & Therapy201214:R108.
Submit your next manuscript to BioMed Central and take full advantage of:
• Convenient online submission
• Thorough peer review
• No space constraints or color figure charges
• Immediate publication on acceptance
• Inclusion in PubMed, CAS, Scopus and Google Scholar
• Research which is freely available for redistribution