TUBERCULOSIS : A SOCIAL SUEVEY. By WILLIAM C. KIDNEY, M.D., D.P.H., D.C.H.
{Read on Thursday, 21th February, 1947.)
Historical. Tuberculosis is essentially a disease of civilization,
which dates back to the earliest days of history. Tuberculous lesions have been found in ancient Egypt, in Mummies from the time of Rameses I and II, about 2,000 years before Christ, but whether the Egyptians recognised it or not, is not known.
The earliest published descriptions of tuberculosis are those of the Greek Hippocrates in his Epidemics, in which he reports 42 cases of Consumption, 25 of which ended in • death (a death rate of 59.5%).
In the first century before Christ, Aretaeus, a Greek physician of a Roman provence in Asia Minor, describes the symptoms of tuberculosis in great detail. He refers to the bony fingers, the sharp and slender nose, the prominent Adams apple and the narrow chest. Even at this stage it is recognised that phthisis is more common in those of asthenic or linear diathesis—a factor still held, though never actually proved to my knowledge.
Galen, about the year 17-5 A.D. knew that phthisis was infectious, saying " It is a matter of experience that those who sleep in the same bed with Consumptives fall into consumption, also those who live long with them, eat or drink with them, or wear their clothes and linen."" See how he interprets his observation. He recognises the infective nature of the disease, while to-day many incorrectly think that it is hereditary.
On 24th March, 1882, Robert Koch announced to the Physiological Society of Berlin, that he had discovered the tubercle bacillus, the cause of tuberculosis.
Thus we see five great historical facts about the disease, (i) its antiquity, (ii) its recognition as a separate disease, (iii) its relation to type or diathesis, (iv) its infectivity and social danger and finally
(v) the discovery of the cause.
It is the social aspect or environment of the disease, which concerns. us in this paper.
The Investigation.—Information was collected from various
sources, to represent as far as possible an accurate cross-section of the community.
(i) Data from a random group of 640 persons attending Dublin Corporation Tuberculosis Dispensary at, Charles Street in 1942.
(ii) Data from Domiciliary forms, concerning approximately 2,000 persons, recommended for admission from Dublin City to Sanatoria, during a period of ten years.
(iii) Information from death certificates of all persons dying of tuberculosis in the City of Dublin, during a period of 5 years. (1940-1944).
(iv) The results of a social inquiry on all persons, who died of tuberculosis in Dublin, during the year 1944.
Incidence and Trend. Since the disease is not notifiable, the
exact number of cases in the community is not known. Vines states that 10-20% of an urban population are actively infected with tubercle bacilli, though the conditions may be clinically latent. Using this figure we estimate that 40,000 to 80,000 persons in Dublin, are infected and that approximately 800 die every year—a mortality of 0*5 to 1*0%. Yet Cecil says that infection is common, but that less than 10% of those infected die of the disease. From tuberculin surveys, we know that about 95% of urban populations are infected at some time or other.
In 1942 there were approximately 1,600 new cases of active tuber-culosis, among patients attending the Dublin Corporation tuberculosis dispensaries at Charles Street and the Meath Hospital, but how many other cases were there in the city attending hospitals and private doctors? The following investigation was carried out to discover the total number of cases.
A random selection of 610 names of persons, who died of pul-monary tuberculosis, were traced to the records of these dispensaries. It wras found that 295 had attended Charles Street and 73 the Meath Hospital dispensary. The total (368) was 60-3% of the deaths examined. We # assume that the dispensaries deal with 60% of the cases of tuberculosis in the city (1,600), while other bodies deal with the remaining 40% (i.e., 1,066), making a grand total of almost 2,700 new cases of tuberculosis in Dublin each year, with a mortalitv of 30-7% (800 out of 2,700).
Hence we may say that 40,000 to 80,000 persons in Dublin are actively infected, that 2,700 are sufficiently affected clinically as to need treatment, while about 800 die per annum.
The mortality from tuberculosis has been steadily falling since 1901 (Geary 1930), apart from intermissions caused by war. A similar intermission occurred during the recent war.
The percentage decrease per annum in the Dublin T.D.R. has been 1*3% compared with an average decrease of 4-4% for 10 Capital Cities of Europe (Dillon 1943). That is, the decline has been less rapid than in other Countries.
Deficit hi Certification. Most of the calculations concerning
Inci-dence and trend of tuberculosis are based on the Registrar GeneraFs returns and collected from the data on death certificates. The ques-tion arises : is the informaques-tion correct, are all the tuberculosis deaths recorded as such and conversely are all the certified tuberculous deaths really due to tuberculosis?
There seems little reason to suspect that other conditions should be certified as tuberculous. The disease is a long one and it occurs at an age, when few similar diseases occur. In view of the duration of the disease there is every chance of bacteriological and X-ray investigation being carried out. This is more likely to be overlooked In the more acute forms, such as we find in childhood and in meningitis.
On the other hand, there seems to be many reasons why a tuber-culous condition might not be certified. The history may be concealed and if the patient's own doctor is not called in, another doctor may simply see a wasted patient, dying of terminal pneumonia or an Inci-dental influenza and certify death, as due to that cause. Significant symptoms such as night sweats, haemoptysis, chronic cough, loss of weight, or family history may be denied in an effort to avert a diag-nosis, which might be a " slur on the family.'7
a doctor and ask him to say nothing about tuberculosis on the death certificate. This has been asked of the author, and the reason given was that the patient had taken out, an. insurance policy with a small company, which accepted him without a medical examination, the patient making a statement that he is free from disease. Should death occur within a certain time, the company may allege, that the patient already had the disease at the time of signing the statement and con-cealed the fact, making the policy invalid.
In the Meath Hospital branch of the Dublin Corporation tuber-culosis dispensary, the cards of patients who die, are filed separately. These are all known cases of tuberculosis and death is reported by the nurses, who visit the patients in their homes. A random selection of 392 of these cases was made and their names traced to the records of the Kegistrar General. It was found that 315 (or 80-4%) of these were certified as having died of tuberculosis, while the remaining 19*6% were certified as having died of other conditions. It must be admitted that tuberculous patients, are also exposed to the risk of dying from other conditions, to which the rest of the population is exposed. Yet almost all of the cases, thus traced, were certified as having died of a respiratory disease (bronchitis, broncho-pneumonia, pertussis) or myocardial failure—either of which might have been actually caused by tuberculosis.
These figures suggest that even if we know the death rate from tuberculosis, we must add 25% to the estimated result, if we base our
calculations on death^certificate figures. Thus the figure (mentioned earlier) of 2,700 persons sufficiently affected clinically as to need treat-ment, should be increased to 3,375, while the mortality in Dublin would be about 950 per annum.
Dillon (1944) in a paper to .this Society, gave 195 as the number of new cases per 100 deaths in Eire and 214 per 100 deaths in Dublin; though he suggests that mass radiography has revealed a large number of active cases in addition to those already known—about another 10%. Hence the figure of 235 is reached, and this again must be in-creased by the 20% due to deficit in certification, making an estimate of about 280 new cases per 100 recorded deaths in Dublin.
Type of Disease. The pulmonary form of the disease is by far
the commonest, 10% of all patients attending the Corporation dispen-sary are non-pulmonary cases, but this is not a true estimate. Many are treated in hospitals or in their own homes and do not pass through
Charles Street.
Out of 4,090 deaths from tuberculosis in Dublin in 5 years, 529 were due to non-pulmonary conditions, i.e., 12-8% of all deaths from tuberculosis. This includes 87 cases of miliary tuberculosis and 236 cases of tuberculous meningitis, many of which cases were also pul-monary.
Pulmonary is therefore the commonest cause of death. Meningitis is the next common. It is certainly the commonest cause of death in children. Its death rate is known to be 100%.
Season. Cecil states that climate is of little importance in the
etiology of tuberculosis, though elsewhere he states that meteorological conditions have an influence and help to explain the trend to activa-tion in late winter and spring.
iirst quarter. Intercurrent disease (bronchitis, pneumonia, influenza, -etc.) plays havoc with patients weakened by long illness and probably -accounts for the high rate in the first quarter.
Total Deaths in the Combined Quarters of 1940-1944.
First Quarter 1207 =-29-0% of total. .Second ,, 1194-28-5%
Third „ 892 = 21-4% Fourth ,, 858 = 20-6%
It will be noticed that the second highest rate occurs in the second -quarter, which corresponds to spring rather than the early winter
quarter (Oct.-Dec.)
These figures however, relate to the time of death and are probably not as important as the time of infection. The latter is difficult to estimate, since the disease is of insidious onset and the patient is un-aware of it for some time.
Death certificates provide space for recording the duration of illness. This information is not always available and then often not very accurate, particularly where the illness has been prolonged.
Using the date of death and taking all cases of less than two years duration as being reasonably accurate, the actual month of onset of clinical diseases was calculated and the results are tabulated below.
January February March April May July August September October November December
Estimated Month,
Month
of Onset
Pulmonary 63 63 60 56 59 78 65 63 38 52 59 62 '
of Disease.
Non-Pulmonary
21 6 25 20 20 9 9 9 9 10 11 13
Total 84 69 85 76 79 87 74 72 47 62 70 75
Although there appears to be a tendency for most disease to begin "in winter and spring, the figures do not appear to be sufficiently
sig-nificant to justify any definite conclusions.
Occupation. It was hoped to estimate the mortality from
tuberculosis in different occupational groups, but several factors made this investigation of doubtful value.
The first difficulty was to obtain a satisfactory classification. Geary used a modified form of the Registrar General's Classification, in which the occupations are divided into four groups (plus a fifth for work-house inmates), subdivided into a total of 17 sub-sections.
to themselves (often the only members of the household to have ar; bedroom of their own), and eat the same food.
The next difficulty is that occupation only applies to adult males-and some females. Children, wives,-students cannot be classified.
The final difficulty was to discover the actual number of persons in. the group, i.e., those exposed to the risk of the disease. It would be useless to say that there was a greater number of deaths among printers than among bishops, unless we know the number of bishops and printers in the country. This information could be obtained from the census, but it is given in such detail that it would be an investigation in itself to work out a standard.
Information concerning occupation, although collected, is not presented, since it is not considered to be of sufficient value, under the circumstances.
Race. When tuberculosis first attacks a community, infection is-.
widespread, resistance is low and there is a high mortality after a rapid course. In the second phase, the disease is chiefly concentrated in the most susceptible group—the young adult group. Others have -gained some immunity and the disease is more chronic than in the first phase. In the third phase, the disease is found in the older persons, it is more chronic and there is increasing resistance in the younger adults.
The Jews, being an ancient civilisation, have passed into the third phase and have an unusual degree of resistance to the disease. On the other hand, the Irish are a younger race and are .particularly susceptible to the disease, though their resistance is greater than that of a primitive tribe which has never been exposed to it.
Geary, in an excellent paper on the mortality from tuberculosis^ read to this Society in 1930, refers to an investigation carried out by Dublin and Baker on the " Mortality of Race Stocks in Pennsylvania, and New York, 1910 ", in which it is shown that " in both States the male phthisis mortality rate (of Irish Immigrants) was 3-J times as, great as among the native-born and more than twice as high as for any other race stock on the list ".
Age. Age is probably the greatest factor in the etiology of
tuber-culosis. Primary infection and bone disease are most common under-the age of 15 years, while under-the true adult or tertiary type of pulmonary-disease is most prevalent in the 5-25 years age group.
Table I gives the actual number of deaths in each of the age groups... It shows that there is a steady rise in the number of deaths in eaeli group up to the 15-25 group, and then a falling off as age increases.. So, too, we see that the percentage of the total deaths from tuberculosis-in Dubltuberculosis-in gives a similar group. Likewise, the deaths from tuber-culosis expressed as a percentage of the total deaths, rises from. 2-21 per cent, in infancy to 65 per cent, in the 15-25 group and there-after fall away, until only only 0*59 per cent, of the total deaths over-the age of 75 are seen to be due to tuberculosis.
The age groups are not really comparable, however. The first group is 1 year, the second is 5, and all others are 10, except the last, which is limited only by the maximum span of life.
647
GRAPH I.
from Tuberculosis expressed as a percentage of the Total Deaths in each Age Group (Dublin, 1944).
-The size of the group is also of importance. In a growing population the younger the group, the greater the number of persons. in that group, but in a country with a falling birth rate the older group become relatively larger, provided the other limits of the groups are equal. However, this is not so in several cases. The individuals, in the under 1 group are only exposed to the hazard of 1 year, while those of the groups over 5 years are exposed to it for 10 years.. Hence-these latter groups appear bigger and have correspondingly larger numbers of cases of the hazard. In other words, the distribution of" the population into groups depends on the number of persons and the number of years.
TABLE I.
DUBLIN : Total Deaths
in 5 years 1940-44 • Average Total Deaths all causes, 1944 Estimated Population EIRE : Total Deaths from T.B., 1944 Total Deaths all causes CHARLES ST. New Cases (Living). Jan-Jun., 1942 Under 1 96 19-2 1,443 12,328 58 5,198 4 1-5 215 43-0 254 36,135 170 1,286 32 5-15 243 48-6 143 92,070 234 869 152 15-25 1,080 216-0 300 87,120 926 1,552 206 25-35 897 179-4 290 66,825 874 1,689 117 35-45 657 131'4 340 51,975 625 1,890 54 45-55 529 105-8 622 51,480 460 2,966 35 55-65 315 63-0 1,079 45,035 302 5,606 18 65-75 115 23 ],438 33,165 161 11,165 2 ; 25 ; 5 i,i es 14,850 29 12,907 0 TOTAI. 4,17O-834 7,07? 495-C0ft 3,83&
4 5 , 1 2 ^
62a
Table I gives the distribution of the population in Eire and? in the absence of figures for Dublin City, it may be assumed that it is similar to that of Eire. It will be seen that 1-81 per cent, of the population are under 1 year, 7-23 between 1 and 5, and 18-60 between 5 and 15. Thereafter the size of the group falls slowly by about 12 per cent, p e r decade, until those over 75 years constitute only 2-96 of the population. These difficulties can be overcome by estimating a rate per 1,000 of the population living in each age group (Table III). This shows that the highest rate of deaths from tuberculosis is in infancy 2-69 per 1,000-population (Table III). In childhood this rate falls to 0-49 in the 5-15 group and rises rapidly to a second peak in the 25-35 group and then falls away again. This is the most accurate estimate of the dis-tribution of the disease. It shows that there is a high mortality in infancy and again in young adult life.
TABLE II.
Distribution of Tuberculous Deaths, as percentage of Total. (Average 1940-1944).
Under 1 year
2-30 1-5 years
5 1 5 5-15 years 5-82
15-25 years 25-89
25-35 years 21-51
35-45 years 15-75
45-55 years 12-68
55-65 years
7-55 65-75 years 2-75
75 -years 0-59
occur in the city, which is consistent with the usual finding, that disease is more prevalent in urban areas.
Expressing the deaths in Dublin in each age group as a percentage of the total deaths in Eire, we find that the figures vary between 18 per cent, and 28 per cent., except in the case of infancy, in which it is 55 per cent., and in the 65-75 age group, in which it is only 13-6 per cent. Speculation on the high infant death rate from the disease suggests that
(I) there is a greater danger of infection in the city, or
(II) the disease can be more accurately diagnosed in infants in the city, due to better hospital facilities,
(III) the rate for the year under examination (1944) was abnormally high in infancy. However, the average for 5 years (19-0) is 32 per cent, of the Eire rate of 1944
(Table III).
TABLE III.
Death Rate from Tuberculosis. Per 1000 Population (1944).
75-years
0-47
To summarize the value of the classification by age groups : We see that tuberculosis is most common in Dublin in the 15-25 year age group (25-89 per cent, of the total). This shows that we are still in the second phase of tuberculosis as a disease of the community. It constitutes the commonest cause of death in the age groups 15-35 years. It causes 65 per cent: of all deaths in the 15-25 year group. Finally, the distribution of the ages of the living cases attending the Corporation tuberculosis dispensary at Charles Street in 1942 (January-June) is added for comparison. Very few infants attended and there were no new cases over 75 years. The cases mostly consisted of children 5-15 (cases of primary tuberculosis) 24*5 per cent., and young adults 15-25 years, 33*2 per cent.
Sex. Sex has little influence on the incidence of tuberculosis. Of
the 1,902 cases on the domiciliary forms, i.e., recommended for admis-sion to Sanatoria, the males numbered 965 and the females 937; i.e., the incidence is almost equal.
If these are divided into pulmonary and non-pulmonary (mostly surgical cases), we find that the surgical show a significant prepon-derance of females (170) against males (119), while the pulmonary group are almost equal (846 males against 767 females).
Under 1 year
2-69 1-5 years
1-32 5-15 years 0-49
15-25 years 2-23
25-35 years 2-58
35-45 years 2-23
45-55 years 2-CO
5 5 - 6 5 y e a r s
1-50 65-75 y e a r s
650
The new cases attending Charles Street consisted of 326 males and 294 females.
The sex distribution of all deaths from the disease in 1940 to 1944 was 2,204 males against 1,967 females.
In each of these groups (except the surgical) there appears to be a very^ slight though persistent preponderance of males, while the surgical cases show a 2 1 ratio between females and males.
Marital Condition. According to information received from the
domiciliary forms, 35 per cent, of all cases were married, 62 per cent. single, 2 per cent. widowTed (and 1 per cent, not stated). The surgical group showed a higher incidence of single, 75 per cent., against 24 per cent, married and -4 per cent, widowed—probably due to the greater number of younger patients in the group. The pulmonary groups had 37-5 per cent, married, 59-8 per cent, single and 1*7 per cent, widowed, while there was no information in the remaining 0-6 per cent.
The Statistical Abstract provides information as to the number of married, single and widowed males and females. Using these figures, it is found that 28*37 per cent, of the total population are married, 65*5 per cent, single and 6*16 per cent. widowred.
The male tuberculous deaths are divided as follows:—19*3 per cent, married, 30-8 per cent, single and 2-8 per cent, widowed, while the females are 12-1 per cent, married 32-5 per cent, single and 2-5 per cent, widowed. The table shows the comparison between the age groups of the tuberculous and non-tuberculous. It will be seen that In those age groups in which there is a high tuberculous mortality there is a greater proportion of tuberculous persons in each of the groups, roughly twice the percentage in the corresponding group of the total population, i.e., in all classes the figure is higher for the tuberculous in the 15 to 45 age groups and lower in all other age groups. The same observation applies to the (single) infants under 1 year.
Apart from this observation, which is due to the age distribution of tuberculosis, marital condition appears to have little effect on the incidence of the disease and conversely tuberculosis does not appear to influence the incidence of marriage.
TABLE IV.
Comparison between Marital Conditions of Total Pop., and that of Total Tuberculous Cases dying in
1940-1944, by ages and expressed in percentages of the Totals. MALES Married ... Single Widowed FEMALES : Marries! ... Single Widowed . 0-1 Pop. 0 T B 0 Pop 0-91 T.B. 1-27 Pop. 0-0 T.B. 0-0 Pop. 0-0 Tub. 0-0 Pop. 0-88 Tub. 1 -12 Pop. 0-00 Tub. 0-0 1-5 0 0 3-78 2-65 0-0 o-o 0-0 o-o 3-65 2-05 0-0 0-0 5-15 0 0 9-15 2-47 o-o o-o o-o o-o 8-87 3-12 o-o o-o. 15-25 0-14 •45 8-50 10-08 0-0 0-02 0-52 1-77 7-92 13-55 o-o o-o 25-35 1-85 3-35 5-37 6-52 0-03 0-20 3-16 3-C2 3-88 7 27 0-05 0-37 35-45 3-24 5-08 2-72 2-92 0-10 0-35 3-88 4-00 1-92 2 77 0-24 0-50 45-55 3-23 5-60 1-72 2-77 0-22 0-77 3-14 2-22 1-28 1-07 0-54 0-80 55-65 2-73 3-48 1-35 1-45 0-40 0-92 2*25 0-80 1-06 0-77 1-00 0-30 65-75 2-02 0-72 0-99 0-55 0-68 0-55 1-28 •22 •85 •40 1-39 0-35
651
Place in Household. The status of the patient in his household is
of considerable importance. If the principal wage earner is affected, the whole family will be deprived of the means of existence and, as is frequently found, may try to manage oh National Health Insurance of 15/- per week (reduced to 7/6 after six months). The lack of adequate nutrition, associated with the presence of an infected adult in the house, is probably the biggest factor in the spread of the disease. It is not uncommon to see two or even three deaths among children, from tuberculous meningitis in a single family, while a known tuberculous adult is awaiting sanatorium treatment.
In the survey, in which 382 completed forms were returned, 72 (19-0 per cent.) of the cases were described as the father, husband or principal wage earner, while the mother or wife was affected in 12-7 per cent, of cases. Other dependents were 68 per cent, of the cases. They included children, relatives and single persons.
TABLE V.
Father (or Husband) Mother (or Wife) Son
Daughter Kelative
Lodgers ... ... ... Adult Families
Domestic Servants Other Employees Inmates in Institutes Heligious in Institutes (Male) Heligious in Institutes (Female) Army, Gardai in Institutes
Occupied 72 42 52 6 13 14 6 3 3 4 4 219
Dependent
48 36 65 2 1
11
163
The dependents (other than wives) were divided into unoccupied (30-7 per cent.) and occupied (27-2 per cent.), i.e., those earning sufficient to contribute to the family exchequer or to relieve part of the cost of keeping them.
If the mother is the patient, the family income is not appreciably altered (except for extra expenditure on medicines, etc.), but there is probably a greater danger of children being infected.
The matter of source of infection will be treated further on in this paper.
652
ANTI-TUBERCULOSIS SECTION, IRISH RED CROSS SOCIETY.
SOCIAL INQUIRY.
Confidential*
1. Name : 2. Age 3. Sex
4. Place in Household" 5. Occupation • 6. Address:
7. Type of Dwelling :
(a) Street : I Number District: (b) House; Flat over Shop; Flat ; Tenement?
(c) Floor in House : No. of Rooms (d) Number of Rooms in House :
(e) Number of Persons in House :
(/) Landlord ; Corporation ; Building Society ; Private (g) Where is Water Supply ?
(h) Where is Lavatory ? (i) Is there a Bath ? (;') Where is Fuel Kept ?
(k) Condition of House—Clean? Repair Condemned?
8. Examination of Contacts : (a) Number in Family Examined (b) Number Diagnosed as Tuberculous (c) When Examined
(d) Where Examined •
(e) Deaths from Tuberculosis in Family ? , (/) Are other members with Disease
(i) Getting Treatment ? (ii) Where ?
(g) Have Patients Separate Sleeping Acccmmode.tion
(a) Date of Death of Patient (b) Place of Death:.:
(c) Was the Patient receiving Sanatorium Treatment ?. (d) For" How Long ?
(e) Was Patient Discharged from the Sanatorium ? (/) Did Patient Leave for any other reason ? ] 0. Number in Family •
(a) At Date of Diagnosis : Under 15 Over 15 Total in (Including the Patient) Males Females Males Females Family
11. INCOME AND EXPENDITURE. Confidential.
(N,B. Income should not include St. Vincent de Paul or other Charity.)
INCOME OF PATIENT (per week).
Wages or Salary
Unemployment Insurance Unemployment Assistance National Health Insurance Home Assistance . . Pensions
Other Sources
Food Vouchers ... Tuberculosis Nourishment
TOTALS INCOME OF FAMILY (per week).
(Other than Patient). Father
Mother ... * Sons ...
Daughters
Lodgers' Contributions Others
Food Vouchers Fuel Vouchers Family Allowances Pensions
Infant-Aid Milk Other Sources,
TOTALS
At Date of Diagnosis
During
654
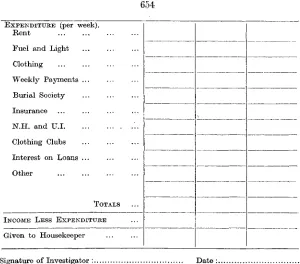
EXPENDITURE (per week).
Bent
Fuel and Light
Clothing
Weekly Payments ...
Burial Society
Insurance
N.H. and U.I '..
Clothing Clubs
Interest on Loans
Other
TOTALS
INCOME LESS EXPENDITURE
Given to Housekeeper
. .__ .
Signature of Investigator : Date :.
The Survey. Hitherto the investigation has dealt with factors
con-cerning the patient himself and most of the information was derived from death certificates.
In order to obtain data concerning the housing and economic circumstances of the patient, it was decided to carry out a social inquiry. It was necessary to obtain a representative group of the tuberculous population, not confined to any district dispensary or social status. The chosen group were all patients who died of the disease in Dublin during the latest available statistical year 1944.
It was found possible to visit the relatives of 608 patients. The visiting was carried out by Social Science Students at University College, Dublin, under the direction of Mrs. Maguire. It was an arduous and unattractive job and each visit averaged nearly one hour. The results were classified into groups as follows :—
[image:13.386.41.341.36.300.2]TABLE VI.
Information Supplied Information Refused Not Traced
No Source of Information Institutions (Inmates) Domestics
(57-7%) (10-7%) (21-5%) ( 4-1%) ( 4-7%) ( 1-3%)
100%
655
cases wrote abusive letters to the directors of the survey. Others complained bitterly about details concerning the patients' disease— delay in diagnosis, waiting for sanatorium treatment and other inconveniences.
In 21-5 per cent, of cases the patient was unknown at the stated address or his family had moved to a new address, leaving no infor-mation as to their whereabouts. It is remarkable that in these days 21-5 per cent, of the population can disappear. Some of these cases may not have been traced because of wrong or insufficient address.
In 4 per cent, there were no survivors (e.g., the patient may have lived alone), while in the remaining 6 per cent, the information was of little value, because the " house " was an institution or because the patient was a domestic and the address gave no information as to the social status. " Institution " was used to cover (1) inmates in special hospitals or other places (2) religious male; (3) and female; (4) lodging houses, Army, Gardai in barracks? etc.
- The inquiry was divided into certain sections. The first dealt with personal factors, name, address, age, sex, occupation, position in house-hold, which have already been discussed. The second section dealt with the house, the third with the contacts and the fourth with the patient's own disease and treatment.
Finally, the income of the patient and of the whole family and the expenditure on certain details was investigated, with reference to its state before, during and after the illness. The answering of this last section was unsatisfactory and there was little data of value, beyond total income, rent and insurance. These will be discussed later.
The Patient's Dwelling. Much of the information treated in this
paper is supplied by the relatives and may not be very accurate. Hence we make our own observations on the social status of the patient, on his environment and on the dangers to which he is exposed. The dwelling or the house of the patient usually reflects these with a considerable degree of accuracy.
Once again, however, wre are faced with the problem of showing whether the tuberculous patient is living under conditions similar to or differing from those of the rest of the population. Standards are only available for certain factors, such as house density, hence these will be our most valuable criteria in estimating the effect of economic conditions on the incidence of the disease.
District. There appears to be a high incidence of tuberculosis in
certain streets and districts. It is hoped to investigate this later. Dillon (Studies, June, 1943), pointed out the remarkably high death rate in Crumlin in 1942 and suggested that it was due to the high proportion of adolescents and young people in this artificial com-munity. Another reason which he overlooks is that tuberculosis in a family is one of the deciding factors in the patient's favour in allot-ment of Corporation houses. This means that there is a greater number of tuberculous persons introduced into the community and also there must, therefore, be an increased risk of infection. The latter danger, however, is offset by the removal of the danger due to overcrowding.
656
Type of Dwelling. The table (VIII) shows the type of dwelling
occupied by the relatives of the cases in the survey. TABLE VIII.
Houses Flats Tenements Institutions ... Lodging Houses
232 = 53-9% of total. 80=18-5%
90 = 20-8% 22= 5-0% 8= 1-8%
The flats included 18, which were described as " flats over shops ". A further group of 18 are domestic servants, whose status is not related to their type of house. It will be noticed that the number of domestics in this classification is greater than in the previous classification. This variation is due to the answers in the survey form. If all information is complete in the section under consideration, the case is included, although mlormation may not be sufficient to warrant inclusion in other sections.
The Corporation of Dublin was approached with a view to finding out the total number of dwellings in each of these classes, but sucli information is not available, beyond the fact that there are over 104,000 dwellings in the City.
Rooms. The number of rooms per dwelling is of more interest. If
wre take the number of rooms as an index of the size of the dwelling, wre find that there are more patients from " single-room " dwellings than from any other type..
TABLE IX.
Distribution of Gases accordinj to Number of Rooms expressed as a percentage, and comvired with Total Population.
Rooms Tuberculous Cases Total Population ...
1
23-7 19
2
13-4 16
3
15-3 18
4
2 3 1
15 5
15-3 12
6
3-4
8 7
3-4
5 8
0-9
3 1-2
3
A table of the number of cases coming from dwellings of different sizes shows a peak in the 1-room dwellings and an almost equal peak in the 4-room dwelling. It also shows the distribution of the population of Dublin County Borough according to similar groups. Here we see that more people live in 1-roomed dwellings than in any other group, but the secondary rise is in the 3-roomed group, as com-pared with the 4-roomed group in the survey. Is this explained by the fact that Corporation dwellings are mostly 4-roomed?
Forty-eight out of a total of 74 4-roomed dwellings were owned by the Corporation, while only 8 of the same group were privately owned. Of the survey cases, 36 per cent, lived in 1 or 2 rooms, compared with 34-9 per cent, for the whole population of Dublin City and 16*8 per cent, for the whole of Eire.
The average number of persons per room in the '' domiciliary form 7f
These figures show that there is a marked difference between the Toom density of-the tuberculous and that of the total population and confirms the belief that overcrowding is a significant factor in the aetiology of tuberculosis.
Number in Family. Closely related to the number of rooms
occupied and the number of persons per room is the size of the family. The larger the family the greater the risk of disease passing to the other members, since there are more persons exposed and ultimately there are more cases per family. Besides this, we must realise that there is Lisually only one person providing for the family and, since his income remains the same, larger families must be exposed to the dangers of overcrowding and must exist on a proportionately smaller expenditure per head on food.
It was not possible to discover the average size of families in the whole country, but a very rough estimate can be made from the following figures :—There are approximately 1,000,000 married or widowed persons in the community, i.e., 500,000 families, with almost 1,000,000 persons under the age of 20 years, i.e., 2 children per family, or 4 persons per family, including parents.
The survey figures give an average family size as being 5-43 persons (including parents).
The domiciliary forms number 9,079 dependents on 1,902 families— an average of 4-7 persons per family.
The control group taken from the National Maternity Hospital showed that 1,000 random families had 3,798 dependents—almost 3-8 persons per family. These, however, appear to be young families, since the mother was still in the child bearing-age, but this is also the age at which tuberculosis is most common.
It would seem, therefore, that the tuberculous families in two separate investigations average 5*43 and 4*7 persons per family, com-pared with 3-8 and 4*0 persons per family in two different control series.
Contacts. There was a definite history of known contact with
another tuberculous patient in 28 per cent, of all cases attending €harles Street in a period of six months, and in almost all these cases the contact was a relative or member of the patient's family. How often ha've we heard a new patient say: " But it's not in the family, doctor". This must be true for 72 per cent, of all cases of tuberculosis.
The domiciliary forms reveal a slightly higher incidence of contact, 35*6 per cent, were known to have been in contact with cases, though some of these (5-2 per cent.) were not members of the family.
The incidence of contact between various members of the family is set out below. It is interesting to note that most infection comes from brother and sister. However, it must be borne in mind that one is liable to have several brothers or sisters, but only one father or mother. If we allow for this, we will find that most infection probably comes from fathers and mothers to their children.
It is surprising to see that there appears to be less infection between husbands and wives than between any other group. Also we see that •children do not often infect their parents.
658
examined in 96 cases and 24 were not stated. These figures are a tribute to the work of the Corporation tuberculosis dispensaries.
TABLE X.
Contacts.
Father Mother ... Husband Wife Son Daughter Brother Sister
2 or more in family ...
75 64 15 16 ... 33 ...» 38 ... 117 ... 141 ... 91
Uncle . . Aunt
Neighbour ... Relative Others
30 27 17 14 11
Total family contacts, 590, and total " outside " contacts, 99. The source of infection was in the family in 75-2 per cent, of these cases, while 24*8 were from outside. It must be realised that family contacts will always be recognised, while external sources may not be obvious. There must always be a source of infection, whether it be known or not. Therefore, we must say that the family was the source
in 590 out of 1,902 cases, i.e., 31 per cent., while in nearly 70 per cent, the infection came from outside the family. It is possible that some members of the family may have been overlooked, though this is becoming less likely, particularly in patients attending Charles Street, since every effort is made to discover contacts.
This section has been included here, because the results of over-crowding due to room density is most clearly reflected in this section. Price, in a report on a tuberculin survey carried out by the Irish Paadiatric Association, gives a table indicating the source of infection in 38 cases.
The cases were mostly under 5 years and the source was in the parents in over 50 per cent, of the cases—due, no doubt, to the close contact between young children and their parents.
Landlord. One of the questions in the inquiry sought to obtain
information concerning the ownership of the dwelling. Apart from institutions and lodging houses, all others were divided into (1) houses; (2) tenements, and (3) flats, each of these groups was classified according to ownership.
The total number of houses occupied by the patient was mentioned earlier in this paper as being 232, but in this section sufficient infor-mation was available to classify 153 houses occupied solely by the patient and his family.
Owner Landlord ... Owned by tenant Corporation Building Society Employer ... Not stated
TABLE X I .
Houses 26 31 70 19 3 5
- Tenements 71
0 7 3 1 8
Flats 34
2 ' 31 7 2 2
The word 'i landlord " is used to describe any person who owns
659
cases were less than 5-roomed houses. Seventy-one out of a total of 90 tenements were owned by landlords. Thirty-four out of 77 flats. were owned by landlords.
It appears that the smaller the dwelling the more likely is it to be owned by a person other than the tenant.
Privately-owned dwellings numbered 31 out of 153 houses. All of them had more than 4 rooms. None of the patients living in tenements owned their premises and only 2 of the flat dwellers owned the property (out of 77 flats).
The Corporation owned one-third of the dwellings of the tuberculous patients in this series—70 out of 153 of the houses, 7 out of 90 tenements and 31 out of 77 flats. The important question which arises is this: Is there a higher incidence of tuberculosis among the class which occupies Corporation dwellings or are tuberculous patients more likely to acquire Corporation houses and flats! Almost all of the Corpora-tion houses were 4-romed, though a few were 3 and 5-roomed, while most of the Corporation flats were 3-roomed, with a smaller number 2 and 4-roomed.
Building Societies, British Legion and Army dwellings numbered 19 houses (10 being 4-roomed); 3 tenements, and 7 flats (2-5 rooms in each.
Employers or firms for whom the patient worked provided accom-modation in 6 cases (3 houses, 1 tenement and 2 flats).
Other Measures of Status of Dwellings. I—Water Supply. There
was a supply of water to all houses in the survey. The accompanying table (XII) shows the type of water supply :—
TABLE XII.
Laid On In the Landing Outside (in yard, etc. Not Stated
It will be noticed that one-third of the patients had to leave their dwelling to obtain the first necessity of life in some public place.
II—Lavatory. The same division was used to estimate the number of cases which had to use sanitary accommodation available to more than his household.
TABLE X I I I .
Lavatory Inside the dwelling Outside the dwelling Not Stated
Houses 119
91 22
Tenements 36 49 6
Flats 57 18 5
Almost 40 per cent, of the patients in this survey had sanitary accommodation outside the dwelling.
660 TABLE XIV.
Bath No Bath ... Not Stated
Houses 122
90 20
Tenements 1 84 6
Flats 37 39 4
It will be noticed that only 1 tenement boasted a bath and that more than 50 per cent, of the flats were without one.
IV—Fuel Storage. Fuel is a necessity and provision must be made ior storing it. In many dwelling there is no such place provided and the fuel encroaches on the living accommodation. In these days it is essential to keep the fuel (turf) under cover. The following table shows how often accommodation is provided for fuel without having to have it in the living room:—
TABLE XV.
Houses 19 58 50 74 28
Tenements 72
9 3 1 7
Flat 39 27 2 6 6 (a) Fuel Kept in the Room ...
(b) Coal House ...
(c) Outside Shed (under cover) (d) Outside Shed (open) (e) Not Stated
Floor Level. Where the patient's family did not occupy the whole
of the building the floor level was noted.
Floor
TABLE
Basement Ground First Second Third Fourth
Floor ,,
,, XVI.
Cases o
31 42 ... 35 20 ... 35
In 134 cases the patient had to climb stairs to enter or leave his home.
Condition of Premises. Ignorance, unhygienic conditions and lack
of sunshine are referred to by Griffith and Mitchell (1942) as pre-disposing causes of tuberculosis of the greatest importance. Cecil, too, refers to ignorance as a big factor.
661
condition of the premises. The following is a summary of the results:—
TABLE XVII.
Condition of Premises.
-Clean
'Otherwise Stated
Flats
13 8
Dirty or badly kept premises constituted 11-0 per cent, of the houses, 14-4 per cent of the flats and 38-0 of the tenements, indicating
tb&t ignorance, lack of interest and dirt are more common in the
poorer classes, but whether these are the results or .the causes of poverty Is very difficult to decide.
State of Repair. The answers to the questions in the last section
were decided on by the condition of the premises in relation to defects that could and should be corrected by the occupier, such as dirtiness
<BT untidiness.
A separate section questioned the structural condition of the home. Leaking roofs, broken floors and woodwork were the main criteria of structural defects. The results were stated as follows :—
TABLE XVIII.
Repair of Premises.
"•Clood
'Otherwise Mot stated
Houses 143
19 65
Tenements 27 53 12
Flats 61 14 15
Here again the same distribution of defects is seen. The highest proportion is in the tenements and the lowest in the houses. While education would be necessary to decrease the incidence of dirty houses, the law is responsible for taking any action necessary to insure that houses are kept in a fit condition for human habitation.
Twelve premises were said to have been condemned, tenements, 1 was a flat and 2 were houses.
Nine were
Valuation. The valuation of a premises is defined as the amount
that might be derived from them, if let at a reasonable rent (excluding s, etc.).
I t is felt that the valuation of a dwelling should give a true index --of the occupier's economic status. Where there are a number of occupants, the valuation divided by the number of occupants might
662 TABLE XIX.
Valuation of Patients' Houses.
Families per House
One
Two or More ...
TOTAL 0-5 11 3 14 5 -10 90 5 95 1 0 -15
27
19
46 1 5 -20 9 22 31 25 8 24 32 Valuation in.
2 5 -30
6
14
20 3 0 -35
2
12
14
Pounds
3 5 -40
1
5
6 4 0 -45
0
6
6 4 5 -50
0
1
1 5 0
-. 55
0-7
7
' 5 5
-6 8
; o
3
3 ©v<e;r - 6 ©
O
20
Difficulties were as follows :—
I—A family might occupy only part of the house—hence it would be necessary to divide the total valuation by the total number of* occupants—and this would only be of value if the occupants? were evenly distributed throughout the house.
II—There is no classified list giving the number of houses of each value, i.e., a standard is needed.
Ill—Shops and business premises may be responsible for most of the valuation, and since many families may live in part of such-premises, it is difficult to assess the true value of their holdings:.
There are approximately 104,000 houses in Dublin County Borough and the total valuation is £2,818,555, i.e., an average of £27-1 per house. The population in 1943 was 618,997, making an average valuation of £4-5 per person. (Stat. Abstract, 1945.)
Sleeping Accommodation. Overcrowding is reflected to some
degree in the provision of sleeping accommodation. Sleeping with a tuberculous patient is one of the easiest ways of becoming infected. Hence it is necessary to ensure that the patient has his own separate. bed and, if possible, his own bedroom.
The. following distribution of sleeping accommodation was observed in 1,959 cases—mostly taken from the domiciliary forms—with the addition of a number from the survey:—
Had Separate Bed Had Not Separate Bed
TABLE XX. Sleeping Accommodation. Married 181 580 Single 769 398 Widowed 21 10 Total 971
More than half the cases slept in beds occupied by at least one other-person, who must have acquired some infection. These included 40CI1 single or widowed persons who, through poverty, were unable to provide separate beds.
663
tlie rent. It may be expressed as actual rent, as rent per person and :a$ a percentage of the family income. All three methods are
important and are shown in the accompanying tables. TABLE XXI.
Rent in Shillings.
Shillings
Cases
0-5
84
5-10
128
10-15
85
15-20
20
20-25
4
TABLE XXII.
Rent per Person in Shillings.
Shillings
Cases
1
59 2
133 3
66 4
25 5
11 6
5 7
8 8
2
25-30
4
30-35
6
35-40
1
9
3 10
1 11
3 12
0
over 12
3
It has already been stated that one-third of all those in the survey lived in Corporation property. In this class the rent paid by the tenant is not the economic rent. The Eeport on the Inquiry into the Housing of the Working Classes in Dublin showed that the Corpora-tion flat dweller is charged about one-third of the economic rent, the rest being borne by a State subsidy and by the rates. The occupant of a 4-roomed cottage is charged about two-thirds of the full economic r e n t
These figures must be remembered when considering the rents. The average rent paid by families in the survey was 9*80 shillings per week, compared with an average of 9-5 shilling per week in the control group attending the National Maternity Hospital. The ..average rent per person per week was 1-79 shillings, compared with "2-5 shillings in the control group.
These figures show that there is some agreement, though not in the rent per person, because the National Maternity Hospital families were young families and were therefore smaller than the tuberculosis families.
Income. The final aspect of the investigation deals with the income
-of the patient and his family. This should be the absolute and final Index of the economic condition, yet it was the factor which caused
most trouble.
Many patients refuse to give indications of their incomes, others— in fact, almost all, minimised the amount in order to obtain as much assistance as possible. Many of the wages stated were far below the minimum trade union rates. Hence the figures became unreliable. Nevertheless, they are presented for what they are worth.
664
GRAPH II.
Bent expressed as a percentage of Total Income.
-
too-IO 15 2O 25 3O 35 4O
RENT AS PERCENTAQE OF INCOME
5 Q
the new standards can be calculated accordingly. In spite of tills?, increase (where it has occurred), the elevated cost of living has more! than offset the income increase and the average wag'e earner is> not a s . well off as when the estimates of income were made.
The average income per family in the control series was 58*8 shillings per week, or 15*5 shillings per person per week. These figures, which were taken from 1,000 public patients seeking admis-sion to the National Maternity Hospital in the year 1939. This year was chosen, since it represented the last normal year before the war. The Statistical Abstract (1945) gives the average male income in-1938 as 54/11 and as 64/7 in 1944. The average female ineome was. 29/10 in 1938 and 35/- in 1944.
The average family income in the survey cases was- 90*3 shillings, per week, or 16-6 shillings per person per week.
This large variation between the income of the living tuberculous^ the control, the average of the country and that of the survey group
The-TABLEXXIII Income per Family in Shilhn
Income in Shillings 20 40 60 80 100 120 140 160 180 200 over 200 Domiciliary Forms 351 524 432 283 134 45 10 8 1 3 0 Source Survey 10 34 70 74 56 32 26 15 7 8 -15 1 Control Group 141 286 370 152 40 0 1 0 0 0 0 TABLEXXIV Income per Person in Shillings
Income in Shillings 10 20 30 40 50 60 70 80 90 100 Domiciliary Forms 1,096 540 09 23 6 1 1 1 1 1 Source Survey 80 155 65 24 8 2 2 1 0 4 Control Group 368 356 206 49 10 0 o. 0 0 0
survey was carried out in 1945 and based on eases which died in 1944. The question sought was the family income before the onset of the disease—in most cases this must have been at least 2 years prior to death, i.e., about 1942 or even 1941, a time when the figures should correspond rather closely to the average. It is possible that the relatives stated the family income at the time of questioning, not realising that there was a change in the income during the course of the previous few years.
It was hoped to show the loss of income resulting from the patient's illness and death. Hence the information was sought: Income before and during the illness and the income at present. In almost all cases the income had remained the same or had improved considerably.
The average income is not so important, since it may be increased by a few persons with high incomes. The domiciliary forms gave a much lower average than other sources. This must have been due in no small measure to the fact that 85 patients claimed that they had no family income at all and a further 223 stated that the whole family earned less than 20/- per week.
The really important point is the number of persons who earn less than a living wage.
Insurance. Insurance only applies to occupied persons. Of the
new cases attending the tuberculosis dispensary at Charles Street, 218 were insured, 272 non-insured and 130 " not stated ". Forty-six per cent, of the cases in the domiciliary forms were insured.
Deficit in Income. According to Dillon (personal communication),
the minimum income desirable for the necessities of life is 18/- per adult and 9 / - p e r child.
666
GBAPH III.
Distribution of cases according to Income, T
5 O O
4 O O
3 O O
-1
2 O O
100
-- 5OO
- 4 O O
- 3 O O
- 2 O O
- IOO
2 3 4 5 6 7 8 9 |O
TOTAL FAMILY INCOME(£)
form " cases. 19-6 per cent, of the total had adequate and 80-4 per cent, had inadequate incomes. Table XXV shows the distribution of these cases according to the amounts by which the incomes were deficient.
TABLE XXV Income Deficit in Shillings
Shillings .
Cases
10 216
20 256
30 255
40 228
Income Inadequate bv
50 178
60 140
70 111
80 68
90 48
Adequate Income 342 Cases
100 18
110 19
120 5
130 2
140 1
Duration of Illness. Death Certificates provide space for " duration
667 TABLE XXVI DURAT Years 1 2 3 4 5 ' 6 7 8 9 10 10-20 20-30 over 30
ION OF ILLNES.
Pulmonary 463 203 96 54 30 14 9 7 2 9 12 10 3
3 IN YEARS
Non-Pulmonary 245 14 4 3 5 4 0 1 2 1 2 0 0 TABLE XXVII
DURATION OF ILLNESS IN MONTHS OF CAS Months 1 2 3 4 5 6 7 8 9 10 11
ES DYING WITHIN 1 YEAR
Non- Pulmonary-65 61 61 56 26 83 26 42 22 13 6 Non-Pulmonary 191 21 5 8 1 10 0 2 2 ' 3 2 ,
The non-pulmonary deaths constituted 281 of the 1,191 cases so recorded, 191 of which died within 1 month of onset of disease. These were mostly-cases of tuberculous meningitis.
The Table (XXVI) shows the duration of illness in the pulmonary cases and the other Table (XXVII) shows the duration of illness.of those who died in the first 12 months.
Over 50 per cent, of the patients died within the first year and over 20 per cent, died in the next year, i.e., 70 per cent, died within 2 years.
Place of Death. A dying tuberculous patient needs a good deal of
nursing and is more infectious than at any other stage of the disease. Large quantities of infectious sputum are produced and must be dis-posed of in a safe way.
Such conditions are hardly to be found in the patient's home. Hence it is desirable that patients should be isolated at this and, indeed, at all stages of the disease.
The Registrar-General, in his annual returns, gives the place of death of all persons dying of tuberculosis in each year. The table l>elow is a summary of this information for Dublin City in 1944 :—
668
This table shows that 32-5 per cent, of the Dublin cases die else-where, which .usually means at home. This rate is not as high as that of the whole of Eire.
The rate for mental hospitals is also lower in Dublin than in the rest of Sire, as it is the rate in the " County Homes and Hospitals, Dis-trict Hospitals and County Infirmaries ".
The information" that 53*8 per cent, of the patients die in General and Special Hospitals is interesting, but the questions of greater importance are these. How many died in Special and how many in. General Hospitals! How long had they been in these hospitals before death? This information would tell us how many patients are com-pelled, through absence of bed accommodation in Special Hospitals, to< enter General Hospitals to die. Many of these are deprived of full special treatment and occupy beds which are badly needed for non-tuberculous cases, and are probably a- source of infection to other debilitated patients in the General Hospital.
On the other hand, the fact that the patient died in hospital is no indication that he was under full and expert treatment, he may have been admitted in the last stages of the disease when nothing can bie* done for him.
In. the survey the relatives were asked whether the patient had ever been in a sanatorium or other hospital, and how long he stayed. The results are as follows :—
TABLE XXIX.
Duration of Hospital Treatment.
Duration
Under ] month ... ... . ' ... 2 months
3 4 5 6 12 18 Over 18 „
In Special Hospitals 21
18 10 7 8 12 24 14 .
8
In General Hospitals 16
10 5 1 5 3 5 2 6
Over 32 per cent, of the patients died in hospitals other than those meant for the treatment of tuberculosis.
Over 40 per cent, of the patients who died in Special Hospitals died within 3 months of admission or were in these hospitals for less than that time.
The duration of hospital treatment is usually about 25 to 35 per cent, of the duration of the illness.
Acknowledgments. The collecting of data for this paper took
three-years, during which every assistance was given by • the authorities concerned and by other investigations.
669
Thanks are due to the Irish Red Cross Society for a part-time grant to enable the work to be carried out.
The social survey was carried out by Social Science Students under the direction of Mrs. Maguire, University College, Dublin. Their care and attention to detail, in a work that was often unpleasant, contributed largely to the success of the survey.
Thanks are also due to the Registrar-General for supplying data from death certificates, and to the Dublin Corporation officials for permission to carry out some of the work at Charles Street Tuber-culosis Dispensary. And to the Master of the National Maternity Hospital, Holies Street, for permission to collect and use a control group.
I wish to thank Miss Naomi Rowan for her help in" checking results and, finally, thanks are due to my Secretary, Miss Maureen Mooney, for reading the manuscript and checking and typing the paper, with-out whose, help this work could not have been completed.
Summary. Investigations were made into the circumstances and
other social factors concerning representative groups of tuberculous patients.
The work was confined to the City of Dublin and involved all deaths and as many patients as possible.
Tuberculosis is definitely related to overcrowding, poverty and ignorance. Conclusions were more satisfactory when based on observations of the environment than on information obtained from the relatives.
The importance of age was discussed and death rates examined from several viewpoints.
References.
Annual Report of Registrar-General. Dublin. 1940-1944. CECIL. Textbook of Medicine} 1941.
DTLLON AND COUNIHAN. " Irish Tuberculosis Death Rates.5' Journal Statistical and Social Inq. Soc. of Ireland. 1943.
DILLON. " Tuberculosis : A Social Problem. Studies. Dublin, June,~ 1943. DILLON. "Tuberculosis and th3 Bad Shortage. I.J.M.S. Oct., 1944. DILLON. " The Epidemiology of Tuberculosis. J.M. Ass. of Eire. Nov., 1945. DUFFY. " Some Social Factors in Tuberculosis. Medical Soc., Univ. College, Dublin.
GEARY. " The Mortality from Tuberculosis in Saorstat Eiraann." J. Stat. Soc. Inq. Soc, Ireland. 1930.
GRIFFITH AND MITCHELL. Textbook of Paediatrics. ' PEARL. Medical Biometry and Statistics.
PRICE. " Report of a Tuberculin Survey in Dublin." I.J.M.S., July, 1941. Report of Inquiry into Housing of Working Classes. Dublin, 1943.
Statistical Abstract, 19451! Stationery Office, Dublin. Tuberculosis. Stationery Office, Dublin.
VINES. Greenes Manual of Pathology.
DISCUSSION ON MR. KIDNEY'S PAPER.
'" dirty." Of the single patients 398 out of 1,167 had not a separate bed and 580 out of 861 married had not a separate bed.
-On the basis of a calculation of the minimum necessary to provide a diet capable of maintaining normal health, the income of 4 out of every 5 who died was inadequate. While complete accuracy is not possible in social investigations, the trend here is unmistakable. Obviously a ]arge number of deaths were caused.by infection spread in overcrowded living conditions amongst undernourished people.
The problem of bed accommodation is now being tackled on a sufficient scale. Until the socia] problems involved are dealt with on the same scale, these unnecessary deaths will continue to occur.
Mr. Whitaker.—Whenever experts find something in their own field surprising, the foolish layman is tempted to rush in with an-explanation. Both Dr. Kidney and Dr. Deeny are surprised at the relatively slight-degree of infection of one another by married couples, but,I suggest that the former has already supplied the explanation, namely, that the incidence of tuberculosis varies with age, decreasing after the peak in the 15-25 years group. Married couples come together at an age when the risk of infection is getting less intense. It is also possible that the effective duration of exposure to infection is less with married couples than with the younger children in a family who spend most of their time together.
Dr. Kidney is also surprised at the discrepancy between the average weekly income per person found in the control and survey cases and what he calls " the average of the country." The figures,he quotes for the latter from the Statistical Abstract are, however, the average income per week of male and female workers, which is quite a different thing from income per person. The control and survey findings of average weekly incomes per person of 15-5 shillings and 16-6 shillings do not look so queer when compared with the average weekly income per head of the population in 1939, which was roughly £1.
I inferred that it was mostly the relatives of the better-off patients who refused to co-operate in the survey. This makes the data less rep-resentative and tends to vitiate deductions therefrom as to the connec-tion between tuberculosis and poverty.
On this question generally, it seems to me that in seeking to establish a correlation between tuberculosis and economic and social conditions, it is not enough to show that most of the deaths from tuberculosis occur in families with low incomes or poor housing accommodation. The same may be true of all deaths or of deaths from, say, cancer. No significant deduction as to the connection between tuberculosis and economic, etc. conditions can be made unless comparison of the distribution of deaths from tuberculosis according to income groups with a similar distribution of all deaths shows a disproportionately large number of deaths from tuberculosis in the lower income categories.