http://dx.doi.org/10.4236/jilsa.2014.61002
A Neural Network Approach to Predicting Car Tyre
Micro-Scale and Macro-Scale Behaviour
Xiaoguang Yang, Mohammad Behroozi, Oluremi A. Olatunbosun
School of Mechanical Engineering, University of Birmingham, Birmingham, UK. Email: [email protected]
Received October 2nd, 2013; revised November 2nd, 2013; accepted November 9th, 2013
Copyright © 2014 Xiaoguang Yang etal. This is an open access article distributed under the Creative Commons Attribution License, which permits unrestricted use, distribution, and reproduction in any medium, provided the original work is properly cited. In accor-dance of the Creative Commons Attribution License all Copyrights © 2014 are reserved for SCIRP and the owner of the intellectual property Xiaoguang Yang etal. All Copyright © 2014 are guarded by law and by SCIRP as a guardian.
ABSTRACT
Finite Element (FE) analysis has become the favoured tool in the tyre industry for virtual development of tyres because of the ability to represent the detailed lay-up of the tyre carcass. However, application of FE analysis in tyre design and development is still very time-consuming and expensive. Here, the application of various Artifi-cial Neural Network (ANN) architectures to predicting tyre performance is assessed to select the most effective and efficient architecture, to allow extensive parametric studies to be carried out inexpensively and to optimise tyre design before a much more expensive full FE analysis is used to confirm the predicted performance.
KEYWORDS
Design Parameters; Finite Element Modelling; Neural Network; Tyre Configuration
1. Introduction
The vehicle tyre, in its interaction with the road, gener-ates the forces and moments which control vehicle mo-tion. Of particular importance are the tyre radial force which controls vehicles ride behaviour, longitudinal force which controls acceleration/braking and lateral force which controls cornering and directional stability. These forces are functions of tyre dynamic characteristics and result from deformation of the tyre due to tyre/road interaction. Static stiffness, determined by measuring its elastic de-formation and contact patch inde-formation is one of the important mechanical properties of a tyre [1]. Since this and other performance characteristics are dependent on the detailed design configuration of the tyre, there is in-creasing use of virtual prototyping tools such as finite element (FE) analysis in the design and development of new tyre products to evaluate different tyre design con-figurations.
Kazuyuki Kabe and Masataka Koishi [2] investigated tyre cornering behaviour by both implicit and explicit finite element analysis considering the modelling details of tyre composite structure and nonlinear material prop-erties. The simulation results were verified using a flat-
trac tyre test system. O. A. Olatunbosun and A. M. Burke studied the tyre dynamic behaviour in the time domain by finite element analysis for better understanding of tyre ride response [3]. P. Ghosh etal. carried out a study on the effect of tyre design parameters on tyre performance for optimizing tyre configuration [4]. From the aforemen-tioned studies on finite element tyre modelling, it has been shown that a finite element tyre model can provide data, not only for comparison to measured test data, but also data that are impractical to measure, and are thus an efficient alternative to the conventional design, build and test method of developing tyre prototypes.
dynamic parameters such as tyre contact area, cornering stiffness, and tyre-road friction coefficient for application in vehicle control systems [8]. ANN based methods have also been proposed for estimating tyre/road friction force [9] for predicting tyre handling performance [10], and for modelling tyre failure rate [11].
Olatunbosun etal. [12] investigated the application of a tyre virtual prototyping environment, combining FE ana- lysis and ANN technology, to investigate the effect of tyre belt ply design configuration parameters on tyre sta- tic stiffness and tyre/road contact characteristics. Such an ANN model can be employed in the initial evaluation and rapid optimisation of new tyre designs before more expensive FE analysis is used to confirm the predicted performance.
The current paper gives a detailed exposition of the development of the ANN model, with consideration of four different ANN structures and comparison of their performance in terms of accuracy and cost. The ANN model was trained using test data generated from a vali-dated finite element tyre model developed using the commercial finite element software ABAQUS™. This allowed the tyre belt reinforcement cords to be modelled in detail. Using different tyre belt design configurations, a large number of different tyre designs were created and their performance characteristics obtained by FE simula-tion. The tyre design parameters were the input data and the tyre performance parameters obtained from the vir-tual tests were the output data used to train the ANN tyre model. Once trained, the ANN model would provide a reliable, fast and efficient tool for predicting the per-formance characteristics of new tyre designs with differ-ent belt configurations without having to use FE analysis.
Such an ANN model can be employed in the initial evaluation and rapid optimisation of new tyre designs before more expensive FE analysis is used to confirm the predicted performance.
2. Tyre Material Properties
As a composite structure, tyres have complex character-istics due to their diverse material properties and com-plex structure. Generally, the tyre is constructed using high modulus cord and low modulus rubber. Several lay-ers of cord spaced in the rubber act as the reinforcing frame of the tyre. The reinforcement layers enveloped by
the rubber exhibit highly nonlinear stress-strain behav-iour.
This study is based on a slick radial tyre 175/505 R13 for SAE Formula Student (FS). Currently, over one hun-dred FS racing teams are using different makes of tyre, such as Dunlop, Goodyear, and Hoosier. These tyres usually work under relatively low pressure and load. The growing popularity of FS makes the competition keener and has forced the FS teams to strive for higher per-formance of their cars. As a cornerstone of FS racing car design, the tyres’ characteristics are now being paid more attention and have resulted in taking up to two seconds off the lap time during competition [13].
The tyre consists of different rubber components with embedded reinforcements. The dominant component of the tyre is rubber including tread, under-tread, sidewall, apex, and the inner-liner. The reinforcement of the tyre includes the belt, carcass, bead, cap ply, and bead rein-forcement. The rubber material properties for different components such as tread and sidewall are not identical due to the different mixed proportions of rubber and car-bon black [14]. The function of tread rubber is to keep the balance of tyre performance and durability, while the sidewall rubber is designed mainly for fatigue resistance.
The availability of accurate knowledge of a tyre’s con-stituent material properties is vital for constructing a FE model capable of representing the behaviour of the tyre accurately. However, tyre material properties are usually not available to most researchers due to the proprietary protection from the tyre manufacturers. The material properties for the tyre were determined using techniques developed by Yang etal. [15].
Based on a series of uni-axial tests and evaluations using ABAQUS, the Yeoh hyperelastic model constants for different rubber components were obtained and listed in Table 1.
[image:2.595.58.541.655.735.2]In ABAQUS, the viscoelastic material property should be considered together with the hyperelastic model to define large-deformation, nonlinear, viscoelastic behav-iour. Likewise, the viscoelastic material model must be combined with the isotropic linear elasticity model to define classical, linear, small-strain, viscoelastic behav-iour. The normalised relaxation test data (Table 2) were utilised to evaluate the Prony series parameters in ABAQUS as described in [15].
Table 1. Hyperelastic Material Constants [15].
Rubber Material Yeoh strain energy potentials constants
Component C10 (N/mm2) C20 (N/mm2) C30 (N/mm2)
Tread 0.1714 −4.4041E−02 1.7383E−2
Sidewall 0.2933 −8.6149E−02 3.7144E−02
Apex 1.7245 −2.2922 5.0544
Inner-liner 0.3223 −8.6751E−02 2.4762E−02
Table 2. Viscoelastic material constants [15].
Rubber Material Relaxation Modulus (g) Relaxation Time (τ), sec.
Component g1 g2 τ1 τ2
Tread 0.1433 0.0852 7.6125 235.62
Sidewall 0.1613 0.0773 6.2257 224.29
Inner-liner 0.1017 0.0839 19.6480 363.70
Apex 0.1815 0.1197 3.5618E−02 206.28
Toeguard 0.1171 0.0891 21.2580 350.13
In ABAQUS, the reinforcements are modelled using rebar elements embedded into the rubber matrix. In this way, the reinforcement component and the host compo-nent (rubber) are described in different constitutive mod-els. The material properties can be assigned to their cor-responding component, separately.
Since the deformation of cords/steel wire during tyre inflation and deflection produces significantly smaller strains compared to rubbers, the material properties of cords remain well within their linear elastic limits hence their non-linear material properties are not required. Thus, the Young’s modulus E and the Poisson’s ratio ν were used to define the material property of reinforcement cords.
3. Finite Element Modelling
The pneumatic tyre has a complex structure consisting of reinforcement plies and rubber components. In order to achieve successful prediction of tyre characteristics using FEA, an accurate 3D tyre model is crucial. Apart from the tyre material properties, the fundamental requirement for the tyre modelling process is precise and adequate information about tyre geometry.
Finite element analysis is now widely used as a pow-erful virtual simulation tool for tyre development because of its ability to model the detailed structure of a pneuma- tic tyre. Here, the tyre FE model used in the simulation experiment was developed in the commercial FE package ABAQUS to acquire data for training the ANN model.
Once the tyre cross-section structure details were ob-tained, the finite element model of cord-rubber compos-ite was created in ABAQUS. In this study, the rebar layer function in ABAQUS provides the support for modelling cord as rebar element, which is embedded in rubber solid element.
The rebar layer function in ABAQUS is used to define the cord orientation, spacing, thickness, location, and material properties that are independent of rubber mate-rial properties definition. Matemate-rial properties of different components obtained from tests were then applied to the model. The modelling procedure introduced in [14] was adopted in this study. A 2D axisymmetric tyre model was developed firstly by importing the 2D cross-section pro-file shown in Figure 1 into ABAQUS/CAE. The hybrid
Figure 1. Finite element model of tyre cross-section in ABAQUS.
axisymmetric continuous elements with twist degree of freedom (CGAX4H and CGAX3H) were used to account for the twist feature of the cord along the axisymmetric axis due to anisotropy of fibre reinforcements [2]. Par-ticularly, for the bead region, 2D axisymmetric hybrid element CGAX4H was used with steel property rather than embedding steel wire in rubber, which is effective and efficient. The reinforcement components were rep-resented by the SFMGAX1 elements with 2 nodes, which were embedded in rubber elements in ABAQUS. One layer cap ply with 0 degree orientation (along the circum-ferential direction), two layers breakers including one layer steel belt with 20 degree orientation and one layer nylon belt with −20 degree orientation, and two layers carcass with 90 degree orientation were modelled by rebar layer and embedded in the corresponding host solid elements. The element set and node set were created for different components for convenient operation in ABAQUS, such as assigning material properties and boundary con-ditions, and post-processing.
the 2D axisymmetric elements (CGAX4H and CGAX3H) were transformed into 3D solid elements (C3D8H and C3D6H). The number of circumferential sections can be controlled for different analyses; for example, only the contact patch part of the tyre has refined mesh for steady state tyre rolling analysis. In this case, 50 × 6.0˚ circum-ferential coarse sections and 20 × 3.0˚ refined sections for the contact patch respectively were created.
This non-uniform mesh is appropriate not only to en-sure accurate prediction but also low cost of computa-tional time. The structure details such as the cord-rubber composite are still kept after revolving the 3D model.
4. Virtual Tests on Pneumatic Tyre
A number of virtual tests were carried out on the 3D FE tyre model including static load-deflection tests in the vertical, lateral, and longitudinal directions as well as tyre footprint analysis. These were then validated with tests on the tyre carried out on the University of Bir-mingham tri-axial electro-hydraulic tyre dynamic rig.
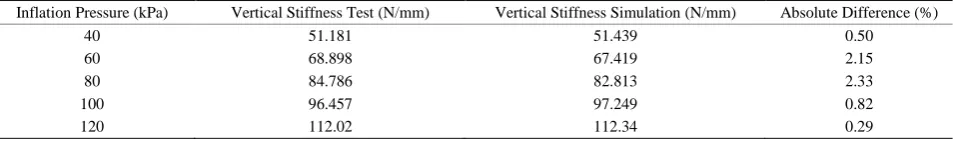
[image:4.595.62.539.665.736.2]Results of the vertical stiffness validation are shown in
Table 3 with tyre vertical stiffness determined at normal inflation pressure 80 kPa as well as at ±25% and ±50% for the tyre in its normal design configuration.
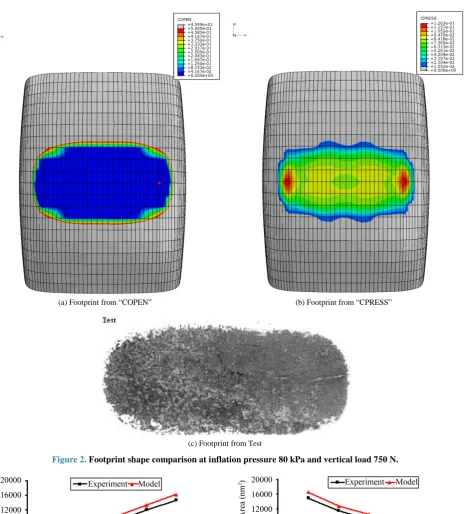
Figure 2 shows footprint shape comparison between experiment and finite element analysis at normal infla-tion pressure 80 kPa and normal vertical load 750 N. The variations of tyre footprint area, due to the variation of inflation pressure and vertical load for both virtual and physical experiments, are shown in Figures 3 and 4.
It is evident that the tyre finite element model is capa-ble of predicting the variations of the footprint area due to the changes of inflation pressure and vertical load. The trend of tyre contact area considering the variation of tyre inflation pressure and vertical load are consistent with the findings in [16] i.e. tyre footprint area increasing with increasing vertical load and decreasing inflation pressure. The validation results for the finite element model show that it is capable of accurately predicting tyre per-formance characteristics. It therefore provides a reliable platform for investigating the tyre stiffness property.
5. Methodology and Implementation
5.1. Artificial Neural Networks (ANN)
A detailed description of artificial neural networks and
the principles of neural modelling is given in [12]. Fur-ther details of the operational principles and the design of artificial neural networks can be found in standard text-books e.g. Samarasinghe [17]. On the other hand, another important property of a neural network is its ability to learn complex nonlinear relationships between the inputs and outputs of the network [12]. This study takes advan-tage of this property of a neural network and its ability to improve its performance through learning, just like the human brain. Here, the application of various ANN ar-chitectures as the approximation tool for predicting tyre performance is assessed, including Multi-Layer Feed- forward Networks or Multi-Layer Perceptron (MLP), Co-Active Neuro-Fuzzy system (CANFIS), Radial-based Function (RBF) neural network, and generalised feed- forward MLP. A brief introduction of each network is presented as follows.
Multi-LayerPerceptron (MLP) NeuralNetwork: In the multilayer networks, there are one or more hidden layers, whose nodes are correspondingly called hidden neurons. The back-propagation learning algorithm network typi-cally trains the network by employing the deviation of outputs from corresponding desired values to correct and update the weights of the previous layer [17].
Co-Active Neuro-Fuzzy Interface system (CANFIS): The CANFIS model combines fuzzy logic input with a modular neural network to estimate complex functions for obtaining higher accuracy along with lower calcula-tion cost due to its reduced structure. In addicalcula-tion, human knowledge is not required since the CANFIS model learns training data set by optimising the fuzzy member-ship function parameters with either error back-propaga- tion or genetic algorithm (GA) [18].
Radial-basis Function (RBF) NeuralNetwork: Radial basis function (RBF) networks are nonlinear structures, similar to MLPs, but constructed of a single hidden layer. Gaussian transfer function is used in RBF networks in-stead of the standard functions employed by MLPs. Since the learning in hidden layer is substituted by unsuper-vised learning, the learning cost and problem size is smaller, and as a result, network training will be faster [19].
Generalisedfeed-forward MLP (GFMLP) Neural Net-work: Generalised feed-forward networks are a generali-sation of the MLP such that connections can jump over one or more layers [20]. The efficiency of this network is
Table 3. Vertical stiffness validation.
Inflation Pressure (kPa) Vertical Stiffness Test (N/mm) Vertical Stiffness Simulation (N/mm) Absolute Difference (%)
40 51.181 51.439 0.50
60 68.898 67.419 2.15
80 84.786 82.813 2.33
100 96.457 97.249 0.82
(a) Footprint from “COPEN” (b) Footprint from “CPRESS”
[image:5.595.72.539.74.589.2](c) Footprint from Test
[image:5.595.308.541.549.652.2]Figure 2. Footprint shape comparison at inflation pressure 80 kPa and vertical load 750 N.
Figure 3. Variation of footprint area with respect to vertical load at 80 kPa inflation pressure.
[image:5.595.58.285.549.665.2]effectively higher than MLP since the network flexibility, adaptability, and nonlinearity is sensibly stronger than in normal MLPs.
Figure 4. Variation of footprint area with respect to infla-tion pressure at 750 N vertical load.
5.2. Data Acquisition
desired outputs from the given inputs. In this case, the inputs are the tyre belt ply design configuration parame-ters namely, cord orientation angle, spacing (cords end density), cross-sectional area, material property (Young’s modulus). In addition, the operational condition, inflation pressure was considered.
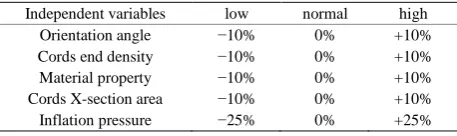
The desired outputs are the tyre static stiffness prop-erty (in the radial, longitudinal and lateral directions), contact patch area, contact pressure and shear stress in the belt plane. To provide the training data, the inde-pendent input parameters were varied as shown in Table 4 to create 243 samples (prototype tyres). ABAQUS in-put decks were generated for each sample. Each inin-put parameter was given a change of ±10% apart from infla-tion pressure which was given a change of ±25% because of the lower sensitivity of output parameters to it.
In the previous study [12], it was established that ANN technology could be applied to tyre design. Here the aim is to explore the efficiency and effectiveness of different ANN architectures in predicting tyre performance. This is achieved by comparing the tyre performance parame-ters predicted by the trained neural networks of different architectures to those predicted by a validated finite ele-ment model.
The chosen outputs are typical tyre performance char-acteristics in terms of both physical and micro-scale be-haviour including vertical stiffness, Lateral stiffness, lon-gitudinal stiffness, contact area, maximum contact pres-sure, maximum shear stress #1 and maximum shear stress #2 (direction #1 refers to the direction of shear stress in lateral direction and direction #2 corresponds with the longitudinal direction. The macro-scale parameters (stiff-nesses) are normally specified design parameters while the micro-scale parameters (maximum contact pressure and shear stresses) must be kept below specified limits to ensure operational safety of the tyre.
5.3. Implementation
[image:6.595.58.287.670.738.2]To facilitate the training of an artificial neural network, the available data is normally split into two sets: one set for training and another for testing. A limited number of training data set were randomly reserved for the purpose of cross validation, so that over fitting can be monitored and avoided. The trained neural networks can then be validated using the data set reserved for cross validation and the robustness of the ANN models assessed.
Table 4. Variation in input parameters of ANNs.
Independent variables low normal high
Orientation angle −10% 0% +10%
Cords end density −10% 0% +10%
Material property −10% 0% +10%
Cords X-section area −10% 0% +10%
Inflation pressure −25% 0% +25%
In this paper, the aforementioned neural networks were developed using the Matlab/NN toolbox in order to learn the same training data set. The network robustness was then examined using the same pre-selected set of test data for each of the networks. Test data were randomly chosen from 1/4 to 1/3 of the main data set. The per-formance and robustness of the different networks were compared so that the best configuration in terms of accu-racy, performance and cost could be selected among available architectures.
The MLP was initially developed with single hidden layer, and the genetic algorithm approach was employed to optimise the number of neurons in the hidden layer in order to avoid manual searching for the optimum number of nodes in terms of accuracy. MLPs with more hidden layers were evaluated using the same training data. The correlation results did not show any improvement in ac-curacy, but the calculation cost increased as more hidden layers were added. The simulation was then extended to train and optimise RBF and Generalised MLP structures.
Genetic algorithm (GA) is an optimisation tool, which has its origin from evolution theory and Genetic science. Input parameters, initial population in GA terminology, are selected based on their calculated fitness index with an evaluation function, and the parent’s pool is formed. Then the parent is mated (Mating, Crossover, and gener-ating offspring) and a number of chromosomes are al-tered within the new generation randomly (Mutation). The new chromosomes make the next generation, which is then evaluated by fitness function again. The above- mentioned steps are iterated until the appropriate fitness is met. The networks of this study were trained by GA where applicable (it was not applicable to CANFIS) and the number of neurons was calculated based on closer correlation of networks’ output with desired values. Hence, the fitness function in GA is typically formulated such that network error would be the minimum at the end of training for test samples.
The back-propagation learning rule with an additional momentum term was selected for training MLPs and the other neural networks owing to its wide usage, low cal-culation cost, and good accuracy. However, a more ac-curate result can be achieved by using methods such as Levenberg-Marquardt learning algorithm [21]. Then the step and momentum size were kept constant in each in-dividual hidden layer. In addition, the Tangent hyper-bolic transfer function was used in hidden and output layers of the MLP architecture where applicable. The usage of transfer functions can be either optional or im-perative according to the network’s imposed architecture.
addition, three membership functions were set per input. The momentum played its role as the learning rule in this configuration as well.
In the developed network, the weights were updated by batch approach where applicable and the mean square error (MSE) method was selected as the performance index and error calculator. The training session for each network is kept running until the MSE error reaches its pre-defined error threshold of 0.01. Then, the training session is labelled as completed. The GA optimisation is also regarded as finished after reaching 100 generations whilst 50 chromosomes are generated and selected in each generation.
6. Results and Discussion
The training sessions for four ANN structures were per-
formed by using three quarters of the sample pool ran-domly selected and the remaining one quarter was used for testing the developed networks. ANN output results have shown very accurate prediction of new samples. The results were compared in terms of their correlation factor, training effort, and network performance when encountering new data. Figures 5(a) and (b) show ex-amples of comparison between results obtained from the trained ANN models using MLP structure and FE model. Each plot is formed of individual output results obtained from different MLP structures against the desired values extracted from FE model. Figure 5(a) illustrates the cor-relation of vertical stiffness while Figure 5(b) illustrates the correlation of contact area.
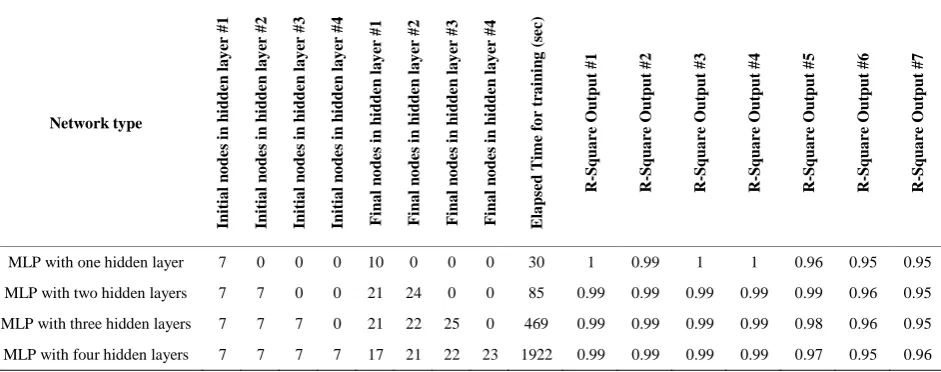
The correlation results for the different MLP structures are reported in Table 5. In these simulations, GA opti-
[image:7.595.64.539.295.493.2]
(a) (b)
Figure 5. (a) A comparison between vertical stiffness of MLP outputs and virtual test results; (b) A comparison between con-tact area of MLP outputs and virtual test results.
Table 5. MLPs’ configuration, training cost, and evaluated correlation factor between results by ANN and FE.
Network type Ini ti a l n o de s i n h idde n l a y er # 1 Ini ti a l n o de s i n h idde n l a y er # 2 In it ia l n o de s i n h idde n l a y er # 3 Ini ti a l n o de s i n h idde n l a y er # 4 F ina l n o de s i n h idde n l a y er # 1 F ina l n o de s i n h idde n l a y er # 2 F ina l n o de s i n h idde n l a y er # 3 F ina l n o de s i n h idde n l a y er # 4 E la p se d T im e f o r t ra in in g ( se c) R -Squa re O ut put # 1 R -Squa re O ut put # 2 R -Sq ua re O ut put # 3 R -Squa re O ut put # 4 R -Squa re O ut put # 5 R -Squa re O ut put # 6 R -Squa re O ut put # 7
MLP with one hidden layer 7 0 0 0 10 0 0 0 30 1 0.99 1 1 0.96 0.95 0.95
MLP with two hidden layers 7 7 0 0 21 24 0 0 85 0.99 0.99 0.99 0.99 0.99 0.96 0.95
MLP with three hidden layers 7 7 7 0 21 22 25 0 469 0.99 0.99 0.99 0.99 0.98 0.96 0.95
[image:7.595.64.535.550.736.2]misation algorithm changed the number of neurons in hidden layer(s) to obtain an optimised structure in terms of accuracy and efficiency. Correlation factors are ex-tremely close to one for macro-scale behaviour (stiff-nesses and foot print area) and very close for micro-scale behaviour. The network efficiency in the training session was also evaluated by the elapsed time for training as shown in Table 5.
However, the ANN structures should also be evaluated for their online usage efficiency. The use of a smaller network structure (in terms of number of layers and nodes) requires a smaller number of main mathematical opera-tions (number of main mathematical operaopera-tions is the ma-jor source of calculation cost of formulas). It will conse-quently lead to faster evaluation of ANN when a network with less complexity and fewer hidden layers is em-ployed.
[image:8.595.312.536.348.466.2] [image:8.595.130.473.494.717.2]The time needed for training session increases expo-nentially as the network complexity is increased by em-ploying more hidden layers and GA implementation on the network will severely influence the processing time for the training session. There is, nevertheless, an excep-tion when the CANFIS is being trained. The elapsed time for training is substantially higher for a two-layer con-figuration because of the high cost of optimising three membership functions morphology to achieve the best fitness.
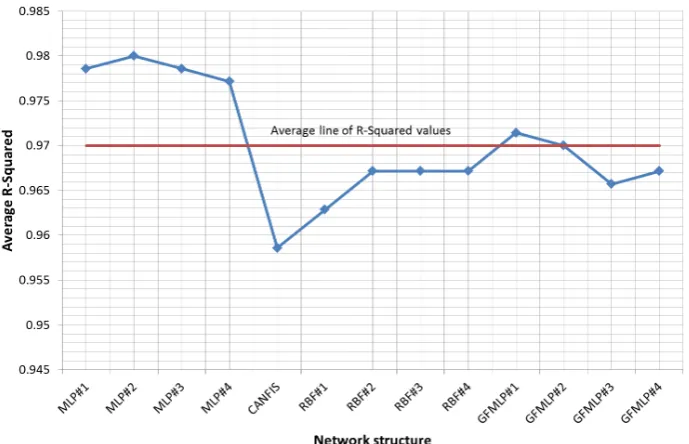
Figure 6 shows a comparison of the training effi-ciency of the different networks. GFMLP showed the lowest elapsed time for training in spite of its more com-plex structure in comparison with MLP while CANFIS achieved the poorest performance in training. The corre-lation factor, R2, achieved by the trained ANN network
configurations in each of the seven desired outputs in comparison with FE simulation results is shown in Fig-ure 7. Figure 8 shows the average correlation factors achieved over the seven desired outputs for the trained ANN network configurations. Most of the ANN con-figurations have shown reliable and acceptable results for the randomly selected test data. MLP outputs have achieved the best correlation with FE results even for the simplest configuration of one hidden layer. The training session cost for GFMLP is the least expensive of all the configu-rations as can be seen from Figure 6. MLPs are also quite efficient, matching GFMLPs in terms of cost of training particularly for the first two configurations (MLP #1-2), but not for higher number of hidden layers.
Hence overall, it has been demonstrated that the MLPs can be deployed with adequate efficiency as well as out-standing accuracy for the set of available data in this re-search. MLP with two hidden layers produced the best combination of accuracy and low cost of training. More-over, MLP is the simplest and most commonly used structure among the proposed network structures.
Figure 6. Efficiency of ANNs in training session.
Figure 8. Comparison of average R2 values of desired outputs between ANN prediction and FE results.
7. Conclusions
In this study, an FE tyre model was developed to simu-late tyre behaviour. Validation of the FE model was per-formed in order to confirm whether simulated results were matched properly to real-world tests. Then, virtual tests were developed to generate tyre behaviour charac-teristics under various tyre designs and loading configu-rations using the validated tyre model. Next, these results, along with the input data, were used in modelling an ANN-based system to predict tyre characteristics. Vari-ous ANN configurations were developed using Mat-lab/NN Toolbox to learn the complex relationships be-tween the geometrical and load parameters as input data and tyre stiffness properties and stresses as outputs. The network efficiency and performance of the different con-figurations were compared by using a randomly selected new dataset. The MLP and GFMLP configurations ex-hibited the best combination of accuracy and training efficiency out of all the configurations for the provided tyre training data set. The MLP with two hidden layers exhibited the best overall performance.
This ANN configuration can predict tyre performance characteristics such as vertical and lateral stiffnesses, con-tact pressure etc. for new tyre designs. The significance of this is that such an ANN can enable extensive para-metric studies to be carried out, inexpensively, to opti-mise a new tyre design to achieve the design targets be-fore a much more expensive full FE analysis is used to confirm the predicted performance. Prototypes can then be built and tested to confirm the predicted performance of the design. This can certainly help tyre designers to achieve an optimised design quickly, efficiently and at reduced cost.
This opens up the possibility of applying ANN to pre-dicting other tyre performance characteristics as well as other automotive systems as an alternative to more ex-pensive analysis methods. Possible areas of application, which will be explored in the future, are computing tyre burst inflation pressure, rolling resistance properties and tyre force and moment generation for simulating vehicle dynamics responses.
REFERENCES
[1] P. Gruber, R. S. Sharp and A. D. Crocombe, “Friction and Camber Influences on the Static Stiffness Properties of a Racing Tyre,” Proceedings of the Institution of Mechani- cal Engineers, Part D: Journal of Automobile Engineer- ing, Vol. 222, No. 11, 2008, pp. 1965-1976.
http://dx.doi.org/10.1243/09544070JAUTO872
[2] K. Kabe and M. Koishi, “Tyre Cornering Simulation Us- ing Finite Element Analysis,” JournalofAppliedPolymer Science, Vol. 78, No. 8, 2000, pp. 1566-1572.
[3] O. A. Olatunbosun and A. M. Burke, “Finite Element Modelling of Rotating Tyres in the Time Domain,” Tire Science and Technology, TSTCA, Vol. 30, No. 1, 2002, pp. 19-33.
[4] P. Ghosh, A. Saha and R. Mukhopadhyay, “Optimization of Tyre Design Parameters through Finite Element Analy- sis and Correlation with Performance,” 2007, SAE Paper No. 2007-26-043.
[5] J. Zhang, “Developing Robust Non-Linear Models through Bootstrap Aggregated Neural Networks,” Neurocomput- ing,Vol. 25, No. 1-3, 1999, pp. 93-113.
http://dx.doi.org/10.1016/S0925-2312(99)00054-5
7-10 August 1995, pp. 419-428.
[7] Y. H. Liu and L. L. Liu, “Sales Forecasting through Fuz- zy Neural Networks,” InternationalConferenceonElec- tronic Computer Technology, Macau, 20-22 Febuary 2009, pp. 511-515.
[8] V. Ivanov, B. Shyrokau, K. Augsburg and V. Algin, “Fuzzy Applications to Tyre Environment,” FISITA, 2008, F2008-12-001.
[9] J. Matusko, I. Petrovic and N. Peric, “Neural Network Based Tyre/Road Friction Force Estimation,” Engineer- ingApplicationsofArtificialIntelligence, Vol. 21, No. 3, 2008, pp. 442-456.
[10] A. J. Barber, T. E. Renner, S. You, G. S. Sandlass and A. Maki, “Predicting Tyre Handling Performance Using Neural Network Models,” 2004, SAE Paper No. 2004-01- 1574.
[11] A. Z. Al-Garn and A. Jamal, “Artificial Neural Network Application of Modelling Failure Rate for Boeing 737 Tyres,” Applied Simulation and Modelling Conference, Corfu, 23-25 June 2008.
[12] O. A. Olatunbosun, X. Yang, M. Behroozi and D. Garcia- Pozuelo, “Development of an AI-Based Model to Deter- mine Vehicle Tire Design Configuration,” FISITAWorld Congress, Budapest, 2010, Paper F2010-C-213.
[13] P. Clarke, “Tyres,” 2006.
http://www.formulastudent.de/academy/pats-corner/advic e-details/article/tyres/
[14] “An Integrated Approach for Transient Rolling of Tyres,” Abaqus Technology Brief, 2007.
[15] X. Yang, O. A. Olatunbosun and E. O. Bolarinwa, “Ma-terials Testing for Finite Element Tyre Model,” SAE In-ternational Journal of Materials and Manufacturing, Vol. 3, No. 1, 2010, pp. 211-220.
[16] E. O. Bolarinwa, “Investigation of the Dynamic Charac-teristics of Radial Tyre Using the Finite Element Method,” Ph.D. Thesis, Mechanical Engineering, University of Birmingham, UK, 2004.
[17] S. Samarasinghe, “Neural Networks for Applied Sciences and Engineering: From Fundamentals to Complex Pattern Recognition,” 1st Edition, Auerbach Publications, 2006. [18] E. Mizutani, “Coactive Neural Fuzzy Modelling,” Pro-
ceedings of IEEE International Conference on Neural Networks, Vol. 2, 1995, pp. 760-765.
http://dx.doi.org/10.1109/ICNN.1995.487513
[19] P. V. Yee and S. Haykin, “Regularized Radial Basis Fun- ction Networks: Theory and Applications,” John Wiley, 2001.
[20] K. Hornik, M. Stinchombe and H. White, “Multilayer Feed-Forward Networks Are Universal Approximators,” NeuralNetworks, Vol. 2, No. 5, 1989, pp. 359-366. http://dx.doi.org/10.1016/0893-6080(89)90020-8
[21] S. Haykin, “Neural Networks: A Comprehensive Founda- tion,” 2nd Edition, Prentice Hall PTR, Upper Saddle River, 1998.
[22] M. Sugeno and G. Kang, “Structure Identification of Fuz- zy Model,” FuzzySetsandSystems, Vol. 28, No. 3, 1986, pp. 329-346.
![Table 1. Hyperelastic Material Constants [15].](https://thumb-us.123doks.com/thumbv2/123dok_us/7993392.760058/2.595.58.541.655.735/table-hyperelastic-material-constants.webp)
![Table 2. Viscoelastic material constants [15].](https://thumb-us.123doks.com/thumbv2/123dok_us/7993392.760058/3.595.301.537.100.415/table-viscoelastic-material-constants.webp)