http://dx.doi.org/10.4236/ojce.2014.41006
In-Plane Shear Performance of
Wood-Framed Drywall Sheathing Wall
Systems under Cyclic Racking Loading
Ali M. Memari
1,2, Ryan L. Solnosky
11Department of Architectural Engineering, The Pennsylvania State University, University Park, USA
2Department of Civil and Environmental Engineering, The Pennsylvania State University, State College, USA
Email: [email protected], [email protected]
Received 5 January 2014; revised 5 February 2014; accepted 12 February 2014
Copyright © 2014 by authors and Scientific Research Publishing Inc.
This work is licensed under the Creative Commons Attribution International License (CC BY).
http://creativecommons.org/licenses/by/4.0/
Abstract
A pilot study was conducted at Penn State University to determine whether the type of drywall joint compound would influence the shear strength of wood-frame stud walls sheathed with Gyp-sum Wall Board (GWB or drywall). In this study, five 2438 mm by 2438 mm specimens were tested under in-plane cyclic racking loading following the CUREE loading protocol for light-frame wall systems. Three specimens were finished using non-cement based joint compound while the other two used cement based joint compound. Based on the experimental testing of the specimens, the results show that the use of cement based joint compound on drywall joints produces higher shear capacity for the wall system as compared to similar specimens finished with conventional non- cement based joint compound. The result of the study is particularly important for high seismic regions where interior stud walls in residential construction effectively take part in seismic resis-tance even though wood shear walls are normally used on exterior walls.
Keywords
Frames; Wood Structures; Studs; Shear Walls; Gypsum; Lateral Loads; Residential
1. Introduction
non-structural building components after an earthquake can be extensive and was estimated that about 50% of the total $18.5 billion in damages to buildings during the Northridge Earthquake (1994) was in this classification [1]. Following the Northridge Earthquake, extensive studies have been undertaken to develop a better understanding of wood-frame construction. Although the contribution of such interior walls is usually not considered in design, nonetheless they do participate in lateral load resistance, as evidenced by damage to interior drywall in past earthquakes [2] [3].
If used as exterior shear walls (to resist wind and seismic loads), they are normally sheathed with plywood or oriented strand board (OSB) on the exterior and drywall on the interior. In either application, drywall joint com- pound is used with joint tape (paper or mesh) to cover the drywall joints. Although partitions and interior light- frame walls without plywood or OSB are not generally considered to be shear walls, the effective in-plane shear capacity of these walls can help the building perform better under wind and earthquake induced lateral loads as they can provide a source of reserve capacity. A detailed literature search has revealed limited studies are avail-able when looking at interior wood shears walls with gypsum wall board (GWB) sheathing and even fewer are available for reinforced joints between sheathing panels. More on drywall sheathing wall systems are discussed in the next sections. Of the research conducted to date, many studies on residential walls have been conducted looking at steel and wood studs, different sheathing (e.g. drywall, OSB, plywood), connection and attachment mechanisms, and testing protocols. These studies provided insight into the benefits of drywall based shear walls used in residential construction. Additionally, through the literature review, prior work has indicated the advan-tages and disadvanadvan-tages of each. One area was deemed worthy for future testing based on their results, joint compounds and joint finishes. More information into the prior is discussed in the next section.
To expand upon existing knowledge, this study looked at ways to reinforce drywall joints to provide addition-al shear strength to the system. In particular, a joint compound with cement in its mix could have a larger con-tribution compared to conventional joint compounds without any cement in their mixes. CTS Cement Manufac-turing Company was interested to test this hypothesis through a pilot study. For this purpose, it was decided to test wood-frame wall specimens to compare the difference in shear capacity of specimens finished with Rapid Set OnePass joint compound (cement based) and those finished with conventional joint compound available in local hardware stores. The research undertaken in this study has addressed only the interior walls, meaning stud walls sheathed with drywall on both sides under cyclic loading.
Presented in this paper, the research results will help better document the in-plane shear performance of wood-stud interior walls with cement based joint compounds. These results may help acknowledge that interior walls can be considered to provide some additional overstrength capacity to the lateral force resisting systems such as shear walls and diaphragms.
2. Literature Background
Many studies have been conducted looking at residential construction related to shear walls either being wood framed or through steel studs. Materials acting as sheathing are equally varied. For wood based sheathing, Ser-rette et al. [4] compared the effect of various sheathing (including OSB and plywood) on wall behavior specifi-cally looking at shear. Chen et al. [5] tested steel stud shear walls sheathed with wood structural panels. Their study looked at effect of screw spacing around the perimeter, type of wood structural sheathing, aspect ratio, and loading protocol type. Karacabeyli and Ceccotti [6] was one of the first to mix OSB and GWB on the same spe-cimen. Uang and Gatto [7] and Hart et al. [8] looked into external wood shear walls with stucco finishes for the sheathing contribution. Uang and Gatto [7] further looked into mixing OSB and stucco and OSB and GWB in combinations. The results from these studies imply that having OSB and adding GWB or stucco on top will in-crease the shear capacity by up to 25%. Hart et al. [9] looked into the performance of wood shear walls with GWB that had openings. Their study also started to look develop parameters to be used in performance-based design applications.
Notable results from these studies include Wolfe’s [10] study where the capacity of wood frame shear walls with structural wood panels on the exterior side and GWB on the interior side was evaluated. One conclusion of the study was that 4 ft × 8 ft sheathing panels oriented horizontally will result in larger lateral load capacity of the wall compared with vertical orientation of the sheathing panels. Another conclusion was that GWB can pro-vide additional lateral load capacity to shear walls. Serrette et al. [4] reported that GWB did not contribute sig-nificantly to the strength of the shear wall when OSB or plywood sheathing is used on the other side. Zacher and Gray [16] concluded that under cyclic loading conditions, GWB has little contribution to energy dissipation be-cause of the crushing of the plaster in the GWB as the connectors press against the holes during racking move-ment. Karacabeyli and Ceccotti [6] concluded that using GWB on one side of shear walls increases the lateral load capacity, but not necessarily the ductility. Skaggs and Rose [11] concluded that GWB enhances the wall stiffness but does not increase lateral load capacity under racking movement. Between these studies and others, their results indicate a better understanding of such GWB based shear walls on the following issues:
• Contribution of GWB to overall shear capacity of the wall;
• Effect of various types of sheathing materials;
• Effect of connector spacing;
• Effect of aspect ratio;
• Effect of hold-down;
• Effect of monotonic loading vs. cyclic loading;
• Modes of failure.
Expanding upon the modes of failure observed in GWB applications, common failures can include: drywall cracking and breakage, drywall screw bending, and drywall screw head pull-out (separation from drywall but still attached to studs). These failure modes will be examined within this study.
Similar testing to wood stud GWB sheathed walls have been conducted with metal studs (steel stud shear walls) with GWB sheathing. Serrette el al. [4], NAHB Research Center [17], SEAOC [18], Bersofsky [19] and Chen et al. [5] have conducted prominent studies. NAHB Research Center [17] conducted tests with long steel stud shear walls with openings with OSB on the exterior side and GWB on the interior side. Observed in these tests where more common screw pull out through the drywall and weak-axis bending of studs. The SEAOC study [18] identified that under a cyclic loading protocol, walls with 2 in. screw spacing around the perimeter gave superior strength and stiffness characteristics compared to 6 in. spacing. In summary, these studies have looked at similar issues and behavior mechanisms as those studied on the wood shear walls previously listed.
In comparing the performances between wood and steel stud, Memari et al. [20] did such a study but also looked at the effect of finishing GWB panel joints (horizontal joints between drywall panels) with tape and joint compound. They concluded that the use of drywall joint compound can enhance the shear strength of light-frame walls. In fact, the finished wood-stud wall strength was 55% higher compared to unfinished surface specimens and the steel-stud specimens showed about a 45% increase in strength over specimens without surface finish. The study presented herein will look to expand the study by Memari et al. [20] by looking more closely at wood shear walls with different joint finishes.
Prior to widespread use of cyclic loading, many wall tests were carried out using static monotonic loading. These monotonic testing procedures have long been standardized as ASTM E72 [21] and ASTM E564 [22]. Both methods of loading have been used to test wood-frame shear walls. One of the basic differences between the two standards is the mechanism of hold-down. ASTM E72 prescribes the use of tie-rods as the hold-down mechanism, while ASTM E564 uses devices or connectors that attach the frame bottom to the supporting base. The rationale for using tie-rods is to eliminate uplift in order to evaluate the shear capacity of the sheathing ma-terial for any given nail or screw spacing. ASTM E72’s usage of tie-rods is clear and unique while ASTM E564 is non-specific may lead to the use of different hold-down devices.
Several methods have common features such as increasing amplitudes of reversed cyclic loading up to a cer-tain maximum load or displacement level, constant amplitude cycles (or stabilization cycles) at cercer-tain ampli-tude levels, and perhaps some ampliampli-tude decay (or degradation cycles). The various protocols differ in several aspects including the number of cycles of increasing amplitudes to reach a certain amplitude for constant tude interval (if any), number of cycles during the constant amplitude interval, number of cycles for the ampli-tude decay interval, target maximum ampliampli-tude, and loading rate. In general, these protocols rely on a target dis-placement, which is defined as the yield displacement. However, wood-frame shear walls do not have a well-defined yield point. Another drawback of some of these protocols has been that the number of cycles sig-nificantly exceeds what is usually experienced in earthquakes. A study by Gatto and Uang [25] compared the different testing procedures with the same specimens, they found that the results indicate that loading sequence has a significant influence on the shear wall with regards to the overall performance and just the shear capacity. Protocols with a large number of cycles (SPD) tended to produce nail fatigue fractures, which were not nearly as prevalent in protocols with lower numbers of cycles (CUREE) yet the initial stiffness of the specimens was rela-tively unaffected by the loading protocol used.
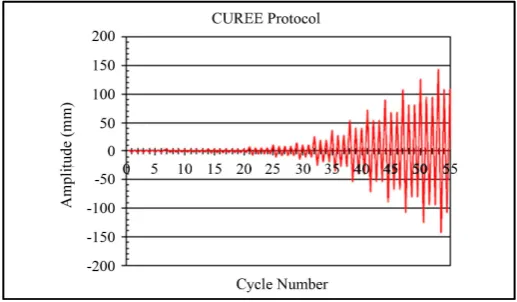
As such, different protocol was developed through the CUREE-Caltech wood-frame project [24]. In the for-mulation of this protocol, the number of cycles are fewer than some other methods and are more consistent with what is expected in real California design earthquakes. Furthermore, the potential for cumulative damage in the wood frame has been considered. This protocol, shown in Figure 1, uses an estimated target displacement ob-tained from a monotonic test to determine the amplitudes of the cyclic loading. From the monotonic loading test, the load at 80% of peak load on the descending curve (degradation) defines a displacement, 60% of which is as-sumed to be the drift that corresponds to the peak load and is the reference displacement for the cyclic loading protocol. This loading protocol has been successfully used by researchers studying light-frame construction such as the work by Bersofsky [19] and McMullin and Merrick [12].
The necessary number of tests will depend on the desirable parameter variation. According to ASTM E 2126, a minimum of two tests are needed for each type of specimen configuration, and a third test will be needed if the first two tests do not agree (e.g., capacity) within 10%. For statistical purposes, it is preferred to have at least three specimens tested. The cyclic loading test protocol will also require a static monotonic loading test carried out before the cyclic loading test in order to determine target load and displacement values to be used in the cyc-lic loading. This would mean that four specimens will be required for testing each type of wall configuration (three cyclic and one monotonic).
3. Experimental Program
[image:4.595.183.442.542.693.2]The experimental testing program of this study constructed and tested five specimens total with and without joint finish to determine the effect of joint compound on the shear strength of the wall panel. Three parts en-compass the testing program, 1) the specimen construction, 2) the testing protocol, and 3) the testing facility and data acquisition system. The following sections describe each in detail.
Figure 1. CUREE loading protocol showing cycle number versus
3.1. Wall Specimen Construction
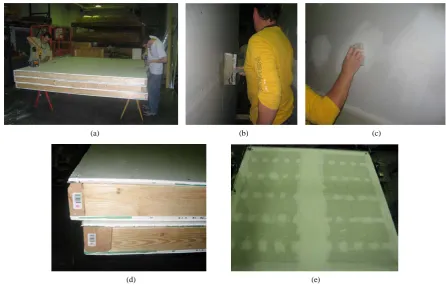
Each specimen had overall dimensions of 2438 mm by 2438 mm (8 ft by 8 ft). The wood stud framing was in-itially constructed on work benches using conventional 51 mm by 102 mm (2 in. × 4 in.) nominal No. 2 spruce- pine-fir studs. Mechanical properties for the fasteners are listed in Table 1 and joint compound properties are listed in Table 2. Each frame consisted of seven studs, one bottom plate, and a double top plate. The two 51 mm by 102 mm (2 in. × 4 in.) double plates (Figure 2(d)) were attached to each other using 10 d common nails at 610 mm (24 in.) on center. The studs were connected to top and bottom plates using two 16 d common nails driven at an angle at each end. The wood-frame was then sheathed with two 13 mm (1 2 in.) thick 1219 mm by 2438 mm (4 ft × 8 ft) drywall sheets on each side oriented horizontally to create a horizontal joint at mid-height of the panels.
The sheathing-to-framing connections for wood stud wall systems were chosen based on International Residential Code [26] specifications in order to build the specimens as close to conventional construction as possible. The drywall was attached to the framing using No. 8, 31.8 mm (1.25 in) coarse-threaded drywall screws at 101 mm (4 in.) o.c. for the perimeter and 203 mm (8 in.) o.c. for interior studs. Figures 2(a)-(c)
show the construction of the specimens and the finishing of the joints. Figure 2(e) shows a finished specimen for testing. The finish material consisted of CTS Cement’s Rapid Set OnePass joint compound and UGL 222 joint compound. The former was applied to the drywall by a CTS representative, while the latter was applied by a professional drywall installer. The applied areas were sanded after the joint compound had sufficiently dried (Figure 2(c)).
The process to construct the specimens followed traditional methods for fabricating wall panels as well as the application of the drywall followed traditional practices. This process is as follows for the wall construction and joint finishing [7] [15]:
1) Top and bottom plates are cut to length and in the case of the top plate; the two boards were nailed togeth-er.
2) Studs are cut to length, spaced per requirements, and then nailed to the top and bottom plates. 3) Drywall is attached to studs by screws on each face of sheathing.
4) The first coat of joint compound consists of a fiberglass reinforcing tape embedded in joint compound and centered over the seam.
5) Once the first coat is dry and lightly sanded, a second coat fills the remainder of the beveled depression between drywall panels.
6) The third coat is applied after the second coat is dry and sanded.
[image:5.595.92.537.498.701.2]7) A final sanding is conducted to smooth any remaining roughness on the surface once thoroughly dried. Overall, five specimens were tested, two with the Rapid Set OnePass and three with the UGL joint compound.
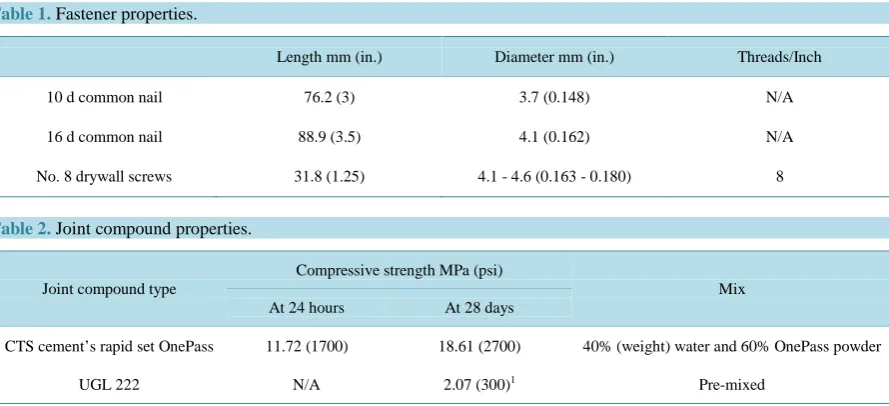
Table 1. Fastener properties.
Length mm (in.) Diameter mm (in.) Threads/Inch
10 d common nail 76.2 (3) 3.7 (0.148) N/A
16 d common nail 88.9 (3.5) 4.1 (0.162) N/A
No. 8 drywall screws 31.8 (1.25) 4.1 - 4.6 (0.163 - 0.180) 8
Table 2. Joint compound properties.
Joint compound type
Compressive strength MPa (psi)
Mix At 24 hours At 28 days
CTS cement’s rapid set OnePass 11.72 (1700) 18.61 (2700) 40% (weight) water and 60% OnePass powder
UGL 222 N/A 2.07 (300)1 Pre-mixed
1
(a) (b) (c)
[image:6.595.88.535.82.367.2]
(d) (e)
Figure 2. Construction and specimen details. (a) Attachment of sheathing; (b) Application of joint compound; (c) Finish-ing of joint compound; (d) Top and bottom plate; (e) Finished specimen.
Because Rapid Set OnePass joint compound is normally applied in one coat, it was of interest to evaluate the performance of a wall specimen with one coat after 24 hours of cure time (RPDST24HR1C) and another speci-men with one coat after seven days of curing (RPDST7D1C). For the UGL compound, although it is normally applied in two coats, for comparison purposes, it was decided to evaluate the performance of three specimens as follows: one specimen finished with one coat and cured for 24 hours (UGL24HR1C), one specimen finished with one coat but cured for seven days (UGL7D1C), and finally one specimen finished with two coats and cured for seven days (UGL7D2C).
3.2. Testing Protocol
The testing protocol for this study followed that suggested in AETM E72, with the exception of the CUREE protocol, a slight variation in the test setup (different from ASTM E 2126). Instead of a Sequential Phased Dis-placement (SPD) Loading Procedure that is recommended in ASTM E 2126, the more recently developed CUREE Caltech Loading Protocol [24] was used as discussed previously. The displacement amplitudes applied (listed in Table 3) for racking tests were obtained from the results of the monotonic test on unfinished wood- frame specimen from the previous study [27]. Additionally, a fewer number of specimens than that recom-mended in E 2126 were used. The displacement-controlled amplitudes of the displacement peaks for each cycle are shown in Figure 1. These points were controlled by the reference displacement Δ, which was estimated from
the monotonic load test [27], where the displacement Δm corresponding to 80% maximum load strength, or
0.8Fu. Then 60% of Δm was used as this reference displacement Δ.
3.3. Testing Facility Description
(a) (b)
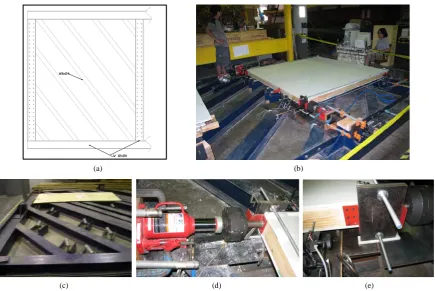
[image:7.595.97.533.81.372.2](c) (d) (e)
Figure 3. Facility layout and details. (a) Testing machine schematic layout; (b) Testing frame with specimen installed; (c) Roller support; (d) Actuator jack with load cell; (e) End condition for tie rods.
framed together using 25.4 mm (1 in) diameter bolts to form a rectangular frame with multiple diagonal mem-bers (Figure 3(a)). The W 12 × 50 beams on the perimeter were laid with their webs parallel to the floor, while the W 8 × 24 diagonal beams were laid with one flange on the floor. The specimen actually slides over rollers (Figure 3(c)). The load was applied to the specimen using a pair of 178-kN capacity bottleneck jacks (ATD- 737120-Ton Air Hydraulic Bottle).
Each loading jack had a stroke capacity of 89 mm (3.5 in) and was equipped with a load cell to measure the applied load to the wall specimen (Figure 3(d)). Tie-rods were used as pairs on either side of the specimen. The bottom of the wall specimen was attached to the support steel plates, which also provided the support for tie- rods (Figure 3(e)).
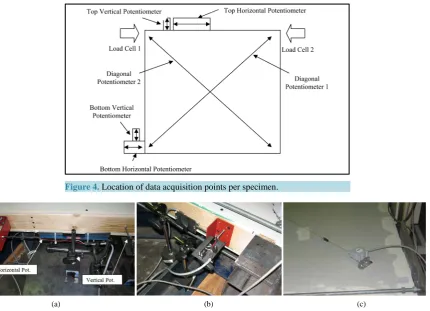
The parameters of interest that were measured during the tests included: the load exerted by the jack and spe-cimen displacements at several points. A total of eight channels of data acquisition were employed. Loads were determined through the attached load cell while horizontal and vertical displacements were measured using a se-ries of potentiometers. The schematic representation of the Data Acquisition Points can be seen in Figure 4. Ho-rizontal displacements (lateral drift) were at the top of the wall, vertical displacement (uplift movement) were at tie-rod locations, slip of the wall was at the base, and wall diagonal length change (shear deformation of the wall panel) was across the specimen (shown in Figures 5(a)-(c)). Potentiometers had a movement range up to 203 mm (8 in).
4. Test Results
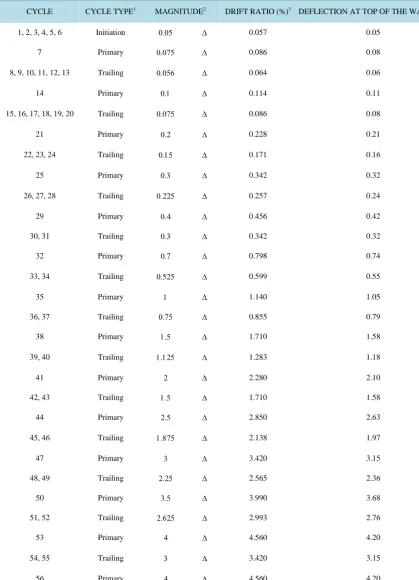
Table 3. Displacement control cyclic loading protocol.
CYCLE CYCLE TYPE1 MAGNITUDE2 DRIFT RATIO (%)3 DEFLECTION AT TOP OF THE WALL (in.)
1, 2, 3, 4, 5, 6 Initiation 0.05 ∆ 0.057 0.05
7 Primary 0.075 ∆ 0.086 0.08
8, 9, 10, 11, 12, 13 Trailing 0.056 ∆ 0.064 0.06
14 Primary 0.1 ∆ 0.114 0.11
15, 16, 17, 18, 19, 20 Trailing 0.075 ∆ 0.086 0.08
21 Primary 0.2 ∆ 0.228 0.21
22, 23, 24 Trailing 0.15 ∆ 0.171 0.16
25 Primary 0.3 ∆ 0.342 0.32
26, 27, 28 Trailing 0.225 ∆ 0.257 0.24
29 Primary 0.4 ∆ 0.456 0.42
30, 31 Trailing 0.3 ∆ 0.342 0.32
32 Primary 0.7 ∆ 0.798 0.74
33, 34 Trailing 0.525 ∆ 0.599 0.55
35 Primary 1 ∆ 1.140 1.05
36, 37 Trailing 0.75 ∆ 0.855 0.79
38 Primary 1.5 ∆ 1.710 1.58
39, 40 Trailing 1.125 ∆ 1.283 1.18
41 Primary 2 ∆ 2.280 2.10
42, 43 Trailing 1.5 ∆ 1.710 1.58
44 Primary 2.5 ∆ 2.850 2.63
45, 46 Trailing 1.875 ∆ 2.138 1.97
47 Primary 3 ∆ 3.420 3.15
48, 49 Trailing 2.25 ∆ 2.565 2.36
50 Primary 3.5 ∆ 3.990 3.68
51, 52 Trailing 2.625 ∆ 2.993 2.76
53 Primary 4 ∆ 4.560 4.20
54, 55 Trailing 3 ∆ 3.420 3.15
56 Primary 4 ∆ 4.560 4.20
1After each primary cycle, there are two trailing cycles with amplitudes 75% of the primary cycle amplitude; 2Δ = 60%Δm, where Δm is the
Figure 4. Location of data acquisition points per specimen.
(a) (b) (c)
Figure 5. Potentiometer details. (a) Top of Specimen; (b) Bottom of specimen; (c) Across diagonal of specimen.
4.1. Results from UGL Specimens
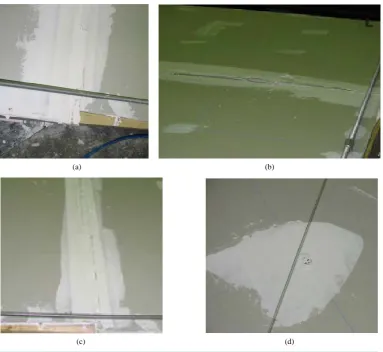
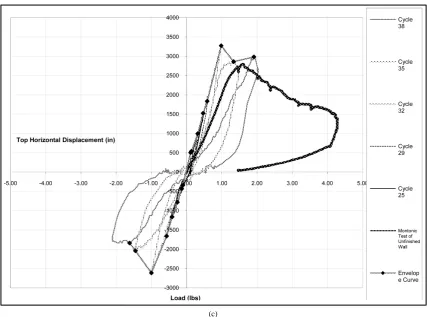
Figures 6(a)-(c)shows a typical UGL specimen after testing with a crack through the entire horizontal drywall joint as well as details of the failure modes. Such modes were similar for all three UGL specimens. As the fig-ures show, the UGL joint compound has cracked at the horizontal joint allowing the two drywall sheets slide pass each other at the joint. The hysteresis plots show the shear in the panel resulted in failure of the drywall joint through cracking of the joint compound and tearing the mesh tape. On the other hand, there was no relative movement of top or bottom plates with respect to the drywall. This means that drywall screws at top and bottom plates and stud screws closer to top and bottom plates did not make enlarged holes in the drywall since the hori-zontal joint compound was weaker in resisting the shear. Figures 7(a)-(c) show the load-displacement hysteresis curves for the three UGL specimens. The monotonic load-displacement curve for an unfinished specimen tested previously [27] is also plotted to show the effect of finishing joint compound.
Observing the failure mechanisms upon closer examination, their characteristics can be compared to previous studies and known behavior. The UGL compound had certain resistance to shear behavior but due to the brittle nature of gypsum (the main component in the compound) it can be expected and was observed that upon reach-ing crackreach-ing load the joint crack and the capacity was immediately lost. The joint movement converted the ac-tion of a joint system into two side by side systems of drywall thus the lack of screw tear out.
(a) (b)
(c) (d)
Figure 6. UGL specimen failure modes. (a) UGL edge tearout; (b) Relative movement of drywall; (c) UGL horizontal joint crack; (d) UGL screw attachment.
Comparison of the average peak value of the three tests, which is 15.12 kN (3400 lb), with the monotonic peak value of the unfinished specimen 12.45 kN (2800 lb) shows a ratio of 1.21, or 21% increase in shear capac-ity due to the finishing of the joint with UGL. Although specimen UGL7D2C showed a smaller shear capaccapac-ity compared to specimen UGL7D1C, nevertheless, it is expected that a thicker coat will result in higher capacity. The peak value of the envelope curve can be considered as the ultimate shear strength for a given specimen. Us-ing a factor of safety of 3.0, which is normally used for light-frame wall systems, an estimate for the allowable shear value can be found. On the basis of the average peak value, the allowable shear value for the UGL speci-mens was approximately 5.03 kN (1130 lb).
4.2. Results from Rapid Set OnePass Specimens
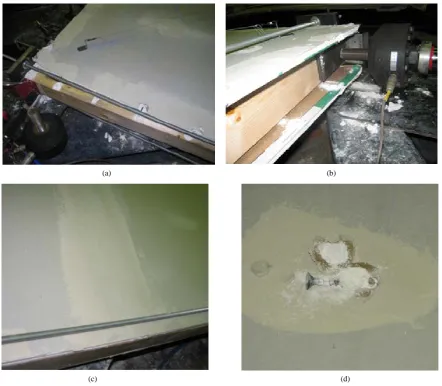
The same type of test results were developed for the two specimens finished using Rapid Set OnePass joint compound. Figures 8(a)-(c) show one of the Rapid Set OnePass specimens upon completion of the test includ-ing several details on the failure mode. The failure modes for all specimens (two) were practically the same. The figure shows that the Rapid Set OnePass joint compound did not crack at the drywall joint and that there was no sliding of the two drywall sheets against one another. Because the joint compound did not crack at the horizontal drywall joint, the screws pushed through the drywall to accommodate the frame deformation. Figure 8 clearly shows that unlike the UGL specimens, there is no relative movement between drywall sheets at the joint when the loading jack in fully extended. Figures 9(a) and (b)show the load-displacement hysteresis curve plots for the two Rapid Set OnePass specimens along with the monotonic curve for the unfinished specimen.
[image:10.595.124.508.81.433.2](a)
(c)
Figure 7. UGL specimens’ load-displacement hysteresis curves. (a) Specimen UGL24HR1C; (b) Specimen UGL7D1C;
(c) Specimen UGL7D2C.
sistance due to the following: the shear behavior of the material is naturally stronger than gypsum, the material has higher adhesive properties for material bonding, and when combined with the fiber tape acts like a fiber reinforced joint similar to concrete repair. As a result of this increase, the bearing around the screws attaching the drywalls exceeded capacity and tore out due to the relative stiffness of the drywall layer to study layer.
The test results show that the envelope peak value for shear strength is approximately 22.24 kN (5000 lb) for both specimens. This shows that for the Rapid Set OnePass joint compound, a longer (more than 24 hours) cure time will not necessarily increase the system capacity. Compared to the monotonic test on unfinished specimen, a peak strength ratio of 1.78 was observed. This meant there was a 78% increase in shear capacity due to finish-ing the joint with Rapid Set OnePass joint compound. The allowable shear value for these specimens was ap-proximately 7.38 kN (1660 lb).
4.3 Discussion and Comparison of UGL and OnePass Joint Compound Test Results
(a) (b)
[image:13.595.93.536.82.468.2]
(c) (d)
Figure 8. Rapid set OnePass specimen failure modes. (a) Rapid set edge tearout; (b) Detachment of drywall at peak load; (c) Rapid set horizontal joint with no crack; (d) Rapid set screw attachment.
(a) (b)
Figure 9. Rapid set OnePass specimens load-displacement hysteresis curves. (a) Specimen RPDST24HR1C; (b) Specimen
[image:13.595.93.536.500.693.2]Based on observations during testing, it is believed that higher shear strength is achieved predominately through the strengthening of the joint between the two drywall sheets. Instead of two sheets moving independently with only friction between them, both joint compounds provide resistance to allow for single panel action. Significant increase between UGL and OnePass can be attributed to their cement based mix and how it interacted with the surface and joint tape.
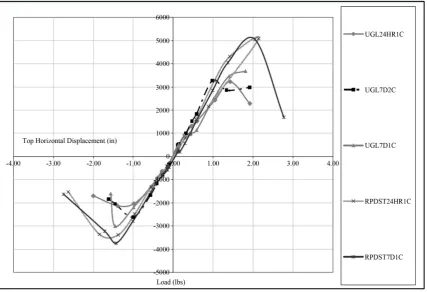
To compare all five specimens, the envelop curves are plotted against one another in Figure 10. The plotted test results clearly show the difference in peak points of shear resistance. Once past the peak point, the capacity drops and that is where the tests were terminated. In comparing the specimens to other tests that have been con-ducted there are similar interesting trends (see Table 4). In relation to Memari et al. [27], the OnePass speci-mens had 88% higher shear capacity as compared to an unfinished joint. Comparing the OnePass specimen to OSB on wood studs [7], the OnePass had 55% of the capacity that OSB had, which is quite specific. The same comparison with the unfinished specimen shows 29% of the OSB sheathed capacity and with the UGL finished specimen shows 40% of the OSB capacity. To compare OnePass wood studs with metal studs [5] [27], it is ob-
Table 4. Capacities of specimens and other configurations.
Stud Type Sheathing Type Joint Type Shear Capacity kN
Wood1 GWB Unfinished 11.79
Wood GWB UGL 15.12
Wood GWB OnePass 22.24
Wood3 OSB N/A 40.10
Steel1 GWB Unfinished 6.23
Steel1 GWB UGL 8.67
Steel2 OSB N/A 17.5
[image:14.595.101.529.416.708.2]1These results are based on the earlier study by Memari et al. [20]; 2Chen et al. [5]; 3Uang and Gatto [7].
served that OnePass has 27% higher capacity than steel studs with OSB and has 253% more capacity than steel studs with unfinished joints. Overall it is clear that wood studs have higher shear resistance with drywall and with finished joints. Also the element of cementitious reinforced joint compound provides an increase in shear capacity to the point where it is becoming comparable to wood studs with OSB.
5. Conclusions and Recommendations
The findings of this study determined whether the type of drywall joint compound would influence the shear strength of wood-frame stud walls sheathed with drywall. In this study, a total of five 2438 mm by 2438 mm (8 ft by 8 ft) specimens were tested under in-plane cyclic racking loading following the CUREE loading protocol for light-frame wall systems. Three specimens were finished using UGL joint compound with different combi-nations on the number of finish coats and curing period. The other two specimens were finished using Rapid Set OnePass joint compound with two different curing periods. The following conclusions are drawn from the re-sults of this study:
• Compared to the monotonic test on the unfinished specimen, there is a 21% increase in shear capacity due to finishing the joint with UGL compound.
• Compared to the monotonic test on the unfinished specimen, there is a 78% increase in shear capacity due to finishing the joint with Rapid Set OnePass joint compound.
• The capacities represented by envelope curves for cyclic tests show that the OnePass specimens had on the average 47% higher shear strengths compared to the UGL specimens.
• OnePass joint compound had bonded to the drywall paper through the mesh joint tape, and that the tape could not be peeled off as compared to the UGL compound that was bonded to mesh joint tape yet the tape could be peeled off, exposing the drywall paper. This indicates a stronger joint with the OnePass.
Based on the limited number of specimens tested, the results show that the use of CTS Cement Rapid Set OnePass joint compound on drywall joints as in the specimens tested will result in significantly higher shear ca-pacity of the wall as compared to similar specimens finished with conventional non-cement based joint com-pound. With the addition of CTS Cement Rapid Set OnePass the walls became much closer to the wood studs sheathed with OSB. This is important in that the partitions could play a larger role in lateral load capabilities in residential houses if cement based compounds are used. The UGL compound applied onto horizontal drywall joints developed a crack over the entire length of the joint due to relative sliding of the two drywall sheets, while the specimens finished with Rapid Set OnePass compound did not develop such cracking. The failure modes for the specimens finished with the two different types of compound were different.
These results are particularly important in areas of high seismic activity where interior stud walls in residen-tial construction effectively take part in seismic resistance even though plywood shear walls are normally used on exterior walls. This study shows that the type of joint compound finish material can make a difference in the level of overstrength and reserve capacity that interior drywalls could provide to the overall lateral force resis-tance. It is recommended that a follow-up comprehensive study be carried out and include the following:
• Evaluate the cyclic racking test performance of 2438 mm by 2438 mm (8 ft by 8 ft) specimens finished using several different cement-based joint compounds and compare to specimens.
• Evaluate the effect of using cement-based joint compound on both wood stud and steel stud specimens.
• Evaluate the performance of finished specimens with openings; it is anticipated that cement-based compound will show better resistance at corner areas where drywall cracks usually start.
• Evaluate the effect of cement-based joint compound on the ductility response.
Acknowledgements
The financial support of the CTS Cement Manufacturing Company for this study is gratefully acknowledged. The contribution of the following individuals as also acknowledged: William Splain, Matt Sambol, Andrew Adams, Thomas Kuczynski, and Joseph Standley. The opinions expressed here are those of the authors only and do not necessarily reflect those of the sponsor.
References
[1] Kircher, C.A. (2003) It Makes Dollars and Sense to Improve Nonstructural System Performance. Proceedings of ATC
port Beach, 109-120.
[2] Earthquake Engineering Research Institute (1990) Loma Prieta Earthquake Reconnaissance Report. Earthquake Spec- tra, 6, 43-48.
[3] Earthquake Engineering Research Institute (1995) Northridge Earthquake Reconnaissance Report. Earthquake Spectra, 2, 1-104.
[4] Serrette, R.L., Encalada, J., JuadinesM. and Nguyen, H. (1997) Static Racking Behavior of Plywood, OSB, Gypsum, and Fiberboard Walls with Metal Framing. Journal of Structural Engineering, 123, 1079-1086.
http://dx.doi.org/10.1061/(ASCE)0733-9445(1997)123:8(1079)
[5] Chen, C.Y., Boudreault, F.A., Branston, A.E. and Rogers, C.A. (2006) Behavior of Light-Gage Steel-Framed Wood Structural Panel Shear Walls. Canadian Journal of Civil Engineering, 33, 573-587. http://dx.doi.org/10.1139/l06-015
[6] Karacabeyli, E. and Ceccotti, A. (1999) Nailed Wood-Frame Shear Walls for Seismic Loads: Test Results and Design Considerations. Proceedings, Structural Engineering World Wide, Paper Reference T207-6, 1-9.
[7] Uang, C. and Gatto, K. (2003) Effects of Finish Materials and Dynamic Loading on the Cyclic Response of Wood- frame Shearwalls. Journal of Structural Engineering, 129, 1394-1402.
http://dx.doi.org/10.1061/(ASCE)0733-9445(2003)129:10(1394)
[8] Hart, G.C., Jain, A., Dumortier, A., Simsir, C. and Barnes, M.S. (2012) Start of Structural Damage in Stucco Walls.
The Structural Design of Tall and Special Buildings, 21, 16-27. http://dx.doi.org/10.1002/tal.595
[9] Hart, G.C., Hortacsu, A., Simsir, C. and Jain, A. (2010) Performance of Drywall Shear Walls: UC Irvine and CSU San Jose Tests. The Structural Design of Tall and Special Buildings, 19, 309-345.
[10] Wolfe, R.W. (1983) Contribution of Gypsum Wallboard to Racking Resistance of Light-Frame Walls. Forest Products Laboratory Research Paper FPL439, US Department of Agriculture, Madison.
[11] Skaggs, T.D. and Rose, J.D. (1998) Cyclic Load Testing of Wood Structural Panel Shear Walls. Proceedings, Struc- tural Engineering World Wide, 1-10.
[12] McMullin, K.M. and Merrick, D. (2002) Seismic Performance of Gypsum Walls: Experimental Test Program, CUREE-Caltech Wood-Frame Project. Consortium of Universities for Research in Earthquake Engineering, Rich- mond.
[13] Arnold, A.E., Uang, C.M. and Filiatrault, A. (2003) Cyclic Behavior and Repair of Stucco and Gypsum Woodframe Walls: Phase I. Consortium of Universities for Research in Earthquake Engineering, Richmond.
[14] Lee, T., Kato, M., Matsumiya, T., Suita, K.N. and Nakashima, M. (2007) Seismic Performance Evaluation of Non- Structural Components: Drywall Partitions. Earthquake Engineering & Structural Dynamics, 36, 367-382.
[15] van de Lindt, J.W. (2008) Experimental Investigation of the Effect of Multiple Earthquakes on Woodframe Structural Integrity. Practice Periodical on Structural Design and Construction, 13, 111-117.
http://dx.doi.org/10.1061/(ASCE)1084-0680(2008)13:3(111)
[16] Zacher, E.G. and Gray, R.G.(1985) Dynamic Tests of Wood Framed Shear Walls. Proceedings of the SEAOC 57th Annual Convention, Structural Engineers Association of California, San Francisco, 41-61.
[17] NAHB (1997) Monotonic Test of Cold-Formed Steel Shear Walls with Openings. NAHB Research Center, Inc., The American Iron and Steel Institute, Washington DC.
[18] SEAOSC (1997) Standard Method of Cyclic Reverse Load Tests for Shear Resistance of Framed Walls for Buildings. Structural Engineers Association of Southern California, Whittier.
[19] Bersofsky, A.M. (2004) A Seismic Performance Evaluation of Gypsum Wallboard Partitions. M.S. Thesis, University of California, San Diego.
[20] Memari, A.M., Kasal, B., Manbeck, H.B. and Adams, A.R. (2009) Lateral Load Resistance Evaluation of Wood- and Steel-Stud Partition Shear Walls. Journal of Architectural Engineering, 15, 122-130.
http://dx.doi.org/10.1061/(ASCE)1076-0431(2009)15:4(122)
[21] ASTM (1998) Standard Test Methods of Conduction Strength Tests of Panels for Building Construction. ASTM E72-98, West Conshohocken.
[22] ASTM (2000) Standard Practice for Static Load Test for Shear Resistance of Framed Walls for Buildings. ASTM E564-00, West Conshohocken.
[23] ASTM (2002) Standard Test Method for Cyclic (Reversed) Load Test for Shear Resistance of Walls for Buildings.
ASTM E 2126-02a, West Conshohocken.
[25] Gatto, K. and Uang, C. (2003) Effects of Loading Protocol on the Cyclic Response of Woodframe Shearwalls. Journal of Structural Engineering, 129, 1384-1393. http://dx.doi.org/10.1061/(ASCE)0733-9445(2003)129:10(1384)
[26] International Code Council (2006) International Residential Code for One- and Two-Family Dwellings. International Code Council, Inc., Falls Church.