Munich Personal RePEc Archive
The U.S. foreclosure crisis: a
two-pronged assault on the U.S. economy
Tatom, John
Networks Financial Institute at Indiana State University
31 July 2008
Online at
https://mpra.ub.uni-muenchen.de/9787/
Working Paper
2008- WP- 10 July 2008
The U.S. Foreclosure Crisis: A Tw o- Pronged Assault on the U.S. Economy
John A. Tatom
Abstract: The U.S. mortgage loan foreclosure crisis has been called “the worst financial crisis
since the great depression.” There are two distinct channels of influence of the subprime problem. The first is the rise in foreclosures that affects homeowners and the real estate industry most directly. The second channel is financial, flowing from the effects on lenders’ financial viability and on financial markets. The timing of developments in these two channels will determine how fast markets work through these problems and restore stability and growth to the nation’s housing and financial markets. The problem is rooted in the housing market, and this market is likely to be very slow to adjust. I t takes time for good mortgages to go bad and to then move through to the end of the foreclosure process. While financial markets work much more quickly, they will be held hostage to the unfolding effects of the foreclosures in the
housing markets and among lenders. Mortgage loan related losses will continue along with foreclosures over the next year or so and these losses will plague firms even if they have already taken adequate write-downs on their asset values. Complicating the picture is the response of the Federal Reserve, which has reacted chaotically by creating new lending
programs that have transformed its credit supply from government securities to private financial institutions, and in the process, violated the first rule of central banking to lend liberally in a liquidity crisis. This failure, compounded by providing a backstop to questionable securities, has slowed market adjustment and risks lengthening and deepening the financial crisis. This paper reviews the emergence of the foreclosure crisis and its real impacts in the economy, the
financial market effects of the surge in mortgage foreclosures, the monetary policy response to the problem, and provides an assessment of the outlook for the crisis.
About the Author: John A. Tatom is the Director of Research at Networks Financial I nstitute
at I ndiana State University and Associate Professor of Finance at I ndiana State University. He has published widely on international and domestic monetary and fiscal policy issues, especially inflation, capital formation, productivity and growth; the macroeconomics of supply, especially oil and energy price shocks; the relationship of exchange rate movements to international competitiveness, capital flows, trade, and international economic policy; and on financial innovations and their effects on monetary policy and the economy, among other areas.
Keyw ords: Mortgage foreclosure, credit crunch, credit channel, subprime lending.
JEL Classification: E44, E 50, G21
The U.S. Foreclosure Crisis: A Tw o- Pronged Assault on the U.S. Economy
John A. Tatom*
The U.S. mortgage loan foreclosure crisis is the biggest problem the U.S. economy has faced since the last recession and indeed it has been called “the worst financial crisis since the great depression.”1 In August 2007, the National Association of Business Economics named the combined effects of subprime debt defaults and excessive personal and corporate debt as the greatest short-term threat to the U.S. economy and this problem has continued to top the list since. There are two distinct channels of influence of the subprime problem that raise concern. The first is the rise in default and foreclosure that affects homeowners, lenders, neighborhoods and the real estate industry most directly. The second channel is financial, flowing from the effects on lenders’ financial viability and on financial markets. The second channel has been more visible and dominant in popular discussions of the issues since early August 2007. These are the direct channels of influence of the crisis. There are ancillary effects on balance sheets and prices that affect economic behavior and thereby influence financial and goods and services markets. These indirect effects are also discussed here, but the focus is on the direct effects.
The timing of developments in these two channels will determine how fast consumers and business work through these problems and restore stability and growth to the nation’s housing and financial markets. The bottom line is that the problem is rooted in housing markets and these markets are likely to be very slow to adjust and to eliminate difficulties. It takes time for good mortgages to go bad and for bad mortgages to move from delinquency in payments to the initiation of the foreclosure process. It also takes time from initiation of the process until the process ends with the sale of a property to a new owner and the distribution of the losses to affected parties. Thus no matter how quickly financial markets adjust, the effects of the
foreclosure problem, even those working though financial markets, will continue to play out for at least another year.
While financial markets work much more quickly, they will be held hostage to the unfolding effects of the foreclosures in the housing markets and among lenders. Asset pricing is forward looking, which means that buyers and sellers of financial instruments base the value of assets on the future cash flows expected from assets and today’s estimates of the risks associated with realizing those expected cash flows. Thus, for example, financial markets process a spike in the default rate on home mortgages into the value of mortgages and related assets very quickly. Firms are failing because of the changes in asset prices or because they are unable to meet the financial demands of their creditors. They will continue to do so as realizations of losses and their location in the global marketplace unfold. Unfortunately these losses will arise in the mortgage loan sector as defaults and foreclosure continue to rise over the next year or so, but also the losses will plague firms that hold these loans or related securities as major assets, even if they have taken write-downs on asset values already or in the next few months.
*The author is grateful to Martha McCormick and Nick Ochieng for their research support and to David Mayes for his comments on an earlier draft of the paper. The usual caveat applies. An earlier version of this paper was prepared for the International Banking, Economics and Finance Association meetings, Honolulu, Hawaii, June 30, 2008.
This paper reviews the emergence of the foreclosure crisis and its real impacts in the economy in Section I. Section II takes up the financial market effects of the surge in mortgage foreclosures, including the loss of capital by financial institutions, potential effects on credit supply and on the economy. In Section III the monetary policy response to the problem is discussed and evaluated. The paper concludes with an assessment of the outlook for the crisis.
I. The foreclosure problem
The national foreclosure problem did not become very visible until late 2006. The foreclosure rate had been fairly steady at about one percent from II/2005 to II/2006, but then it rose slightly to 1.05 percent in III/2006 and to 1.19 percent in IV/2006. By the end of 2007 it had climbed to 2 percent and reached 2.47 percent in the first quarter of 2008 (see chart 1). In this paper, the foreclosure rate is the share of mortgages that are in the foreclosure process (inventory). Some analysts prefer to use the new foreclosure starts rate instead, but it is the total inventory in foreclosure that represents the foreclosure problem, especially with regard to its impact on housing starts and prices of homes. Of course the foreclosure rate as defined here could rise simply by slowing down the process of moving mortgages from filing to settlement, but this process is fairly stable and averages slightly over one year. Thus the foreclosure rate is a multiple of the rate of new foreclosures, which is also shown in the chart.2
Chart 1
The foreclosure problem began in 2006
Foreclosure measures have been rising since 2006
0 2 4 6 8 10 12 199 8:1 199 8:3 199 9:1 199 9:3 200 0:1 200 0:3 200 1:1 200 1:3 200 2:1 200 2:3 200 3:1 200 3:3 200 4:1 200 4:3 200 5:1 200 5:3 200 6:1 200 6:3 200 7:1 200 7:3 200 08: 1 foreclosure inventory rate
rate of new foreclosures started Subprime loan foreclosure inventory rate
Source: Mortgage Bankers Association
Subprime loans, which are loans to borrowers with relatively low credit scores and records of
2
poor credit performance or little credit experience, have become an increasing share of all mortgages in this decade and currently make up about 13 percent of such loans. In 2000 and earlier, subprime loans were negligible. Other higher risk mortgages today include credit extended by the Federal Housing Administration (FHA) and so-called “alt-A” loans, which are loans to borrowers usually with prime credit scores, but who do not provide any documentation (“no-doc”) of income or wealth or ability to service pay the loan, or very little documentation (“low-doc”). They have been reported to constitute over 10 percent of all mortgages. When all three categories are added together, nearly 30 percent of loans outstanding are estimated to be in the high-risk category.
Subprime loans have foreclosure rates that are much higher than that for prime loans (Table 1). Risky loans, without considering alt-A loans, make up about 53 percent of the loans in
foreclosure. At the end of the first quarter of 2008, 10.7 percent of subprime loans were in foreclosure and this rate is expected to rise to 12 percent, about the share already registered in some high-foreclosure Midwestern states. The foreclosure problem would not be so noticeable if the share of such risky loans had not exploded since 2003. At the last peak in foreclosures in 2001, only 2.7 percent of loans were subprime, according to Mortgage Bankers Association data. In early 2008, it was 12.3 percent, down from a peak of 14.0 percent in the second quarter of 2007. The subprime problem is largely an adjustable rate problem. As shorter-term interest rates, to which adjustable rate loans are typically tied, rose in 2004-2006, prime borrowers and even better-advised FHA borrowers shifted to fixed mortgage rate loans. About 80 percent of prime borrowers and about 90 percent of FHA borrowers have fixed rate loans. In contrast, 58 percent of subprime borrowers have adjustable-rate loans. These loans represent the highest foreclosure risk. While it is common to refer to the current foreclosure problem as the “subprime” or “adjustable-rate subprime” crisis, it is important to bear in mind that the
[image:5.612.73.510.469.605.2]foreclosure rate for prime loans, especially alt-A loans, is also rising and represent an important component of the problem.
Table 1
U.S. foreclosures in the first quarter 2008
Foreclosure
rate
Loans serviced
Loans in foreclosure
Percent of loans serviced
Percent of foreclosed
loans
Prime 1.22 35,311,975 430,806 78.1 38.6
Subprime 10.74 5,542,954 595,313 12.3 53.3
FHA 2.4 3,256,579 78,158 7.2 7.0
All loans 2.47 45,224,567 1,117,047 100.0 100.0
Source: Mortgage Bankers Association
The causes of the crisis
of starts seems to be slowing. Some would argue that the slowing in price appreciation was a key cause in the foreclosure crisis as many investors, especially subprime borrowers, had reportedly entered contracts that were only viable if house prices continued their rapid appreciation and borrowers could refinance based on their higher expected equity. Another group, similarly affected, was speculators who bought in order to flip the purchases at higher prices. Once price appreciation became questionable or disappeared, they walked away from their mortgages. A third group were buyers who found that they had negative equity after prices began falling in some markets and who had cheaper rental or purchase housing alternatives elsewhere.
Chart 2
House prices began to slow in fall 2005 and housing starts peaked by January 2006
The decline in the housing market
0 500 1000 1500 2000 2500 J an-92 Ju l-9 2 J an-93 Ju l-9 3 J an-94 Ju l-9 4 J an-95 Ju l-9 5 J an-96 Ju l-9 6 J an-97 Ju l-9 7 J an-98 Ju l-9 8 J an-99 Ju l-9 9 J an-00 Ju l-0 0 J an-01 Ju l-0 1 J an-02 Ju l-0 2 J an-03 Ju l-0 3 J an-04 Ju l-0 4 J an-05 Ju l-0 5 J an-06 Ju l-0 6 J an-07 Ju l-0 7 J an-08 S ta rts (th o u s a n d s ) -6 -4 -2 0 2 4 6 8 10 12 R a te of h ouse p ri ce app reci at io n over past year , per c en t Housing starts
House price increase over past year(OFHEO data)
Sources: OFHEO and U.S. Census Bureau
Another factor that influenced the surge in housing starts and prices in 2004-05, and may have contributed to the subsequent defaults, was the decline in the real interest rate. Some have argued that this was caused by the Federal Reserve’s (Fed) low federal funds rate target of 1 percent from late-June 2003 to late-June 2004. But the housing market and prices actually boomed most in the rest of 2004 and 2005, despite a rising federal funds rate target. By the peak of the
housing market in late 2005 and early 2006, the federal funds target rate was rising from about 4 percent to 4.25 percent and at the end of January 2006 it was set at 4.5 percent. More
importantly, throughout the period of the rising and then constant federal funds rate, from July 2005 to August 2007, there was little change in long-term interest rates or fixed rate mortgage interest rates (Chart 3). Just as a higher federal funds rate did not affect the mortgage rate, neither did the low rates. Indeed the monthly average real long-term 30-year mortgage rate was falling throughout the period so that mortgage rates were higher during the 2004-05 boom and lower subsequently.3 From July 2004 when the federal funds rate began to rise to its peak in July 2007, the real mortgage rate averaged 3.37 percent, a full point below the 4.40 percent average during the previous 37 months of very low federal funds rates from June 2001 to June
4
2004.
Real conventional mortgage rates were not lowered by low federal funds rates Chart 3
The federal funds rate has had little effect on long-term interest rates
0.00 1.00 2.00 3.00 4.00 5.00 6.00 7.00 8.00
real 30-year mortgage rate effective federal funds rate 10-year Treasury yield
J
an- Apr- Ju
l-Oc
t-J
an- Apr- Ju
l-Oc
t-J
an- Apr- Ju
l-Oc
t-J
an- Apr- Ju
l-Oc
t-J
an- Apr- Ju
l-Oc
t-J
an- Apr- Ju
l-Oc
t
00 00 00 00 01 01 01 01 02 02 02 02 03 03 03 03 04 04 40 04 05 05 05 -05
J an-06 Ap r-0 6 Ju l-0 6 Oc t-0 6 J an-07 Ap r-0 7 Ju l-0 7 Oc t-0 7 J an-08 Ap r-0 8
2-year Treasury yield
ource: Federal Reserve Bank of St. Louis and U.S. Bureau of Economic Analysis
S
3
The real mortgage rate is the 30-year conventional rate less the expected inflation, which is proxied by inflation over the past 12 months measured with the chain personal consumption expenditure (PCE) deflator.
4
Of course adjustable rate loans had rates that moved in line with short-term rates such as th year Treasury yield and the federal funds rate. For adjustable rate borrowers who did not correctly assess the prospects of affordability and default when these rates reset, it is likely that the federal funds rate level strengthened demand for housing early on and weakened it later. It is difficult to blame the Fed for the poor financial judgment or ignorance on the part of borrowers and lenders, and it is even more difficult to determine how the Fed could have carried out their
e
two-ccessful stimulus and restraint without such unintended effects on adjustable rate borrowers.
ed e
ted to high risk-high return curities and this demand benefited the riskiest borrowers most.
it
ill y high subprime tes unaffordable, even if short-term interest rates remain the same or fall.5
e
raise
rs ge payments, but not the higher ones, and their nders, to take action to avoid this spike.
e
eral r
su
Another financial factor that contributed to the spike in foreclosures is that many mortgage lenders benefited from the underpricing of mortgage credit by avoiding a large piece of the cost of capital. Large banks created structured finance positions in Structured Investment Vehicles (SIVs) at their holding companies and did not face the capital charges that they would have fac by keeping these positions on their banking books. These SIVs created a market for mortgag backed securities and lowered the interest rates that originators faced in creating new risky mortgages. These structured finance positions were especially attrac
se
It will get worse due to the importance of subprime resets
Regardless of the cause, the origins of the problem date back to 2004-2006 when a large share of new mortgage loans were made to subprime borrowers, borrowers who had relatively low cred scores and could not qualify for conventional mortgage loans at normal market interest rates. Many of these loans began to default much earlier than the normal experience from the past (see Demyanyk and Hemert 2008, for example). In fact, some of them went into default without ever making a payment. As the marginal adjustable-rate loans begin to adjust in coming months and for the next year or so, the foreclosure rate is expected to spike further. Many of these loans w have interest rates that adjust up from low “teaser” rates, making their alread
ra
According to the Financial Times (September 26, 2007), the average adjustable rate mortgag was offered at 7 percent in 2005-06. These loans will reset to 9.45 to 10.85 percent in their initial reset, according to Deutsche Bank and Loan Performance. Such an increase would principal and interest payments from $ 665.30 to $837.21 to $941.06 for each $100,000
borrowed, or 25 to 41 percent. These rates are expected to spike in the 12-18 months beginning in November 2007. This also highlights that the time is short for the portion of these borrowe who currently can afford their current mortga
le
The U.S. Treasury has created the Hope Alliance with major lenders who voluntarily freeze teaser rates for up to five years to lessen the impact of the crisis. But only lenders who ar current on their loan payments and can afford their teaser rates can qualify for help. The Administration also secured legislation in August 2007 to improve the potential for the Fed Housing Administration (FHA) to guarantee refinanced subprime adjustable rate loans fo borrowers who can afford the current fixed mortgage rate. Congress is also working on legislation that will make it easier for homeowners with subprime loans to refinance with fixe
5
rate FHA, if they can qualify. This program is expected to benefit about 200,000 to 300,000 orrowers, but the magnitude of the problem will far exceed this.
r
ise
and Freddie Mac have had no effect on such access, despite that being their incipal mission.
s
e slowing in the pace of decline, there is little evidence that the end f the decline is imminent.
s e because the share of housing expenditures in real GDP is small, currently about 4 percent.
l investment growth has plummeted since 2005, but is a small share of the conomy
b
The Federal Reserve has also issued a request for comments on new proposed regulation that would make it difficult for borrowers and lenders to repeat many of their mistakes from the past. As future comments and actions will show, however, these proposals will make it more costly o impossible for low-income first-time buyers to access credit markets to obtain financing, yet it was these opportunities for unconventional finance that led millions of borrowers, who otherw would not have been able to buy homes, to successfully transition into home ownership. For example, Gerardi, Rosen and Willen (2007) find that borrowers today are more able to access housing based on their long-term expected income than they have been earlier because of new innovations on credit markets. This possibility could be taken away by new rules proposed by the Fed. Interestingly, they also find that the growth of the government sponsored enterprises (GSEs) Fannie Mae
pr
Most estimates of the impact of foreclosure on the housing market show that it has reduced the growth rate of real gross domestic product (GDP) by about one percentage point since spring 2006; with the continuing drops in housing starts, this effect is expected to be no larger than thi through the end of 2008. Housing starts peaked in late 2005 and January 2006, when starts hit 2.3 million per year. Since then, starts have plummeted nearly in half, to about one million since fall 2007. While there is som
o
Chart 4 shows that real residential fixed investment has been declining since early 2006 and the pace of decline has been relatively large. The impact on GDP however has remained small and i likely to be even smaller in the futur
so
Source: Bureau of Economic Analysis
Thus a large rate of decline of real residential investment reduces the overall growth rate by about one percentage point. This is roughly the average effect that has been estimated by the Bureau of Economic Analysis for the nine quarters since the beginning of 2006 (0.91 percent). In the absence of any acceleration in the pace of decline in housing starts, it is unlikely that the direct effect on GDP growth would increase in the future. It is also important to bear in mind that such a direct effect on the growth rate of GDP ignores the ability of the resources that would have generated residential investment to move fairly quickly into other economic activity, for example, commercial construction, so that the direct effect overstates the potential effect on demand for real goods and services and real GDP.
The pace of the house price increase also slowed after 2005. During 2005, house prices rose at a peak 9.5 percent rate faster than consumer prices, using the house price index measured by OFHEO. Since then, the pace of relative price increase has slowed to negative territory. Further slowing cannot be ruled out; it is possible that the relative price will decline and many analysts have suggested that the actual house price index could fall. The Standard & Poors’ Case-Shiller house price index for 20 cities (prone to having the largest cyclical swings in house prices) shows declines since January 2007 that have risen in magnitude to 14.4 percent for the year ending in March 2008, the latest data available, but this is not reflected in the broader national measures. Some of these cities actually had price bubbles in the recent years, though this was not the case on a national basis using the OFHEO or other measures. The key conclusion is that there is no recession that can be expected from the housing sector consequences of the foreclosure problem, though some analysts, based on an expected worsening of the problem or the credit market influences of foreclosures, point to substantial risk of recession.
should it occur, that it will be sufficiently powerful to affect consumer spending appreciably (see Juster, Lupton, Smith and Stafford 2006, for example).
Another indirect effect of the foreclosure crisis, some argue, is the effect that it has had on policy makers’ actions to lower the federal funds rate and thereby lower the value of the dollar and overall demand via this linkage. There is no question that the dollar has been generally falling since the end of 2000, including since the federal funds rate was reduced after August 2007. The correlation for the Fed’s broad trade-weighted exchange rate and the effective federal funds rate for weekly data from the week ending December 27, 2000 through July 2 2008 is -0.40,
reflecting the downward trends in both measures. But the federal funds rate did rise from June 23, 2004 and maintain relatively high levels until August 2007, yet the dollar fell over this period too, though more slowly that it did from the end of 2000 or subsequently. But the dollar actually fell much more slowly in the early period, end2000 to endJune 2004, when it fell at a -1.55 percent annual rate while the federal funds rate was reduced from 6.5 percent to 1 percent, than it did in the more recent period. From the week ending August 8, 2007 through the week ending July 2, 2008, the dollar fell at a 7.55 percent rate, almost seven times as fast, while the federal funds rate only fell about half as much, from 5.25 percent to 2.08 percent . While short term interest rates may have a positive relationship to the dollar, this effect is typically reversed when the interest rate movements are tied to inflationary expectations and there are other more important factors that affect the value of the dollar, such as the outlook for tax rates in the United States and more generally the outlook for the economic growth differential.
II. The financial effects of the foreclosure problem
The other direct effect of the foreclosure problem is financial. Every mortgage that is foreclosed results in someone losing their house and having to bear transitional housing costs and the loss of what is for them sometimes a large amount of equity they had in a house. The greater costs of losing a home through foreclosure are the so-called “psychic costs” in embarrassment, self-confidence and self-esteem for parents and children, as well as the damage of a deflated credit rating on the ability to find work, to secure a new residence, including a rented one, to acquire insurance, to get credit or to secure any good or service that carries future responsibilities for payment. The biggest financial losses, however, usually accrue to the mortgage lenders and those who have financed them.
In early 2007, mortgage lenders, particularly “mono-line” lenders, who only do mortgage
lending, began to fail in large numbers, either because they held relatively large asset positions in subprime loans that were moving into delinquency or losing value because of expectations that they would, or because of the decline in the lending business. Over 70 mortgage companies went into bankruptcy or out of business in the first quarter of 2007. American Century was the first of the major mono-line mortgage lenders to exit the industry. Other large mortgage lenders that have failed or are in bankruptcy include American Home Mortgage and First American
Mortgage. Many large financial providers exited the subprime business, including H&R Block, Nomura Securities, Lehman Brothers and Countrywide Mortgage. The near failure of
Countrywide led to their merger agreement with Bank of America, but it remains to be seen whether this transaction will occur.
because of losses on collateralized debt packages that they held and that were based on payments on subprime loans. Best known are the near half-billion dollar losses at UBS’ hedge fund Dillon Read, due to about $150 million in direct losses and related liquidation costs, and the $2 billion in losses at two Bear Stearns funds that threatened the viability of the firm. Sowood Capital lost $1.5 billion, half its fund, before being sold to Citaldel Investment Group. Major investment banks, including Merrill Lynch, Morgan Stanley, Goldman Sachs, Bear Stearns, Lehman Brothers, Credit Suisse, Deutsche Bank and UBS, lost 15 to 30 percent of their market capitalization in July and August, and much more later. Dozens of hedge funds closed in the same months because of large subprime related losses and a lack of liquidity.
The U.S. subprime crisis spread to other countries. U.K.-based Calibur Capital lost 82 percent of its $900 million hedge fund because of subprime related losses and will be closed. Basis Capital in Australia announced that one of its funds, part of a $1 billion group, could lose half its value, due to subprime and structured credit tied to subprime loans, while others including Absolute Capital in Australia and BNP Paris announced suspensions of redemptions and withdrawals because of subprime losses.
The worst phase of the process, at least from the perspective of financial market losses, came during the week of August 9, 2007 when two state-owned German banks were bailed out. It was these potential failures that led credit markets to seize up and to the massive intervention, over $130 billion, by the European Central Bank. The Federal Reserve responded in kind, though not in scale, by injecting funds into the credit market, lowering the discount rate, and forming a consortium of major banks to borrow at the discount window to show that it is all right to borrow from the Fed to further its attempt to prop up the most hard hit markets for short-term financial and commercial credit. The latter effort was largely unsuccessful and later led to more aggressive steps to introduce new policies that would boost bank borrowing. The loan volume in the asset-backed commercial paper (ABCP) market declined about 6 percent or $90 billion in the week ending August 23, 2007 because this paper was partially backed by an unknown but small proportion of subprime mortgages. Eventually the decline was about $400 billion as ABCP fell from about $1.2 billion to about $800 billion.
The asset-backed commercial paper market shrank in August 2007 because of the realization that most of the pools of assets that backed this commercial paper contained varying shares of
subprime mortgages of varying risk of default and foreclosure. Hedge funds following this model and other firms dependent on the commercial paper market, especially bank holding companies, have reduced the supply of these assets by more than the decline in demand, so that interest rates on these instruments actually fell throughout August and September. The shrinkage in the commercial paper market resulted in other credit products being dumped on markets besides subprime loans. More and more funds are surfacing that have financed long-term and illiquid structured asset holdings with short-term asset-backed commercial paper. Many of these firms have prime brokerage arrangements, which provide servicing of financial transactions, and credit, with major investment banks so that the spillover effects fall on major banks, jeopardizing bank capital. Most analysts expected the subprime problem to be contained among specialized mortgage lenders and hedge funds, and, more importantly, for there to be little effect on banks or other systemic effects on the banking system.
The spread of the subprime loan problem to institutions that had heavy exposure to such loans quickly was augmented by institutions that financed themselves by issuing asset-backed commercial paper. Even if they remained solvent after their losses on the subprime related-assets, their ability to refinance their short-term debt positions became impossible. The only recourse was to obtain alternative financing or begin to liquidate assets whose value had certainly fallen but was unclear and too risky in a cautious market. Not surprisingly, analysts began to talk about credit markets that were seizing up, or even a credit crunch. These
developments mushroomed when it became clear that banks, the one group of institutions that investors thought relatively more immune, began to exhibit similar problems.
In part, the expectation that major financial firms and banks would be insulated from the effects of the foreclosure problem was based on the well-capitalized position of the U.S. banks. Cracks in this story widened following bailouts and the failure of Sachsen LB in Germany. The crisis spread to Northern Rock, the fifth largest mortgage lender in the United Kingdom, which
suffered the first run on a British bank since the Overend, Gurney and Co. run in 1866. Northern Rock had also come to rely on non-deposit commercial paper financing and when that dried up there was a run on the small amount of deposits it had relative to its assets. Eventually the Bank of England bailed out Northern Rock with loans of over $100 billion. The most significant initial failure in the United States was that of NetBank, a $2.5 billion internet bank based in Georgia, that had taken on a portfolio of subprime mortgages and whose lending activity had resulted in losses of $200 million in 2006 alone. NetBank, which failed in late September 2007, was the largest U.S. bank to fail in 2007 and the second of three failures in 2007.
Countrywide, the largest mortgage firm and mainly a prime mortgage lender, was the first to suggest that subprime problems were migrating to prime loans, especially home equity credit lines, when they announced a sharp reduction in second quarter earnings on July 24, 2007. Subsequently speculation over the trouble at Countrywide led to large stock price declines and a liquidity problem that forced them to take up all of an $11 billion credit line and to sell $2 billion in convertible preferred stock to Bank of America. Countrywide announced the elimination of its Full Spectrum subsidiary, its subprime and alt-A lending arm, and its wholesale division, which arranged loans through brokers, on August 20, 2007. It later announced the layoff of about 20 percent of its 60,000 workers. By late September, along with other indicators of a temporary return to normality, Countrywide announced that its deposits had begun to rise in response to its offer of above-market interest rates. By May 2008, there were widespread doubts that their merger would be completed and that the bank would survive.
On the financial market side of the foreclosure crisis, employment fell sharply. In the first seven months of 2007, 39,200 jobs in credit intermediation and related activities, mainly banking, were lost. In the nine months from July 2007 to April 2008, another 81,200 were lost in this sector. In the broader finance and insurance sector, 126,000 jobs have been lost since the end of 2006, 111,000 since July 2007. In just the 10 days from August 13 to August 23, 2007, the Wall Street
Journal found about 12,000 announced job losses at mortgage companies in the subprime and
alt-A loan areas.
eased and primary credit through this facility had declined to an average of $88 million in the week ending September 26, 2007 after peaking at $2.9 billion during the week ending September 12, 2007. Before the credit crisis and bank failures in Europe around August 9, 2007 such credit had been nearly zero. Other signs of easing include the fact that prime 30-year fixed rate
mortgages have had lower interest rates since August 9 and government securities, especially short-term securities, had lower yields following August 9, than they had at the beginning of the crisis. The flight to quality that lowered the three-month Treasury bill rate from 4.77 percent on average for the week ending August 3, 2007 to a low of 3.62 percent two weeks later, rose back to 3.93 the week before the Fed cut its federal funds rate target by 50 basis points to 4.75 percent. Treasury yields with maturities from 2 - 10 years continued to fall until the Fed action and then began to rise, though they remained well below pre-crisis levels. Treasury yields subsequently resumed their decline, falling especially sharply in March 2008 and afterwards.
Credit markets were said to have seized up in three key episodes in August-September 2007, in December 2007-January 2008 and March 2008, with after effects of the latest events continuing into June 2008. The market for subprime mortgages has been largely moribund, as is the market for securitized debt based on asset pools containing them. While asset-backed commercial paper volume outstanding fell nearly 1.2 trillion in early August 2007 to 0.8 trillion from December 2007 to April 2008, and declined further in May, it was replaced by a large increase in the volume of commercial bank and institutional money market lending. To finance the SIVs and other assets that had been financed by asset-backed commercial paper, banks have increased issuance of certificates of deposit, and institutional money funds have expanded, as higher rates than earlier attracted the funds that formerly were invested in asset-backed commercial paper. Jumbo mortgages, those for more than $417,000 that cannot be bought and securitized or held by the government-sponsored credit institutions Fannie Mae or Freddy Mac, faced a more limited private market and their rates have risen to exceed conforming loan rates by a full percentage point or more, making these loans more expensive for borrowers than they were before August 9, 2007. Congress temporarily raised the ceiling on jumbo mortgages to $729,750 in the economic stimulus bill (through the end of 2008), but since taking effect in April, but this increase has not fully relieved the problems in this market, at least initially. The spread between conforming and these non-conforming loans spiked to about a full percentage point, more than twice the previous leak level of about 50 basis points seen in previous periods of stressed credit markets, and this spread has remained the same or higher in April and May, 2008.
soon as it is clear that there are no better opportunities, such as being bailed out or allowed to hold failed assets on your books without taking losses. The Treasury’s early efforts to create a consortium to hold these assets at unchanged or little changed prices failed, so banks are began to take these assets back on their books and financed them internally. Freddie Mac and Fannie Mae, along with banks, launched efforts to avoid taking losses on loan guarantees, the next stage of the crisis, but are not likely to escape realizing losses large losses.
Major international banks continue to register losses. Led by UBS’ $42 billion in write offs, seven large European banks wrote off $108.5 billion from the beginning of 2007 through the first quarter of 2008. Over the same period, the Federal Deposit Insurance Corporation (FDIC)
reports that U.S. insured institutions wrote off $105.6 billion.6 In addition, Fannie Mae and Freddie Mac wrote off $8.9 billion and AIG wrote off $20 billion over the same period. The global financial sector has survived the credit crisis that began on August 9, 2007 quite well despite periodic bouts of illiquidity that have rotated through selected markets. It does appear that the credit markets and banks are much more resilient and stronger than had been believed in mid-August 2007, and can adjust quickly and relatively painlessly to a breakdown in confidence or trust in various credit instruments. The CEOs of many large banks have lost their jobs,
including those of UBS, Citigroup, Morgan Stanley, Merrill Lynch, and Wachovia, and insolvencies and more job losses are expected to continue for some time.
In March 2008, the near failure of Bear Stearns and the launch of several new Fed policies discussed below intensified market concerns over the viability of bond insurers, especially those who had begun to invest in the securities that they insured, were expected to have deteriorating credit rating that would, in turn, threaten their solvency. This had contagion effects to mortgage backed securities and other securities with low credit ratings and significant listed default
insurance securities. Other novel and risky assets also came into question, especially the auction rate security market. Since the latter market was an important source of financing of student loans, and their economic viability had been brought into question by congressional legislation earlier in the year, this market also froze up and few traders could be found for what would normally have been routine auctions. The consequences of these changes has had lasting effects on the extent of emergency borrowing from the Fed, while creating uncertainty on the extent of new safety nets for financial firms, GSEs and any other firms that might be at risk in financial markets. Congressional discussion of extending Fed lending to mortgage borrowers at risk for foreclosure or for student loans quickly surfaced after the Bear Stearns loan and merger arrangements in March 2008 (discussed below). These reactions showed the slippery slope of using central bank powers to pursue public ends for private outcomes that go well beyond the mandate of the Fed. They also reinforced the growing perception of the politicization of the Fed.
The cost of the foreclosure crisis is very large
A four percent foreclosure rate would imply about $400 billion in foreclosed loans. With a loss rate of 50 percent, this would imply overall mortgage loan losses to bank lenders equal to about $200 billion. Of course there is a small fraction of additional loss to the home owners who lose their equity, if any, in the homes. To the extent that high levels of foreclosed property in real estate markets reduce housing prices, the losses to other home owners will also be significant.
The losses to U.S. banks and other depository institutions will absorb about half the mortgage losses because the rest of these mortgages have been securitized and sold off to other investors, including to banks abroad. This means losses to U.S. banks would be about $100 billion. The Organization for Economic Cooperation and Development (OECD 2008) recently estimated much smaller losses to U.S. commercial banks, about $60 billion, but the overall cost of the crisis is estimated to be about $350 to $450 billion. The OECD has pointed out that banks hold about $9 in deposits per dollar of capital so that a $60 billion loss of capital would lead to a decline in bank credit by $548 billion, a decline of about 5.4 percent in total bank assets. Such a shrinkage implies a large decline in bank credit, or the “credit crunch” that is now widely
believed to be in process. The OECD estimates that it could take six months to two years to replace the lost capital out of earnings and that this would imply a completely unacceptable credit crunch and recession that “CANNOT BE ALLOWED TO HAPPEN.” Of course if the loss in bank capital is over twice as large, then so will be the overall decline in credit.
The International Monetary Fund (IMF 2008) produced a much larger estimate of losses. In their view, the total loss due to the foreclosure crisis is likely to be $945 billion. However, this
shocking figure includes much more than the estimates above. It factors in other security losses that are associated with the credit crunch. In particular, it includes a $565 billion loss on
mortgages, still much larger than those above because of its inclusion of price-induced increases in mortgage delinquencies.
Greenlaw, Hatzius, Kashyap and Shin (2008) (GHKS) estimate that the total losses will be $400 billion, with about half being borne by U.S. financial institutions. These are about the same as the estimates here. They take this loss as a basis for further effects on credit supply and GDP arising through a financial accelerator linking bank capital to the supply of non-financial sector credit.7 The $200 billion loss in capital to banks, savings and loans, credit unions, brokers, hedge funds and GSEs is expected to result in a decline in non-financial domestic credit available by about $910 billion reduction in credit available to non-financial firms. They estimate that a 1 percent drop in the supply of nonfinancial debt would lead to a 0.34 percent drop in GDP growth in the short run and a 0.44 percent loss in GDP in the long run. For the $910 billion, or 3
percent, drop in credit available, this yields a 1.3 percent drop in real GDP growth over a year, about $420 billion per year in a $14 trillion economy. They view this effect as additive to any decline coming from that in residential investment and from any wealth effects on consumer spending. The GHKS estimates are much larger than the IMF’s or OECD’s despite the fact that they start with a larger $200 billion loss for financial institutions (the same as the estimate in this paper) compared with the OECD’s $60 billion, but smaller than the IMF’s total loss of about $565 billion, or $282.5 billion for financial institutions on a comparable basis. The reason is that they make some critical assumptions that blow the impacts up by a huge amount.
There are many assumptions, as would be expected, in the GHKS analysis. The most important for the purposes here are that they assume that financial institutions will raise only half as much new equity as they lose from the subprime crisis and, more importantly, that the decline in capital will be multiplied by a nearly unchanged ratio of desired assets to equity of 10, roughly the ratio for banks and for all the financial firms listed above. The OECD and IMF also include a “deleveraging effect” as banks reduce overall credit supplies in line with the reduction in bank
7
capital. The IMF total reduction in bank assets is similar to that in GHKS and much larger than the OECD estimate. Both assume larger deleveraging effects than GHKS, but, as noted earlier, a substantially higher percentage of new capital has been raised to offset provisions of banks due to losses on subprime loans. However, a recent estimate by Sarkozy and Quarles (2008) puts new capital raised already at $330 billion on $350 billion of losses, or about 94 percent replacement. This is not to mention offsets through newly profitable asset allocation changes that are likely to absorb all of the potential reductions in bank loans arising from the financial accelerator.
Finally, the GHKS estimate that GDP is driven by growth in nonfinancial domestic debt is shaky. Evidence that bank credit is constrained by bank capital loss is weak, as is the view that real domestic credit growth determines real GDP. There is growing literature that bank credit affects GDP; see especially Stein (2003) or, for one of the principal sources of evidence on this approach, Kashyap and Stein (1994). But the link between capital losses and bank credit growth is not strong, especially in the recent case where large institutions suffering the greatest losses due to the subprime crisis have raised about as much capital as they lost. In addition, the literature on the credit channel usually stresses the unique role of banks, not nonfinancial domestic debt, and GHKS do not cite any literature that shows a link between bank credit and nonfinancial domestic debt. Nonetheless whether monetary policy slowed GDP, or bank capital losses have caused such a slowing, or both, a slowing in GDP growth began in mid-2006 and has continued into 2008.
Viewed in light of the OECD and IMF estimates, the estimate here of $200 billion (the same as the starting point in GHKS) represents a middle ground. The credit market implications of losses of this size and the timing of those implications may also be much different from the IMF,
OECD or GHKS estimates. In particular, these estimates treat the effects as if they will only occur in the near future, almost seeming to exclude the losses that have already been registered and also excluding consideration of the capital already raised by financial institutions. In fact, substantial losses have already been realized. The FDIC reports that U.S.-insured financial institutions reported asset write-downs of $105.6 billion from the beginning of 2007 through the first quarter of 2008. Recent estimates of the largest asset write-downs since January 2007 total about $190 billion (Lex 2008). In addition, Fannie and Freddie have reported write-downs of $8.9 billion over the same period. These figured are far above the IMF estimate. Moreover, banks have been very aggressive in raising new capital, offsetting the lion’s share of write-downs already. Bank capital overall is relatively high and healthy and expected to stay that way in 2008. Moreover, bank profits are generally sufficient to absorb some capital reduction while offsetting much of the reduction out of other profits within a short period.
asset growth is positively significant (0.80). While the growth rate of bank size is correlated with the starting equity ratio, loan growth, including commercial loan growth is not.8
Increased bank failures are also likely to rise. While there have been few bank failures in the United States in recent years, the incidence is expected to rise. In 2007 there were three bank failures, up from zero in the previous two years. There have been three failures in 2008 by mid-May. The number of problem institutions rose to 72 in 2007, the highest level since 2004, but lower than the numbers from 1990-2004. However, the analysis here does suggest that credit growth is likely to be unimpaired unless the Fed restricts bank asset growth further. The foreclosure problem will continue to worsen over the next 9 months, according to most estimates, as resets of the mortgage rate on adjustable rate loans approaches their peak. The banking system is well along in absorbing the write-downs, but further losses are likely to be written off and more capital will have to be raised. Banks are far ahead of the curve, however, in adjusting to the problem. The recession outlook is worsened and lengthened by foreclosure and credit problems, but those two factors alone do not account for the current dismal outlook
What credit crunch?
The notion of a credit crisis is equally problematical. The simplest evidence of a credit crunch is that the scarcity of credit would drive up the price of credit. But with few exceptions, risk-adjusted interest rates have fallen since early August 2007; moreover they fell before the Fed began to lower the federal funds rate target and they continued to fall, and by more than the Fed cuts, at least until recently, when inflation and policy risk scares began to push rates higher, at least temporarily. Most interest rates are far below levels of early August 2007 (see Chart 3 above, for example). The key instruments that have exhibited higher levels are jumbo mortgage rates, where there has been some uncertainty about their marketability, and bank CD rates where the switch in funding from SIVs through asset-backed commercial paper has switched to bank financing along with funds from institution money market funds. Another market where there is upward pressure is the London interbank offering rate, a rate for loans between banks in London. Due to the discovery of an absence of an efficient and quick resolution method for bank
insolvencies in Britain, interbank loans there have taken on unusual risk. But even dollar-denominated loan rates there are lower than they were in August 2007. Bank lending and money market institutions have expanded much more than the decline in asset-backed commercial paper since early August 2007.
Besides a generally declining cost of credit, it is also the case that bank lending accelerated in the first eight months of the financial crisis, at least according to weekly and monthly seasonally adjusted data from the Federal Reserve Bank of St. Louis (see Chart 5).
Chart 5
Bank credit growth did not slow from August 2007, but has since March 2008
8
Source: Federal Reserve Bank of St. Louis
From the week ending August 1, 2007 just before the crisis became apparent, to December 5, 2007, bank credit at all institutions grew $458.3 billion, or at a 16.9 percent annual rate. This 18-week advance is much faster than the 8.5 percent rate over the previous 36 18-weeks, an increase of $243.2 billion. Over the next 18 weeks to March 19, 2008, bank credit grew at a 14.3 percent rate, still much faster than before the financial crisis. It is the case that bank credit growth declined since mid-March 2008, but this is ironically precisely the date when multiple new Fed programs began to channel more credit to the financial sector (discussed below). Money funds have also grown rapidly, making far more short-term credit available. Institutional money funds surged up $304.5 billion from July to November 2007, a 71.9 percent annual rate, up from a $200 billion rise or 23.5 percent rate in the previous eight months. Since November 2007, the increase continued at a rapid pace, rising $347.5 billion over the five months to April 2008, a 51.4 percent rate. These two major sources of short-term credit have seen explosive growth since the supposed credit crunch began. It is important to bear in mind, however, that while total credit was expanding rapidly, there are areas where borrowers are reluctant or refuse to pay the premiums they would have to pay to continue to secure the short-term credit they had during the summer of 2007. This is especially the case with SIVs and others dependent on asset-backed commercial paper.
Other indicators of rapid credit growth exist for sectors close to more complex credit
instruments. Trainor (2008) reports that the Commercial Finance Association’s quarterly index of asset-based lending grew at a 5.6 percent rate in the first quarter of 2008 and that total
committed credit lines rose 4.4 percent in the fourth quarter of 2007. Three-quarters of reporting lenders indicated rising loan commitments. Exchange-based derivatives trading, specifically futures and options trading, also expanded sharply in 2007. Burkhardt (2008) indicates that over 15 billion contracts on 54 exchanges experienced trading volume growth of 28 percent in 2007, sharply higher than the 19 percent increase in 2006, 12 percent rise in 2005, or 9 percent growth in 2004. U.S. volume on the CME/CBOT kept pace with the world total, rising 27 percent.
Since August 2007, the Board of Governors of the Federal Reserve System has approached near panic in their adoption of multiple and inconsistent traditional policy measures and, since December 2007, they have multiplied these efforts by adopting major new policy tools, some of which may go well beyond their congressional mandate.9 These actions have been motivated, in the first instance by an emerging mortgage foreclosure crisis that began in late 2006 and that the Fed first recognized in May 2007, and in the second instance by a credit crisis that emerged in August 2007 in Europe and quickly moved on shore. This article summarizes and explains the Fed actions since August 2007.10
Normal policy actions
The Fed conducts monetary policy primarily through setting a federal funds rate target and a primary credit rate (formerly called the discount rate). The federal funds rate is the rate at which depository institutions (banks) borrow or lend funds held in their deposit accounts at the Fed. This rate is agreed between borrower and lender institutions on individual loan transactions, generally overnight. The Fed attempts to intervene in Treasury security market through open market operations, which are the purchase or sale of Treasury securities with primary security dealers, in order to change the amount of depository institutions’ deposits at the Fed. The Fed does this in order to influence the federal funds rate and to keep the monthly average of daily average rates at its target rate. The primary credit rate is the rate at which qualifying depository institutions can borrow from the Fed directly, again generally overnight. Borrowing from the Fed is not common or frequent for banks. There have been many serious or even “appalling” errors, in the response of the Fed to the credit market and non-bank problems created by the foreclosure crisis.11 Only a few central ones are examined here, looking at actions distinguished by normal policy actions and new ones.
Before proceeding, however, it is important to note that one of the most important steps taken by the Fed in this century was reversed at the outset. Discount policy had been the subject of a long debate over the history of the Fed on the appropriate use of discount lending as a tool of
monetary policy. Anna Schwartz (1992) recounted many of these issues in her classic work on the discount window, including problems it created for the conduct of monetary policy, the abuses of a “subsidy” discount rate where the rate at which the Fed loaned funds to banks was below the federal funds rate, the fact that the Fed often loaned funds for liquidity purposes to
9
See Chapman (2008) and Reinhart (2008b) for some similar arguments, especially on the expansion of private sector credit exposure arising from the Bear Stearns debacle and merger.
10
The policy switches and indecision exhibited by the Fed could have been influenced by the shortage and mix of governors of the Fed over the period. Due to political differences between the Administration and Congress, there were two vacancies among the seven governors that could not be filled due to Congressional opposition. A third opening became available at the end of January 2008, when one governor’s term expired. He continued to serve pending his confirmation to a new term or the confirmation of his replacement, and a fourth open position becomes available at the end of August. After that, there will be problems insuring the availability of a quorum for the conduct of Board business. During this interval there is a strong case for extraordinary politicization of the Fed by Congressional pressures, but that goes beyond the scope of this paper.
11
insolvent banks and finally the pressures on the Fed to lend to non-banks. She advocated that the Fed abolish the discount window. For most purposes, liquidity can be provided to markets equally well through open market operations, so the discount window is completely unnecessary for the conduct of monetary policy.12 In 2003, the Fed finally addressed many of the problems explained by Schwartz, but with one major exception, they did not abolish the discount window. Instead they created a penalty discount rate with a fixed spread over the federal funds rate for primary lending and an even higher spread for banks that have a low CAMELS rating (4 or 5).13 These steps fixed many of the problems noted by Schwartz and they put the setting of the discount rate, which became the primary credit rate, on autopilot, moving in lock step with the federal funds rate target setting of the Fed. The Fed’s reaction to the foreclosure crisis reduced some of these advantages.
Below changes in the primary credit rate are discussed as “normal” policy actions, but it should be kept in mind that under the 2003 changes in policy they were not completely normal. In particular, the Fed led off its response with a change in the spread between the primary credit rate and the federal funds rate and spreads were allowed to change subsequently, restoring the notion that the discount rate setting was an independent component of policy along with the setting of the federal funds target. This added complexity in the conduct of monetary policy and the necessity for market analysts and participants to anticipate not only federal funds rate target changes, but also changes in the primary discount rate, threw out one of the major advances in policy. Also by focusing more on targeted lending to illiquid banks, the Fed recreated the potential for lending to failing banks and for pressures on itself to lend to non-banks. Only now, much of that lending was via other new lending routes. Nonetheless, the changes in the primary credit rate are referred to as “normal” policy below.
Table 2 shows the multiple, frequent and sometimes large changes in the federal funds target rate and discount rate since August 2007. There are two large changes in the federal funds rate that equaled 75 basis points, one in January 2008 at an unscheduled meeting, followed up eight days later with another 50 basis point cut. Either the situation was deteriorating faster than at any time in history, or the changes reflected some degree of hesitancy or indecision on the part of the Fed. Note that the lead-off action was a cut in the discount rate in August 2007. This reflects the character of the problem. Apparently, the Fed’s primary concern was to direct credit to financial institutions most in need of liquidity assistance instead of sending a generalized signal of easier credit as indicated by a federal funds rate cut. The narrowing of the spread between the federal funds rate and primary credit rate also reflects a decision to make credit easier for borrowing banks since the spread had been fixed by policy since 2003.
Table 2
“Normal” Policy Actions since January 2007
Federal funds
Change (basis
Primary credit
Change (basis
Effective date
Spread (primary
Scheduled meeting
12
Schwartz (1992) cites Kaufman (1991) as support for this view of the lack of a proper role for the discount window and discount lending, but there are many others who have made this argument, including some cited by Kaufman. This is a central proposition of central banking that has been stood on its head by the recent conduct of monetary policy, which has resurrected the notion that lending directly to illiquid, now insolvent, institutions works more quickly and with greater precision than open market operations.
Source: Federal Reserve Bank of St. Louis (FRED)
rate (%) points) rate (%) points) credit – fed funds)
5.25% 25 6.25 25 6/29/06 100 Yes
NA NA 5.75 -50 8/17/07 50 No
4.75 -50 5.25 -50 9/8/07 50 Yes
4.50 -25 5.00 -25 10/31/07 50 Yes
4.25 -25 4.75 -25 12/11/07 50 Yes
3.50 -75 4.00 -75 1/22/08 50 No
3.00 -50 3.50 -50 1/30/08 50 Yes
2.25 -75 2.50 -100 3/18/08 25 Yes
2.00 -25 2.25 -25 4/30/08 25 Yes
Another set of actions that constitute normal policy responses to international financial market disruptions are swaps loans of U.S. dollars for foreign currencies. Pressures in credit markets abroad led the Fed, the European Central Bank and the Swiss National Bank to agree to bilateral swap arrangements of $20 billion and $4 billion, respectively, on December 7, 2007, and to extend and increase them to $30 billion and $6 billion on March 11, 2008. These actions were generally perceived to have reduced the liquidity shortfall of dollars in Europe and London and to bring down the London Interbank Borrowing Rate (LIBOR), which had spiked up relative to the federal funds rate.
New policy actions
Throughout the credit crunch, the Fed has exhibited a profound concern for directing credit to the financial sector where the evidence of the credit crunch was believed to be greatest. This
approach stands in marked contrast to the traditional approach of supplying liquidity in a liquidity crisis and letting the market place direct credit to firms that truly face a liquidity crisis, instead of a solvency problem. It also reverses the repair of the Fed’s lender-of-last resort function in 2003, which finally put this function on autopilot at a fixed penalty rate with a higher penalty for less credit worthy banks. In August and September 2007 and again in December 2007, there were large surges in borrowing from the Fed through discount lending to banks. Financial market conditions apparently deteriorated again in March 2008. As a result, the Fed created a credit program in December 2007 and took several new steps in March 2008. Chart 6 shows the unusual surges in borrowing. After March 12, 2008, the data explode and remain quite high subsequently, despite the multiple new programs aimed at providing liquidity to banks and primary dealers.
Chart 6
Source: Federal Reserve Bank of St. Louis, U.S. Financial Data, May 23, 2008.
Aglietta and Scialom (2008) describe all of the Fed’s new actions as an illustration of the
“permanence” of the central bank’s lender-of-last-resort function in the United States Euro-area, and the United Kingdom, in sharp contrast to the analysis of the historical role of that function detailed above, its complication of Fed policy making, its inefficient transfers of taxpayer funds to banks and its essential dispensability in the face of simpler, quicker, less bank-dependent open market operations. They also ignore the significant revisions in the Fed’s discount policy adopted in 2003. In Aglietta and Scialom’s view, the financial world has changed since the LTCM hedge fund crisis of 1998 so that the potential for hedge fund or other risky financial institutions to create financial market instability requires that the central banks take on supervisory oversight over these firms and put them under the umbrella of the lender-of-last-resort function.
Their analysis is premised upon the assumption that financial stability has always been a central bank objective and that the objective has evolved over time. The emphasis on control of hedge funds derives from the notion that Bear Stearns failure was due to the failure of two of their hedge funds earlier. This is ironic because more than 70 hedge funds failed in the United States in the first half of 2007, and Amaranth failed in September 2007, all without systemic effects on other financial institutions. The Amaranth loss of 6.5 billion was nearly twice the size of the recapitalizations for LTCM or Bear Stearns hedge funds. Moreover, they ignore the failure of Enron in 2001, one of the largest derivative traders in the world at their peak, which did not cause a ripple in financial markets as underlying asset values in the energy sector and related financial derivatives collapsed. Bear Stearns failure was more similar to the failure of Drexel Burnham Lambert in 1990, which also had little or no systemic effects on other financial institutions.
reluctant to take losses, and gain liquidity by using the assets as collateral for government security borrowings from the Fed. This scheme allows financial institutions to forego necessary price adjustments on assets, extending the financial crisis and making it likely to be worse than it would have been without this assistance.
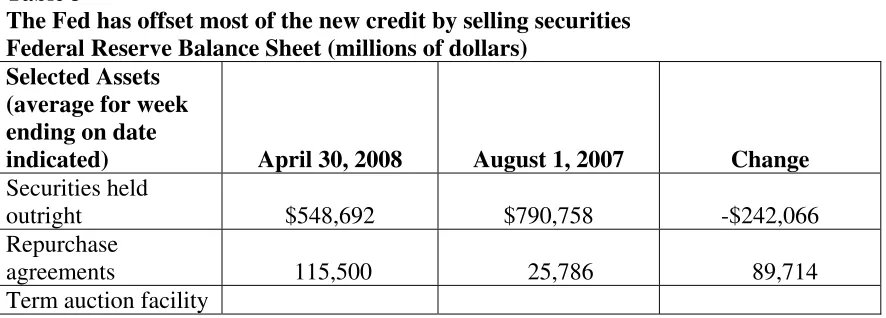
The first new credit facility implemented by the Fed is the Term Auction Facility (TAF), announced on December 12, 2007. This facility allows banks to acquire funds in regular
auctions for 28 days with the same collateral as would be required for borrowing at the discount window. The amount of funds auctioned is announced ahead of time and the market determines the auction rate at which transactions occur. Initially auction amounts were $20 billion but have been raised to $50 billion. The purpose of the TAF is to overcome the aversion of banks to borrow from the Fed through the discount window. The rates at which banks have borrowed are near the target federal funds rate, allowing for expectations of declines over the next 28 days, an alternative borrowing rate for banks borrowing from another bank.
The second new facility, announced on March 7 and expanded on March 11, 2008, is the Term Security Lending Facility (TSLF), which began on March 27, 2008. This program arose in light of the liquidity and solvency problems at Bear Stearns, which teetered on insolvency on Friday, March 14, 2008, and the potential for contagion or illiquidity at other investment banks. Most large investment banks are also authorized as primary security dealers by the Federal Reserve Bank of New York and are authorized to buy and sell U.S. securities with the Fed. At the outset of the financial crisis there were 20 primary dealers, but Bear disappeared on May 29, 2008 and Countrywide Securities will disappear soon due to its merger with Bank of America. Bear Stearns agreed to merge with JPMorgan Chase, subject to their board’s approval, on March 16, 2008, with the Fed’s approval.
The TSLF will provide up to $200 billion in U.S. Treasury securities through a weekly auction of Treasury securities loans to primary dealers for a term of 28 days. The collateral asset is
essentially a sort of swap, though not technically called one, with the Fed. It can include
government agency debt, including residential mortgage-backed securities (MBS), or AAA/Aaa private label MBS (which some have referred to as the toxic waste of the financial system because they are relatively illiquid due to uncertainties of what each security contains), and commercial MBS. The increased availability of Treasury securities at financial institutions is expected to improve liquidity in the repo market in particular, and to enhance liquidity at financial institutions. There is already an overnight security lending facility (since December 2006), but this new facility adds more certainty to availability of the securities and terms.
A third program that grew out of the sale of Bear Stearns is the extension of credit to cover the potential loss on the least liquid and highest loss potential securities on the books of Bear Stearns. Initially these loans were to Bear Stearns and averaged about $5.5 billion for the week ending March 19, 2008 or $7.74 billion for the five days from March 14 through March 18, 2008. By March 19, 2008 these loans had been repaid.
market that had financed bank SIVs in August, 2007. See Williams (2008) for more details. Under the Fed’s new SIV, the Fed loaned $29 billion and JPMorgan Chase lent $1 billion, with the SIV using the proceeds to acquire $30 billion of the most illiquid and dubious securities from Bear Stearns portfolio. These securities were valued on a “mark-to-market” basis as of March 14, 2008. The SIV is managed by Black Rock Financial Management, Inc. The interest rate on the Fed’s loan will be the primary credit rate and the interest rate on JPMorgan Chase’s loan will be the primary credit rate plus 475 basis points. Repayment is to begin no later than the second anniversary date of the loan. The Fed is the effective owner of the SIV because any profit or loss will accrue to the Fed after the first $1 billion loss, which will accrue to JPMorgan Chase. The term of the loans is 10 years, but this term is renewable at the discretion of the Fed. The SIV first appeared on the Fed’s balance sheet on June 26 in data for the week ending July 2, 2008 under the prophetic name Maiden Lane LLC.
Some analysts refer to this arrangement as a “bailout” of Bear Stearns. This is a strange notion since Bear Stearns will cease to exist and the biggest losers will be the owners of Bear Stearns, 30 percent of whom are employees. It is understandable, however because of the lack of information on the structure of the loans and closure of Bear Stearns and also because at the outset, the Fed loaned funds to Bear Stearns for a few days. The initial loan from March 14, 2008 was quickly repaid and the existing commitment is to create a Fed-owned SIV which will hold assets that have a mark-to-market value in excess of the Fed loan. Bear Stearns ceased to exist on May 30, 2008 under the arrangement, taken over by JPMorgan Chase at a fire sale price of $10 per share. This means that the owners of Bear Stearns (again, 30 percent of whom were
employees) lost nearly all of their equity in the firm, and many employees lost their jobs in the transition of ownership to JPMorgan Chase. If there was a bailout, it was for JPMorgan Chase and they are likely to have profited handsomely on the transaction. The biggest losers are the owners of Bear Stearns. One implication of the Fed loan, however, is that it creates the expectation that investment banks can be “too big to fail,” at least for the four that were larger than Bear Stearns. Another is that the willingness to lend to investment banks now has created questions in political and other circles as to whether investment banks should also be regulated by the Fed. Of course the logic here is tortured because Bear Stearns will go out of business as a condition of the loan, and regulating them would not have protected them from failing.
Moreover, the arrangement with JPMorgan Chase is more like a forced merger such as can occur when a bank fails; that is more similar to the bank insurer’s function than the Fed’s concern.
The fourth new facility created by the Fed is the Primary Dealer Credit Facility (PDCF),
announced on March 16 with initial transactions on March 17, 2008. This facility allows for Fed lending to primary dealers for up to 6 months at the primary credit rate with the normal collateral required for discount lending to banks. The creation of the new facilities PDCF and the TSLF were reportedly based on the Bear Stearns experience and the Fed’s inability to lend to
investment banks. Most large investment banks are primary dealers to whom the Fed can lend through repurchase arrangements (RPs), including term RPs, and also most have bank charters that allow them to borrow as banks at the discount window and through the TAF program.14
14