Munich Personal RePEc Archive
Human Development of Peoples
Ortega, Daniel E.
Andean Development Corporation (CAF), Instituto de Estudios
Superiores de Administracion (IESA)
1 October 2009
Online at
https://mpra.ub.uni-muenchen.de/19232/
Human Development
Research Paper
2009/49
Human Development
of Peoples
United Nations Development Programme
Human Development Reports
Research Paper
October 2009
Human Development
Research Paper
2009/49
Human Development
of Peoples
U
nited Nations Development Programme
Human Development Reports
Research Paper 2009/49
October 2009
Human Development of Peoples
Daniel E. Ortega
Abstract
This paper provides a framework and estimates of Enrollment Rates per natural and combines them with previous Income and Child Mortality per natural estimates by Clemens and Pritchett (2008) to produce a Human Development Index Per Natural. The methodology is applied for 1990 and 2000 to provide estimates of growth rates of this measure over the period. The paper also develops and illustrates a framework for estimating an education place premium, and discusses how it is related to per natural measures. The peoples of the least developed countries stand to gain the most from international migration, but there are potentially significant gains to migration between developing countries as well.
Keywords: Migration, Human Development, Education
JEL Classification: F22, O15, O24
I. Introduction
Conventional measures of human welfare are defined over a given geographical space. Most
avenues for social and economic progress involve decisions households and governments make
within a given territory, so this approach generally does not impose an ad hoc restriction on the
kinds of decisions that are encompassed by such measures. Households may decide to spend
more or less resources on education or health, or to participate in the labor market or not, and for
the most part, these decisions are made (and modeled) within a particular country or territory;
similarly, government policy (taxes, infrastructure investment or monetary policy) is
circumscribed to the area within certain administrative borders.
One significant decision individuals and households often make is to change their place of
residence in search for better labor market opportunities, access to basic services, infrastructure,
or better living conditions more generally. Standard measures of welfare that are circumscribed
to a particular territory by definition exclude individuals who choose to relocate. Clemens and
Pritchett (2008) propose a useful approach to measurement of per capita income across
countries: estimate the average per capita income of foreign-born individuals in every OECD
country by country of birth and average that with per capita income at home and get a “per
natural” measure of income, where not only people residing in the home country are counted, but
also the incomes of those who migrated at some point in their life and now enjoy a (generally
higher) living standard than they did at home. Clemens and Pritchet (2008) show that for many
countries the difference between GDP per capita and income per natural can be very large, which
suggests that a measure that takes in to consideration a family's decision to move internationally
can be very informative about the importance of migration as a welfare improving decision for
the household.
This paper takes this research one step further and does two things: first, it provides estimates of
an educational outcome “per natural” which combined with the Clemens and Pritchett (2008)
income and child mortality per natural estimates, results in a Human Development Index (HDI)
per natural as well. Second, it implements analogous calculations for 1990, and thus obtains
estimates of growth rates in per natural measures as compared to the standard national indicators.
dimension, and will allow a better understanding of the changing role (at least over the period
between 1990 and 2000) that migration has had in improving the living standards of people all
over the world.
For closer comparability with the HDI, the educational outcome that we focus on is total gross
school enrollment rates, and since migration is most likely to have an effect on the schooling
outcomes of the children of migrants and not on adult migrants themselves, the proposed
approach is to measure the enrollment rate of the children of migrants. It is shown that simple
adjustments can be made to the estimated rates to make them comparable to the officially
published rates for the entire population in each country of study.
This paper shows that the differences in wellbeing between people born in the same country but
residing in different places in the world, can be astonishing. Part of those differences are very
likely due to the fact that the people who migrate, for one reason or another, are different from
those who don't, and these differences may explain both the migration decision and the welfare
difference, however, in many cases the differences are so large that it is difficult to imagine that
the place where they've chosen to live doesn't also play a significant role in the observed
outcomes through better labor market opportunities, access to services, infrastructure, etc.
The first section of the paper lays out the details of the estimation of the enrollment rates per
natural and shows the estimates for each country in the sample for the year 2000. The next
section uses those estimates and the data from Clemens and Pritchett (2008) to show the
estimated differences in income, education and health between people residing in their country of
birth and those abroad, and combines the three per natural measures to produce the HDI per
natural for the year 2000, along with a discussion of the issue of the gains to migration and the
place premium. The following section shows results from applying the methodology for 1990
and a comparison of the growth rate of national and per natural human development,
II. Estimating Enrollment Rates Per Natural
Building on the methodology proposed by Clemens and Pritchett (2008) for estimating income
according to people’s country of birth instead of country of residence, this section proposes a
way to measure another key human development outcome using people are the central unit of
analysis instead of particular territories: school enrollments. The goal is to obtain estimates of
enrollment rates of peoples across the world regardless of the country they reside at the time they
are calculated. In theory, one should obtain the total number of individuals of school-going age
all over the world, organized by country of birth of their parents, and then ask what fraction of
them are in fact attending school. This number gives an alternative view of this dimension of
human well being, it gives enrollment rates for people of each country in the world (in fact, their
children's) regardless of where they reside, highlighting the fact that the outcomes we observe of
these peoples are the result of many circumstances and decisions, one of which is movement
across international borders.
Regrettably, these rates cannot be exactly calculated for each country of origin and each country
of destination in the world because the data required to do it is not available, however, it is
possible to estimate what these enrollment rates are, by linking up different sources of
information and making some simplifying assumptions. In any effort of this sort, is it best to be
conservative about assumptions that are made along the way, and we show below that for various
reasons, the figures estimated here, represent conservative estimates of the differences between
enrollment rates of the children of naturals of a given country, and the corresponding rates at
home.
This section describes the steps taken to arrive at “per natural” enrollment rates, and shows the
estimated rates and their difference with the officially published rates used for the calculation of
the Human Development Index for the year 2000. The analysis of these results in conjunction
with previous findings by Clemens and Pritchett (2008) may lead to interesting insights about the
way different human development outcomes are related to international migration, and about the
relative weight that individuals may place on different aspects on their welfare when deciding to
II.1. Methodology
The United States Census of 2000 contains information on each respondent's country of birth,
schooling attendance and attainment, age, income, and many other individual and family
characteristics. I estimate school enrollment rates of individuals of school going age according to
the country of birth of their mother, which provides the baseline description of how the children
of migrants fare in terms of school enrollment when they are away from home. We wish to
estimate this same vector for every other country for which it is possible, and to do this, we
construct a simple model that relates these calculated enrollment rates for each country of birth
in the US to a series of variables that are available for other countries in the world and which we
can use to infer enrollments of immigrants' children outside the United States.
Also from the US Census, we estimate children's enrollment rates by the mother's level of
educational attainment: primary, secondary and tertiary education, separately. From Docquier
and Marfouk (2005) we have information on the fraction of migrants to each country in the
OECD that has attained primary, secondary and tertiary education. We then multiply these
variables by the enrollment rate of children of mothers with the corresponding level of education
in the US and obtain three new variables which form the core of our prediction for other
countries. Table 1 shows the results of regressing enrollments by mother's country of birth in the
US on these three variables and on regional dummies as well as other characteristics such as the
distance to the country of origin, the fraction of the diaspora residing in the OECD that resides in
the US, the land area of the country of origin of the mother, and the size of the diaspora in the
US. It is clear from the table that the bulk of the explanatory power of the model comes from the
fraction of immigrants from each country of origin that are primary, secondary and tertiary
educated: once the regional dummies are introduced (regression 2), 82% of the variation in
enrollment rates is explained; the additional variables increase the model's explanatory power to
Table 1. Correlates of School Enrollments of children of foreign born mothers in the US
1 2 3
Contribution to enrollments from primary educated migrants 0.576
(11.63)
0.502
(10.75)
0.499
(11.15)
Contribution to enrollments from secondary educated
migrants
0.699
(9.05)
0.633
(9.19)
0.665
(9.35)
Contribution to enrollments from tertiary educated migrants 0.671
(16.26)
0.622
(15.91)
0.627
(16.44)
Ln of distance to country of birth -0.015
(-1.94)
Ln of fraction of OECD resident diaspora in the US -0.013
(-3.00)
Ln of land area of country of birth 0.001
(0.84)
Ln of size of diaspora in the US 0.004
(1.56)
Region dummies No Yes Yes
Constant 0.353
(6.97)
0.404
(8.56)
0.530
(6.99)
R-squared 0.75 0.82 0.85
Obs 118 118 117
With this model in hand, it is straightforward to predict school enrollment rates of children of
foreign-born mothers in every country for which we there is data on educational attainment of
migrants, which in this case is only OECD countries. These are, therefore, our estimates of
the OECD. The estimated average enrollment for each country of birth of the mother is the
following:
i ij ij i i
i A fmig a PENROLL fmig ENROLLHDI
ENROLL (1 ) (1)
Where PENROLLij is the predicted enrollment of the children of mothers born in country i,
residing in country j and aij is country i's diaspora residing in country j as a fraction of that
country's diaspora in the OECD. ENROLLHDIi is the published gross enrollment rate for 2000 in
the HDR for country i, fmig is the fraction of country i's naturals that reside outside their country
of birth. Constant A is an adjustment factor explained below.
There are two key differences in the standard Gross Enrollment calculation reported in the HDR
and the ones obtained here, which make it necessary to adjust estimated enrollment rates so they
are comparable to official rates:
1) Enrollment rates reported in the HDR come from administrative data on the number of
individuals enrolled in each particular grade level, and census estimates of the school-age
population for each level, while the estimates presented here are all based on self reported
school attendance by age group from the US 2000 Census and then extrapolated to the
rest of the world.
2) Official enrollment rates include the entire population: they include every person enrolled
(numerator) and every person of school age (denominator). The figures presented here are
estimates of enrollment rates of individuals who still live with their mothers, so
individuals who move away from home to college are not counted.
It is necessary to understand the magnitude of these differences in order to make the appropriate
adjustment to estimated enrollment rates (adjustment factor A in equation 1). We can use the US
Census and official HDI enrollment rates for the US to measure how important these two effects
are. For instance, estimating total gross enrollment rates from the US Census for the year 2000
gives a value of 0.998, while the official figure for that year is 0.917 a gap arising from
differences in the administrative records and self-reporting on school attendance. This implies
overestimate the official figure by 8.85%. We can also use the US Census to estimate enrollment
rates of individuals who still live with their mother, which is 1.039, 4.14% higher than the 0.998
referred to before. These numbers suggest that the enrollment figures used here for the US
overestimate the official rate by 13.32%. Analogous calculations using the 2001 Census data for
Spain, gives an overestimate of 17.1%. We adjust the estimated enrollment rates of immigrants
around the world for every country of birth by scaling them down by the US factor of 0.882
(ENROLL_1 in table 2) and the Spanish factor of 0.854 (ENROLL_2 in table 2), and thus obtain
estimates that are comparable to those published officially.
II.2. Estimates of Enrollment Rates Per Natural
Table 2 presents the estimated enrollment rates of children of foreign born mothers using both
adjustment factors derived from the US and the Spanish Censuses, the officially published gross
enrollment rate for each country from the HDR, and the difference between ENROLL_1 and
ENROLL_HDI. The last column of the table also shows the enrollment rate of naturals of each
country that live outside their country of birth (Using the US adjustment factor) in any of the
OECD countries. The per natural measure is essentially a weighted average of this number and
[image:12.612.121.522.545.703.2]the officially published rates.
Table 2. Estimated Enrollments of children by mother's country of origin using US (1) and
SPAIN (2) adjustment factors
Mother's country of birth ENROLL ENROLL ENROLL_ Differenc ABROAD
ERITREA 42.14 41.64 32.55 27.93% 83.68
GRENADA 85.00 83.05 72.98 13.80% 90.70
GUYANA 85.07 83.42 75.57 10.39% 92.40
DOMINICA 83.96 82.18 74.84 9.81% 89.32
TRINIDAD AND TOBAGO 74.22 73.43 67.70 8.46% 91.56
JAMAICA 81.71 80.57 74.34 8.38% 93.40
SAMOA (WESTERN) 78.61 77.13 71.58 7.76% 84.37
AFGHANISTAN 48.79 48.56 45.34 7.11% 87.89
MOROCCO 54.26 53.99 50.51 6.89% 92.51
ALBANIA 72.89 72.15 68.16 5.86% 85.50
EL SALVADOR 67.82 67.35 63.65 5.82% 88.31
BAHAMAS 69.74 69.37 65.92 5.23% 97.82
BELIZE 75.01 74.39 70.73 5.18% 90.69
CAPE VERDE 75.96 75.00 71.37 5.08% 84.20
GHANA 48.51 48.38 46.44 4.19% 97.96
ARMENIA 75.20 74.48 71.72 3.84% 84.62
FIJI 76.33 75.81 73.07 3.74% 91.22
AZERBAIJAN 69.22 68.79 66.39 3.62% 83.71
CROATIA 72.75 72.30 70.01 3.28% 87.17
LEBANON 81.43 80.95 78.41 3.24% 97.90
NICARAGUA 72.01 71.66 69.51 3.09% 89.49
PAKISTAN 37.72 37.65 36.55 3.01% 90.47
CYPRUS 75.84 75.31 73.27 2.78% 86.61
MOLDOVA, REP. OF 73.63 73.14 71.24 2.66% 84.37
IRAQ 54.17 54.06 52.71 2.56% 92.59
GUATEMALA 60.07 59.91 58.44 2.51% 88.50
HONDURAS 63.59 63.42 61.94 2.40% 89.13
GEORGIA 76.80 76.19 74.41 2.39% 84.86
DOMINICAN REPUBLIC 73.26 72.94 71.24 2.39% 89.10
SRI LANKA 64.40 64.25 62.75 2.39% 96.40
JORDAN 78.35 78.00 76.20 2.37% 94.81
YEMEN 51.66 51.57 50.40 2.32% 95.12
MEXICO 72.97 72.66 71.07 2.24% 88.25
MALAYSIA 71.78 71.60 70.04 2.22% 100.57
HONG KONG, CHINA (SAR) 78.37 78.07 76.37 2.22% 96.15
SLOVAKIA 74.32 74.03 72.43 2.21% 91.96
PARAGUAY 72.18 71.97 70.42 2.20% 95.10
CUBA 76.90 76.56 75.00 2.09% 91.56
ALGERIA 69.68 69.52 68.11 2.07% 97.05
LITHUANIA 90.00 89.68 87.96 1.96% 109.82
NEPAL 57.06 56.98 55.95 1.84% 95.86
KUWAIT 79.57 79.35 78.00 1.73% 100.82
CAMBODIA 51.57 51.50 50.64 1.70% 87.76
ROMANIA 69.60 69.43 68.28 1.68% 91.13
SYRIAN ARAB REPUBLIC 57.54 57.47 56.55 1.62% 95.39
BANGLADESH 59.26 59.17 58.23 1.61% 90.62
ETHIOPIA 27.57 27.55 27.13 1.55% 104.90
COLOMBIA 71.58 71.45 70.52 1.32% 94.70
VIET NAM 64.43 64.35 63.59 1.20% 95.68
PANAMA 77.50 77.30 76.39 1.19% 92.96
KENYA 53.69 53.66 53.13 0.99% 99.75
SWITZERLAND 85.30 85.09 84.26 0.98% 100.19
COSTA RICA 66.83 66.74 66.11 0.95% 90.43
TANZANIA, U. REP. OF 32.54 32.52 32.22 0.94% 96.95
MYANMAR 47.41 47.38 47.00 0.81% 93.32
BULGARIA 79.75 79.41 78.80 0.77% 86.61
HUNGARY 81.08 80.94 80.33 0.76% 96.43
VENEZUELA 67.84 67.79 67.30 0.73% 98.50
TURKEY 69.74 69.59 69.09 0.72% 79.81
EGYPT 76.15 76.05 75.52 0.71% 94.73
UZBEKISTAN 74.56 74.34 73.85 0.67% 82.52
URUGUAY 84.89 84.64 84.13 0.61% 92.99
CHILE 78.26 78.16 77.69 0.61% 93.65
INDIA 55.10 55.08 54.75 0.60% 94.70
ISRAEL 89.20 88.84 88.35 0.55% 95.38
IRAN, ISLAMIC REP. OF 69.70 69.66 69.32 0.49% 96.84
NIGERIA 55.31 55.29 55.02 0.49% 103.52
PHILIPPINES 82.02 81.89 81.53 0.44% 92.81
SOUTH AFRICA 76.18 76.13 75.81 0.42% 100.76
THAILAND 69.47 69.44 69.19 0.35% 92.53
INDONESIA 62.92 62.89 62.67 0.35% 94.77
BARBADOS 89.50 88.37 88.11 0.29% 91.67
CZECH REPUBLIC 74.34 74.23 74.02 0.29% 81.79
BOLIVIA 84.05 83.92 83.70 0.26% 91.48
UGANDA 66.31 66.29 66.15 0.21% 96.59
PERU 86.72 86.62 86.44 0.21% 94.95
CHINA 70.52 70.51 70.38 0.18% 96.99
GERMANY 89.48 89.33 89.17 0.18% 95.39
UNITED KINGDOM 90.57 90.36 90.24 0.13% 94.89
JAPAN 83.15 83.13 83.05 0.09% 96.71
KOREA, REP. OF 89.90 89.80 89.72 0.09% 95.13
SAUDI ARABIA 76.62 76.61 76.56 0.06% 93.48
BELARUS 87.24 86.72 86.67 0.06% 89.79
UNITED STATES 91.71 91.69 91.68 0.01% 95.15
BRAZIL 90.27 90.25 90.24 0.01% 94.56
AUSTRIA 91.25 91.04 91.06 -0.02% 93.76
ARGENTINA 91.73 91.67 91.69 -0.02% 93.49
NORWAY 97.82 97.70 97.76 -0.07% 99.24
POLAND 86.07 85.90 85.96 -0.07% 87.85
FRANCE 92.01 91.92 91.99 -0.08% 92.67
ITALY 81.00 80.84 80.91 -0.08% 82.43
CANADA 94.65 94.52 94.60 -0.09% 95.68
RUSSIAN FEDERATION 87.94 87.72 87.86 -0.17% 88.82
SPAIN 92.11 92.02 92.19 -0.18% 89.73
DENMARK 95.83 95.70 95.95 -0.26% 93.10
AUSTRALIA 113.10 113.04 113.39 -0.31% 99.35
GREECE 81.02 80.74 81.07 -0.41% 80.61
SWEDEN 112.09 111.98 112.56 -0.52% 98.27
NEW ZEALAND 98.64 98.26 98.82 -0.57% 97.27
BELGIUM 106.39 106.26 106.93 -0.62% 94.61
NETHERLANDS 97.94 97.81 98.69 -0.89% 83.71
FINLAND 103.34 103.15 104.08 -0.89% 92.43
IRELAND 90.36 89.73 90.94 -1.33% 88.32
PORTUGAL 89.92 89.44 91.64 -2.40% 82.38
The last column of this table clearly shows that for many countries in the sample, especially the
least developed, there are very large differences between the enrollment rates their populations
attain at home and that of the children of migrants from those countries in the OECD. The
combination of this difference and the fraction of the country's population that has migrated to
the OECD yields the per natural estimate, so a country like China, which has an abroad
enrollment rate of over 90% and an official rate of 70%, only shows a difference of 0.18%
between the official measure and the per natural measure because a relatively small fraction of
people born in China live abroad. For many countries, however, there is a large enough fraction
of naturals that have migrated abroad that the per natural measure differs significantly from the
national rate: 40 of the 107 countries (37%) in the sample display a difference of over 2%, and
15 (14%) a difference of over 5%.
As expected, for very high human development countries, the estimated difference is around
zero, since migration between OECD countries is unlikely to lead to very different enrollment
II.3. Consistency of predicted enrollments
In order to check whether the predicted rates for each country of birth of the mothers in each
OECD country are reasonable, we use the 2001 Census from Spain to calculate the enrollment
rates of children of migrant mothers and compare them with the prediction from the model of
Table 1. Table 3 shows these values along with the number of observations used to calculate the
true value from the Census and the error as a percentage of the true value. For the countries that
have more than 300 Observations, the model tends to under-predict enrollments, except for
Morocco, for which the model predicts a 6% higher enrollment than is observed of the children
of Moroccan mothers in Spain. Considering that 31.1% of the Moroccan diaspora (in the OECD)
resides in Spain, the estimated “per-natural” enrollment for Morocco using the true value instead
of the predicted value, would be 52.66, still 4.26% higher that the official rate. This suggests that
the estimates obtained here are conservative, and yet show significant differences for many of
the poorest countries of the world. Figure 1 plots the true versus the predicted enrollment rates
for all countries of birth of mothers (regardless of sample size) but weights each point by the
number od observations used to estimate the true value. The figure also shows that for the most
reliable estimates of the true enrollment rates, the model used here provides fairly conservative
values, which implies that the numbers reported are probably close to the lower bound on the
Table 3. True and predicted enrollment rates of children of migrants by country of origin of the
mother (with more than 300 observations in the 2001 Spanish Census)
Mother's Country of Origin Observations TRUE VALUE
PREDICTED
VALUE ERROR
Morocco 5305 104.40 110.48 6%
France 3100 124.44 106.76 -14%
Ecuador 2112 109.22 110.26 1%
Colombia 2111 111.96 109.90 -2%
Argentina 1693 113.44 106.88 -6%
Germany 1622 130.75 109.48 -16%
Venezuela 1328 114.25 112.13 -2%
Portugal 1165 95.48 100.66 5%
United Kingdom 1139 119.50 109.89 -8%
Peru 899 117.52 109.71 -7%
Dominican Republic 848 102.87 106.47 3%
Cuba 745 125.26 110.07 -12%
Brazil 630 123.40 109.09 -12%
Switzerland 535 151.48 115.88 -24%
Uruguay 448 107.25 106.43 -1%
Romania 442 115.57 105.36 -9%
Belgium 409 130.87 109.87 -16%
Chile 361 116.67 106.68 -9%
United States 346 116.11 107.22 -8%
Figure 1. Predicted and true enrollment rates of children of migrants to Spain, weighted by the
accuracy of the calculation of the true value.
III. HDI Per Natural: Combining Income, Enrollment and Child Mortality
In order to expand the scope of the per natural measurement, using Clemens and Pritchett's
(2008) income and child mortality per natural estimates, we construct an education, a health and
an income index each between 0 and 1 and then aggregate them into a single HDI per natural
measure. The normalization of the enrollment rate and of income is done in the same way as the
UNDP does for its official standard HDI. Enrollment rates are capped at 100 and log GDP per
capita is also capped at log(40000), so a country with per capita income of USD 40000 or more
will have an income index of 1 and countries below 40000 will have a score proportional to the
difference between its log GDP and log(40000). Since child mortality is not a part of the HDI,
we cannot replicate a procedure there as well, but we take a similar approach as with income: a
distance measure is created between the country with the lowest child mortality, which gets an
90 10 0 11 0 12 0 13 0 P re di c te d en rol lm e nt o f c h ildr e n, u s in g m od e l
80 100 120 140 160 180
index value of 1 and the country with the highest mortality, which gets the lowest value in the
sample. Specifically, the index is:
)) _
_ /( _
( 1 _
_MORT IDX CH MORT HI MORT LO MORT
CH i i
Where CH_MORT is country i's mortality, and HI_MORT and LO_MORT are the highest and
lowest observed mortality rates in the sample.
The HDI per natural calculated here is the simple average of these three components, in parallel,
a reduced version of the HDI is constructed for comparability. This reduced version excludes
literacy and uses child mortality as the health component in place of life expectancy. Table 4
presents the estimated values of the HDI per natural along with the corresponding difference
with each country's national comparable HDI for the year 2000, sorted from highest to lowest
[image:19.612.85.507.407.695.2]difference.
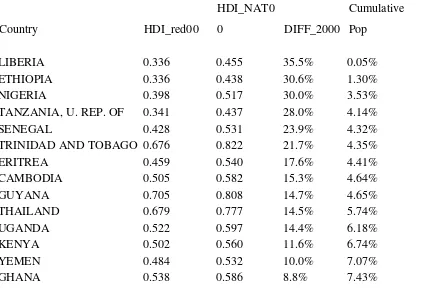
Table 4. Human Development Index Per Natural, year 2000
Country HDI_red00 HDI_NAT0
0 DIFF_2000
Cumulative
Pop
LIBERIA 0.336 0.455 35.5% 0.05%
ETHIOPIA 0.336 0.438 30.6% 1.30%
NIGERIA 0.398 0.517 30.0% 3.53%
TANZANIA, U. REP. OF 0.341 0.437 28.0% 4.14%
SENEGAL 0.428 0.531 23.9% 4.32%
TRINIDAD AND TOBAGO 0.676 0.822 21.7% 4.35%
ERITREA 0.459 0.540 17.6% 4.41%
CAMBODIA 0.505 0.582 15.3% 4.64%
GUYANA 0.705 0.808 14.7% 4.65%
THAILAND 0.679 0.777 14.5% 5.74%
UGANDA 0.522 0.597 14.4% 6.18%
KENYA 0.502 0.560 11.6% 6.74%
YEMEN 0.484 0.532 10.0% 7.07%
JAMAICA 0.760 0.820 7.8% 7.47%
SAMOA (WESTERN) 0.715 0.770 7.8% 7.48%
MYANMAR 0.526 0.564 7.3% 8.30%
BELIZE 0.749 0.803 7.1% 8.30%
PAKISTAN 0.494 0.528 6.9% 10.89%
ALBANIA 0.690 0.736 6.7% 10.94%
NEPAL 0.556 0.590 6.2% 11.38%
INDIA 0.585 0.617 5.5% 30.11%
EL SALVADOR 0.715 0.750 4.9% 30.22%
AZERBAIJAN 0.626 0.655 4.6% 30.37%
CAPE VERDE 0.740 0.774 4.6% 30.38%
BANGLADESH 0.586 0.609 4.0% 32.87%
LEBANON 0.770 0.800 3.9% 32.94%
GUATEMALA 0.675 0.701 3.9% 33.14%
FIJI 0.772 0.803 3.9% 33.16%
NICARAGUA 0.710 0.736 3.8% 33.25%
HONDURAS 0.680 0.705 3.7% 33.36%
MOLDOVA, REP. OF 0.679 0.703 3.6% 33.43%
ARMENIA 0.710 0.734 3.4% 33.49%
MOROCCO 0.650 0.672 3.4% 34.01%
DOMINICAN REPUBLIC 0.748 0.772 3.1% 34.16%
ALGERIA 0.732 0.752 2.8% 34.71%
UZBEKISTAN 0.650 0.666 2.6% 35.15%
CUBA 0.782 0.802 2.6% 35.35%
BOLIVIA 0.704 0.722 2.6% 35.50%
PHILIPPINES 0.767 0.786 2.5% 36.86%
VIET NAM 0.681 0.698 2.4% 38.28%
INDONESIA 0.676 0.692 2.3% 42.07%
SOUTH AFRICA 0.764 0.782 2.3% 42.88%
GEORGIA 0.698 0.714 2.2% 42.97%
PANAMA 0.789 0.806 2.2% 43.02%
JORDAN 0.762 0.777 2.0% 43.11%
PARAGUAY 0.742 0.757 2.0% 43.20%
EGYPT 0.730 0.743 1.8% 44.39%
PERU 0.790 0.804 1.8% 44.85%
SRI LANKA 0.720 0.732 1.7% 45.19%
IRAN, ISLAMIC REP. OF 0.742 0.755 1.7% 46.37%
TURKEY 0.746 0.758 1.6% 49.38%
SYRIAN ARAB 0.691 0.702 1.5% 49.67%
COLOMBIA 0.770 0.780 1.4% 50.42%
CROATIA 0.812 0.823 1.3% 50.50%
LITHUANIA 0.865 0.876 1.3% 50.56%
CHINA 0.729 0.738 1.2% 73.30%
SAUDI ARABIA 0.807 0.816 1.0% 73.67%
SLOVAKIA 0.829 0.837 1.0% 73.77%
CYPRUS 0.866 0.873 0.9% 73.78%
KUWAIT 0.877 0.884 0.8% 73.82%
HUNGARY 0.861 0.867 0.7% 74.01%
BARBADOS 0.904 0.910 0.7% 74.01%
VENEZUELA 0.760 0.765 0.7% 74.45%
URUGUAY 0.847 0.853 0.7% 74.51%
UKRAINE 0.800 0.805 0.7% 75.38%
BRAZIL 0.830 0.835 0.6% 78.50%
CHILE 0.833 0.838 0.5% 78.78%
BULGARIA 0.809 0.813 0.5% 78.92%
COSTA RICA 0.788 0.791 0.4% 78.99%
MALAYSIA 0.808 0.811 0.4% 79.41%
SWITZERLAND 0.923 0.926 0.4% 79.54%
POLAND 0.872 0.874 0.3% 80.23%
ISRAEL 0.926 0.929 0.3% 80.33%
CZECH REPUBLIC 0.857 0.859 0.3% 80.52%
ARGENTINA 0.887 0.889 0.3% 81.18%
NEW ZEALAND 0.952 0.954 0.2% 81.25%
AUSTRALIA 0.971 0.973 0.2% 81.59%
UNITED STATES 0.957 0.960 0.2% 86.69%
JAPAN 0.918 0.920 0.2% 88.96%
KOREA, REP. OF 0.901 0.903 0.2% 89.80%
GERMANY 0.935 0.937 0.2% 91.28%
UNITED KINGDOM 0.941 0.942 0.2% 92.33%
FRANCE 0.946 0.947 0.1% 93.39%
GREECE 0.884 0.886 0.1% 93.59%
RUSSIAN FEDERATION 0.843 0.844 0.1% 96.23%
SWEDEN 0.975 0.977 0.1% 96.38%
BELGIUM 0.975 0.976 0.1% 96.57%
SPAIN 0.938 0.939 0.1% 97.43%
NORWAY 0.982 0.982 0.0% 97.51%
CANADA 0.958 0.959 0.0% 98.06%
ITALY 0.899 0.899 0.0% 99.10%
FINLAND 0.974 0.975 0.0% 99.19%
BELARUS 0.826 0.826 -0.1% 99.37%
NETHERLANDS 0.973 0.972 -0.1% 99.65%
DENMARK 0.965 0.964 -0.1% 99.75%
IRELAND 0.927 0.925 -0.2% 99.82%
PORTUGAL 0.914 0.907 -0.7% 100.00%
The table shows that of the 100 countries for which this estimation was possible (5.58 Billion
people), 47% had a difference of more than 2% between the country's comparable HDI and HDI
Per Natural, representing approximately 43.2% of the world population. The difference is over
10% for 13% of countries, just under 400 Million people. As expected, the estimated differences
are largest for the least developed countries. The maximum difference between income per
natural and GDP per capita in the sample is 104%, while the maximum difference between per
natural enrollment and official enrollment is 28% and for child mortality the maximum
difference is 24%. The greatest differences across populations occur in income, which suggests
that this aspect of human welfare explains most of the HDI difference between the per natural
[image:22.612.83.487.70.241.2]and the national measure.
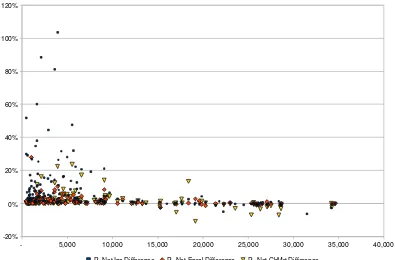
Figure 2 shows the percentage difference between per natural and national measures for
populations from all countries in the sample, by level of GDP per capita. It shows that the
observed differences in income are generally much larger than for health and education, and that
in all three dimensions, the differences become significantly large for countries below US $
Figure 2. Differences in Per Natural and National Measures for levels of GDP per capita
Higher per natural measures stem from a large diaspora combined with large welfare differences.
As part of the estimation procedure, we have estimated the value of income, enrollment and child
mortality of peoples outside their country of origin. A comparison of how well these people fare
abroad and the conditions of those who stay, gives a closer idea of the magnitude of the welfare
gain from migration; although there may be many differences in observable and unobservable
individual level characteristics which preclude an interpretation of this comparison as a true
migration gain, the magnitudes and cross country patterns give us a sense of which countries
may benefit the most and therefore where we are likely to find the strongest incentives to move
internationally.
- 5,000 10,000 15,000 20,000 25,000 30,000 35,000 40,000 -20%
0% 20% 40% 60% 80% 100% 120%
Figure 3. Income Abroad and GDP Per Capita by level of development
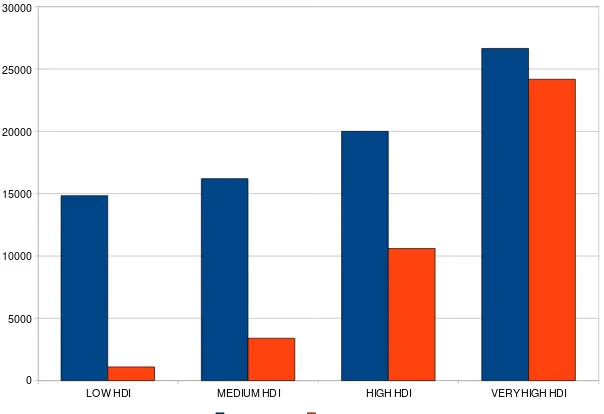
Analogous comparisons can be made with education and health, for which a similar pattern
emerges. Figures 4 and 5 show that migrants from the lowest HDI countries are the ones that
stand to gain the most from moving abroad.
LOW HDI MEDIUM HDI HIGH HDI VERY HIGH HDI 0
5000 10000 15000 20000 25000 30000
Figure 4. Abroad and National Total Gross Enrollment Rates
Figure 5. Abroad and National Child Mortality Rates
LOW HDI MEDIUM HDI HIGH HDI VERY HIGH HDI 0
10 20 30 40 50 60 70 80 90 100
Abroad Enrollment HDI enrollment
LOW HDI MEDIUM HDI HIGH HDI VERY HIGH HDI 0
20 40 60 80 100 120
[image:25.612.122.486.411.591.2]IV. Gains to Migration
The coarsest estimate one can make of the gains to migrating internationally is the simple
difference in standards of living across countries, the problem with that measure of course is that
the people residing in various countries are probably very different in many respects and are
therefore not comparable. One view of the estimates presented here is that when we look at the
income, health and education outcomes of naturals of a given country both in the country of
origin and at destination countries, we are moving one step forward in making a more reasonable
comparison and thus getting closer to an estimate of the gains to migration.
It is still true, however, that comparing migrants to non-migrants from a given country does not
provide the quantity of interest, since migrants can have higher education than non-migrants,
higher wealth, better health, or other observable differences that can have an effect both on the
migration decision and on the observed outcomes in the country of destination. Clemens,
Montenegro and Pritchett (2008) address these issues by comparing observably identical workers
between several countries of origin and the US to estimate the wage premium attained by these
workers as a consequence of moving to the US labor market. They provide evidence that for
observably identical workers, the wage gains can be huge, ranging from over a 15-fold difference
to just under double in the lowest case, with a median of a 4-fold increase in wages.
Although these estimates are much better than those calculated from aggregate data, they still
don't account for the fact that migrants may differ from non-migrants in non-observable ways.
For the countries for which Clemens, Montenegro and Pritchett (2008) are able to correct for this
source of bias (Philippines, Mexico and South Africa), they find significant a wage premium in
the order of a doubling or tripling of wages, associated with migration to the United States for
observably and unobservably identical workers. Their estimated annual earnings gain for a
median country in their sample is US $10,000, which is larger than the GDP per capita of over
IV. 1. Education place premium
We are also interested in better understanding the gains to migration in other dimensions of
human welfare. Here we lay out a procedure to estimate place premia in education outcomes
using individual level data for origin and destination countries and apply it to Nicaraguan
immigrants to Costa Rica. The methodology is closely related to that proposed by Clemens,
Montenegro and Pritchett (2008), but bears on a different conceptual framework.
As the educational outcomes of adult migrants are unlikely to change very much upon arrival at
the destination country, we focus here on the children of migrant households. Specifically, the
outcome being observed is whether children in the household who are of school going age, are in
fact enrolled in school. This measure has the advantage that it is directly linked with aggregate
school enrollment, a popular indicator of schooling outcomes. The question being asked,
therefore, is whether the likelihood of a child being enrolled in school changes when the family
voluntarily moves to from one country to another, and if so, by how much. The analysis should
be independent of the pair of countries analyzed, though the estimated gains will certainly differ
across pairs of countries.
Among the leading determinants of school achievement of children, be it measured by test
scores, enrollment or attainment, are the socioeconomic characteristics of their household (Hsieh
and Urquiola, 2006; McEwan, Urquiola and Vegas (2008)); there are several channels through
which higher parents' education can translate into better schooling outcomes: higher incomes,
better quality family time and a learning environment at home, and direct transmission of innate
ability. Also important is the availability of schooling services at a relatively low cost and a
social safety net that helps keep the children in school during economic downturns. School
enrollments can change due to a number of factors when a family crosses the border to another
country, the large estimated gain in earnings suggests that better incomes are likely to be a very
significant part of the story, but other factors such as the availability of teachers and schools, the
quality of infrastructure and the efficiency and cost of the transportation system, may be
The natural starting point of any attempt to measure the gains to migration is a comparison of the
observed level of the outcome of interest (enrollment rates or wages for example) between the
two countries. This aggregate figure will include the entire population residing in each country
(nationals and foreigners) and is the way differences in development are normally described. So
someone moving from a country with a 60% total enrollment rate to another with an 80% rate
should be doing much better after the move. However, since we may expect there to be
differences in how locals and migrants fare in the educational system, it is necessary to look at
the particular migrant population of interest in the destination country and compare their
outcomes with those back home; this is the kind of exercise carried out above for income, school
enrollments and child mortality. Yet, as argued, this is still insufficient, since the migrants
themselves may be younger, better educated, more entrepreneurial or just different in some other
observable or unobservable way. The purpose Clemens, Montenegro and Pritchett (2008) and of
the present analysis is to move closer to an adequate comparison of individual level outcomes
that leads to a better estimate of the gains to moving across international borders. We use micro
data to control for observable characteristics of individuals and families on both sides of the
border and then use information on migration decisions in the country of origin to adjust the
estimates for any remaining unobservable differences between migrants and non migrants. The
next sub section describes the precise procedure.
IV.2. Methodology
Because the nationals of the origin country who currently reside in the destination country may
be very different from the nationals who stayed at home, both in observable characteristics such
as their level of education or their age, as well as in unobservable characteristics such as
intelligence or entrepreneurial drive, it is necessary to take these into consideration when
comparing those who migrated to those who didn't.
Consider the following simple binary choice model. Let y=1 if the child is enrolled in school and
otherwise 0 0 if 1 * y
y (1)
Where y* X uand where X includes a number of observable individual and household level
characteristics. It is well known that depending upon the distributional assumptions made about
the error term u, the resulting empirical specification for estimating the probability of enrollment
at the individual level, will be different. The challenge of identifying the effect of migration on
the probability of enrollment can be illustrated using the predicted probabilities from the
preceding binary choice model. Let P[E|C,d] be the probability of enrollment (E) of children
who live in country (C) and whose family made the choice (d) of moving or not (d=M for
migrants and d=S for stayers). The pure impact of migration would be P[E|C,M]P[E|C,S],
however, it is not possible to observe the second term in this expression since a foreign family
and their children cannot be observed both living in the destination county C and having decided
not to migrate. This is the fundamental problem of identification of this relationship. Turning to
the specific example of Nicaraguan immigrants in Costa Rica, given the micro data, we can
estimate: ] , | [ ] , | [
_DIFF P E CRI M P E NIC S
RAW
Adding and subtracting P[E|CRI,S] we get
] , | [ ] , | [ ] , | [ ] , | [
_DIFF P E CRI M P E CRI S P E CRI S P E NIC S
RAW
BIAS PREMIUM
DIFF
RAW _ (2)
The first two terms form the quantity we are interested in (PREMIUM), and the last two form the
error we commit by using the raw difference as our estimate (BIAS). This bias will be positive
whenever the enrollment rates of those who migrated, had they stayed would have been higher
than the enrollment rates of those who stayed (i.e. positive selection), and negative if it were the
IV.3. Estimating the probability of school enrollment
Following Angrist and Krueger (2001), we use a simple linear probability model to obtain a
prediction function for the probability of children’s school enrollment in Nicaragua, based on the
2001 LSMS micro data, and analogously for Nicaraguans in Costa Rica using the 5% sample of
the 2000 Census, available through the IPUMS International Project at the University of
Minnesota.
The outcome variable is whether the children aged between 7 and 22 are currently enrolled in
school, and the variables used to predict it are age, gender, number of children in the household,
an indicator for the household being located in a rural area, age and educational attainment of the
household head, an indicator for two‐parent households, and due to the lack of earnings data in
the Costa Rican census, a series of variables that proxy for household wealth: whether the floor
is of a quality material, whether the household owns the dwelling, and whether the household has
a direct connection to piped water and electricity.
With this model in hand, we wish to compare two children with the same observable
characteristics on both sides of the border (RAW_DIFF). Consider an 8 year old girl, with one
sibling in the household, residing in an urban area, where the household head is 35 years old, has
completed secondary schooling in Nicaragua, has a partner living in the household, and where
the family owns the dwelling, which has floors of good material and has piped water and
electricity. Table 5 shows that this child has a probability of 0.63 of being enrolled in school if
[image:30.612.85.542.559.706.2]she lives in Nicaragua and 0.83 if he lives in Costa Rica.
Table 5. Predicted Probability of Enrollment (Nicaraguans in Costa Rica and at home)
Nicaraguans in
Costa Rica (recent)
Nicaraguans in
Nicaragua Compariso
n value
Child's Age -0.0191 -0.0040 8
Male Child 0.0000 -0.0424 0
Children in HH 0.0150 0.0202 2
Rural HH -0.0800 0.0000 0
Educ. Attainment of HH Head 0.0839 0.0602 3
Both Parents in HH 0.0000 0.0270 1
Floor in Good Condition 0.1093 0.0000 1
HH Owns Dwelling 0.0000 0.0000 1
Piped water to home 0.0000 0.0775 1
Electricity connection 0.0000 0.1052 1
Constant 0.5879 0.3490
Predicted Value for comparison
child 0.8260 0.6251
This provides the first estimate of interest: RAW DIFF is 0.2. However, from the discussion
above, we know that if any unobservable factors are positively correlated both with migration
and with the probability of being enrolled in school, this will be an overestimate of the effect of
migration from Nicaragua to Costa Rica on children’s school enrollment. Even if we cannot
directly estimate P[E|CRI,S], we can get a reasonable approximate estimation from the subset
of households in Nicaragua that have had an international migrant in their family. Under the
assumption that the distribution of unobservable characteristics of households with international
migrants but where at least one member remains behind is similar to the distribution of
unobservable traits of families where all members migrate, it is possible to estimate the size of
the BIAS term in (2).
Panel and retrospective data on migration
The Nicaraguan 2001 LSMS survey is a follow up of the 1998 LSMS conducted just months
before Hurricane Mitch devastated an important fraction of the territory. Approximately 77% of
the children (and their households) in the 2001 sample had been interviewed in 1998, and in both
years there is a question on whether the household had an international migrant that was not
international migration experience and the person’s age when that first occurred. We adopt two
alternative definitions of a migrant household: the first, and generally preferred, is a household
that had no international migrants in 1998 but reported having at least one international migrant
in 2001, the second, is whether the household reported having an international migration
experience ever.
We estimate the same model described above and obtain an analogous predicted value for the
same observably identical child for migrant and non‐migrant households under both definitions.
The result is shown in Table 6. The difference in the predicted enrollment probability for the
observably identical child between migrant and non migrant families is almost 0.06 under the
panel definition, and just over 0.08 under the retrospective definition, which are in each case the
corresponding BIAS estimates. These figures imply an estimated gain in the enrollment
probability (PREMIUM) of approximately 0.14 under the preferred definition and around 0.12
under the alternative definition. The comparable value to those reported in Clemens, Montenegro
and Pritchett (2008) would simply be calculated as
] , | [ / ) ]
, | [ ( Re
_ P E CRI M BIAS P E NIC S
PREMIUM and in this case gives a value of 1.23
(see Table 6).
Estimates of school enrollment rates obtained from household micro level data do not coincide
exactly with the administrative (official) data on enrollment rates. As was discussed in the
section on the estimation of enrollment rates per natural, there are two sources of differences, the
first is that in one case enrollment is self reported and in the other it comes from administrative
records, the second is that in the data used here, the calculations are restricted to children living
with their parents. These factors often imply that enrollments are over estimated in the micro
data. The degree of overestimation is slightly higher in Costa Rica than in Nicaragua, so the
estimated premium is adjusted downwards by approximately 5.5%, in addition, since the micro
data from Costa Rica corresponds to the year 2000 and for Nicaragua it corresponds to 2001, we
are effectively ignoring any progress in enrollment rates that Costa Rica made between 2000 and
2001, which according to official statistics, was about 3.4%. Combining these effects and
in Clemens, Montenegro and Pritchett (2008), this is PREMIUM_Re (Survey Adjusted) in Table
[image:33.612.57.597.206.696.2]6.
Table 6. Predicted Probability of Enrollment for migrant and non‐migrant households
(Nicaragua)
Nicaraguans
without a
Migrant
(TRUE
PANEL)
Nicaraguans
with a
Migrant
(TRUE
PANEL)
Nicaraguans
without a
Migrant
(RETROSPE
CT)
Nicaraguans
with a
Migrant
(RETROSP
ECT)
Compariso
n value
Child's Age -0.0067 -0.0172 -0.0029 -0.0053 8
Male Child -0.0430 0.0000 -0.0287 -0.0401 0
Children in HH 0.0170 0.0177 0.0256 0.0191 2
Rural HH 0.0000 0.0000 0.0000 -0.0462 0
Age of HH Head -0.0035 0.0000 -0.0026 -0.0043 35
Educ. Attainment of HH Head 0.0606 0.0677 0.0726 0.0532 3
Both Parents in HH 0.0552 0.0000 0.0000 0.0000 1
Floor in Good Condition 0.0000 0.0000 0.0000 0.0000 1
HH Owns Dwelling 0.0000 0.0000 0.0000 0.0418 1
Piped water to home 0.0552 0.0000 0.0736 0.0749 1
Electricity connection 0.1007 0.0000 0.1157 0.0836 1
Constant 0.4160 0.6239 0.2261 0.4464
Predicted Value for comparison
child 0.6679 0.7245 0.5694 0.6522
BIAS 0.0566 0.0828
PREMIUM 0.1443 0.1181
PREMIUM_Re 1.2309 1.1889
PREMIUM_Re
(Survey-adjusted) 1.2007 1.1586
These estimates suggest that migration between developing nations may also potentially have
very significant impacts on family welfare, in this case an increase in over 20% in the probability
of being enrolled in school for the children of Nicaraguan migrants into Costa Rica. It is very
difficult to think of any internal educational policy in Nicaragua that could lead to such a large
increase in enrollments in that country in a short period of time.
A bit of policy context can help better understand the estimated impact of migration on
educational outcomes. Costa Rica’s Constitution (1949) establishes free of charge and
compulsory pre school and primary education for everyone as well as a minimum public sector
education budget of 6% of GDP. In 1957, the Education Code laid down the basic principles of
the country’s education system, which would permeate into curricular design and administrative
decisions regarding students and other policies:
1) The promotion of a sense of civic duty and awareness of rights, freedoms and a
sense of responsibility and respect for human dignity
2) The development of individual personality
3) The preparation of citizens for democracy, reconciliation of self interest and the
community's wellbeing
4) The stimulation of solidarity and human understanding
In 1994, the Education Council set forth a long term vision in “Education Policy towards the 21st
Century”, which placed an emphasis on the quality of education and on equal access,
underscoring the same principles ascribed to previously.
The Ministry of Education's Strategic Plan (2002) had several key guidelines, some of which
infrastructure, 3) school dining rooms, 4) transportation for secondary school students, 5)
scholarships for secondary and tertiary school students, 6) free transportation for handicapped, 7)
decentralization of the system's administration, 8) Increase community participation, 9) increase
informational and managerial efficiency in general. This strategic plan was accompanied by a
“Accion Plan for Education for All 2003-2015”. These elements suggest that Costa Rica’s more
developed institutional endowment for the provision of education is readily made available to the
children of migrants from Nicaragua, which is probably related to the observed gain in
enrollment probability.
V. HDI Per Natural Over Time
Using essentially the same methodology as we used in sections II and III, we estimate enrollment
rates, child mortality and income per natural for the year 1990, using incomes of foreign born
residents in the United States, as recorded in the Census of 1990, and their children's school
enrollment rates at all levels. Docquier and Marfouk (2005) contains the educational composition
of adult migrants to OECD countries from every other country for 1990 as well, which allows a
similar model as that used for the 2000 data. We can thus provide a view of the evolution over
time of the per natural measure and whether countries of different levels of development. Table 7
shows the estimated values of both the HDI per natural, its comparable (reduced) version for
1990 and 2000 and the growth rates of each. The data in the table are sorted according to the
difference between the growth rate of the per natural measure and the national measure, and
shows that the poorest countries are at the top and the bottom. This fact is better illustrated in
figure 6, which plots the difference in the growth rates of the two measures against per capita
[image:35.612.71.555.650.692.2]GDP in 1990.
Table 7. HDI Per Natural and Comparable HDI, 1990, 2000 and Growth rates
HDI_red9
0
HDI_NAT
90
HDI_red0
0
HDI_NAT
00
HDI_Grow
th
HDI_NAT
ETHIOPIA 0.363 0.371 0.336 0.438 -7.48% 18.13%
NIGERIA 0.482 0.483 0.398 0.517 -17.43% 7.06%
TANZANIA, U. REP.
OF 0.427 0.435 0.341 0.437 -20.06% 0.57%
SENEGAL 0.507 0.535 0.428 0.531 -15.50% -0.90%
UGANDA 0.480 0.486 0.522 0.597 8.66% 22.80%
TRINIDAD AND
TOBAGO 0.773 0.810 0.676 0.822 -12.61% 1.49%
THAILAND 0.689 0.692 0.679 0.777 -1.44% 12.27%
YEMEN 0.480 0.487 0.484 0.532 0.65% 9.26%
KENYA 0.595 0.605 0.502 0.560 -15.63% -7.32%
BELIZE 0.733 0.740 0.749 0.803 2.22% 8.39%
INDIA 0.575 0.581 0.585 0.617 1.74% 6.20%
SAMOA (WESTERN) 0.691 0.715 0.715 0.770 3.42% 7.72%
GHANA 0.555 0.581 0.538 0.586 -2.95% 0.80%
PAKISTAN 0.479 0.497 0.494 0.528 3.01% 6.26%
HONDURAS 0.667 0.672 0.680 0.705 1.81% 4.89%
ARMENIA 0.728 0.732 0.710 0.734 -2.44% 0.37%
GEORGIA 0.768 0.764 0.698 0.714 -9.09% -6.61%
DOMINICAN
REPUBLIC 0.698 0.705 0.748 0.772 7.21% 9.42%
SOUTH AFRICA 0.809 0.811 0.764 0.782 -5.59% -3.68%
INDONESIA 0.649 0.652 0.676 0.692 4.23% 6.09%
CROATIA 0.804 0.802 0.812 0.823 1.04% 2.57%
NEPAL 0.537 0.563 0.556 0.590 3.36% 4.82%
SLOVAKIA 0.829 0.826 0.829 0.837 -0.02% 1.30%
PHILIPPINES 0.754 0.764 0.767 0.786 1.69% 2.92%
IRAN, ISLAMIC
REP. OF 0.710 0.714 0.742 0.755 4.59% 5.65%
GUATEMALA 0.610 0.628 0.675 0.701 10.71% 11.71%
PERU 0.735 0.743 0.790 0.804 7.40% 8.24%
CHINA 0.630 0.633 0.729 0.738 15.69% 16.47%
ALGERIA 0.716 0.731 0.732 0.752 2.22% 2.87%
PANAMA 0.748 0.761 0.789 0.806 5.45% 5.98%
LITHUANIA 0.842 0.848 0.865 0.876 2.76% 3.27%
BRAZIL 0.741 0.742 0.830 0.835 11.95% 12.41%
CANADA 0.968 0.965 0.958 0.959 -0.96% -0.63%
VENEZUELA 0.769 0.772 0.760 0.765 -1.19% -0.87%
FINLAND 0.933 0.931 0.974 0.975 4.41% 4.68%
UNITED STATES 0.948 0.947 0.957 0.960 1.04% 1.30%
COLOMBIA 0.728 0.736 0.770 0.780 5.78% 6.03%
SWITZERLAND 0.889 0.891 0.923 0.926 3.75% 3.97%
JAPAN 0.896 0.896 0.918 0.920 2.46% 2.65%
AUSTRALIA 0.882 0.882 0.971 0.973 10.13% 10.32%
FRANCE 0.910 0.909 0.946 0.947 3.99% 4.17%
BELGIUM 0.908 0.908 0.975 0.976 7.34% 7.51%
HUNGARY 0.814 0.818 0.861 0.867 5.78% 5.94%
JORDAN 0.688 0.701 0.762 0.777 10.79% 10.93%
NETHERLANDS 0.924 0.922 0.973 0.972 5.28% 5.41%
SPAIN 0.900 0.900 0.938 0.939 4.24% 4.38%
GERMANY 0.884 0.884 0.935 0.937 5.83% 5.93%
AUSTRIA 0.899 0.899 0.948 0.949 5.43% 5.52%
NORWAY 0.915 0.914 0.982 0.982 7.35% 7.43%
ARGENTINA 0.827 0.829 0.887 0.889 7.26% 7.33%
SWEDEN 0.882 0.883 0.975 0.977 10.57% 10.60%
SYRIAN ARAB
REPUBLIC 0.715 0.726 0.691 0.702 -3.38% -3.37%
UNITED KINGDOM 0.880 0.882 0.941 0.942 6.86% 6.84%
DENMARK 0.910 0.909 0.965 0.964 6.13% 6.03%
CHILE 0.782 0.787 0.833 0.838 6.62% 6.46%
ITALY 0.867 0.868 0.899 0.899 3.69% 3.54%
NEW ZEALAND 0.880 0.884 0.952 0.954 8.16% 7.97%
COSTA RICA 0.762 0.766 0.788 0.791 3.49% 3.29%
GREECE 0.865 0.868 0.884 0.886 2.29% 1.98%
RUSSIAN
FEDERATION 0.859 0.863 0.843 0.844 -1.82% -2.16%
MEXICO 0.751 0.766 0.790 0.803 5.20% 4.85%
PARAGUAY 0.704 0.721 0.742 0.757 5.37% 5.01%
EGYPT 0.673 0.688 0.730 0.743 8.36% 7.98%
VIET NAM 0.593 0.610 0.681 0.698 14.76% 14.32%
CAPE VERDE 0.668 0.702 0.740 0.774 10.69% 10.23%
POLAND 0.816 0.823 0.872 0.874 6.78% 6.30%
URUGUAY 0.811 0.820 0.847 0.853 4.45% 3.97%
IRELAND 0.882 0.885 0.927 0.925 5.13% 4.56%
BOLIVIA 0.617 0.636 0.704 0.722 14.21% 13.56%
UKRAINE 0.820 0.832 0.800 0.805 -2.52% -3.29%
TURKEY 0.669 0.685 0.746 0.758 11.45% 10.54%
ISRAEL 0.874 0.885 0.926 0.929 5.95% 5.00%
SRI LANKA 0.708 0.728 0.720 0.732 1.65% 0.58%
CYPRUS 0.813 0.830 0.866 0.873 6.43% 5.18%
BULGARIA 0.804 0.819 0.809 0.813 0.52% -0.77%
MALAYSIA 0.742 0.754 0.808 0.811 8.88% 7.57%
EL SALVADOR 0.674 0.716 0.715 0.750 6.15% 4.79%
MOLDOVA, REP. OF 0.749 0.789 0.679 0.703 -9.43% -10.95%
ALBANIA 0.718 0.781 0.690 0.736 -3.92% -5.78%
PORTUGAL 0.843 0.852 0.914 0.907 8.42% 6.49%
NICARAGUA 0.654 0.692 0.710 0.736 8.49% 6.39%
JAMAICA 0.723 0.797 0.760 0.820 5.15% 2.94%
BELARUS 0.816 0.838 0.826 0.826 1.32% -1.46%
MOROCCO 0.594 0.634 0.650 0.672 9.46% 6.01%
LEBANON 0.723 0.778 0.770 0.800 6.55% 2.82%
GUYANA 0.674 0.807 0.705 0.808 4.53% 0.15%
TOGO 0.572 0.595 0.681 0.663 19.00% 11.50%
Twenty percent of the countries for which it is possible to estimate these indicators exhibit a
difference of 2 percentage points or more in the growth rate of per natural HDI and their
corresponding national HDI. Again, the largest observed differences are displayed by the poorest
countries in the sample; for example, Ethiopia’s National Human Development regressed by
7.5% between 1990 and 2000, but its people’s HDI increased by 18% over the same period, a
similar pattern is observed for other African and Asian peoples. Over this period, for many of the
poorest nations in the world, bettering human development relied increasingly on the possibility
[image:39.612.74.557.71.196.2]of moving across international borders.
Figure 7 also shows that poorer countries are also those with the smallest (most negative)
differences in per natural and national HDI growth rates. For wealthier countries, the differences
gradually approach zero. One interpretation of this fact is that the data from poorer countries is
of worse quality and is therefore more noisy, however, the asymmetric variability in the data
Figure 7. Difference in Growth Rates of HDI per natural and national measures vs. GDP Per Capita ALB DZA ARG ARM AUS AUT BGD BLR BEL BLZ BOL BRA BGR CAN CPV CHL
CHN COLCRI
HRV CYP DNK DOM EGY SLV ETH FIN FRA GEO DEU GHA GRC GTM GUY HND HUN IND IDN IRN IRL ISR ITA JAM JPN JOR KEN KOR LBN LTU MYS MEX MDA MAR NPL NLD NZL NIC NGA NOR PAK PAN PRY PERPHL POL PRT RUS WSM SAU SEN SVK ZAF ESP LKA SWE CHE SYR TZA THA TGO TTO TUR UGA UKR GRB USA URY VEN VNM YEM -1 0 0 10 20 30 % D if fe ren c e HD I_ Na t gr o w th -H DI _r e d gr o w th
0 10000 20000 30000 40000 GDP per capita (1990)
VI. Concluding Remarks
This paper has extended the estimation of income per natural to Human Development per natural
by combining Clemens and Pritchett’s (2008) income and child mortality estimates with new
enrollment rate per natural values. The methodology was also used to obtain new estimates of the
HDI per natural for 1990 and growth rates between 1990 and 2000 calculated. A discussion of
the link between per natural measures and the gains to migration is provided and illustrated in
detail with new estimates of an education place premium between Nicaragua and Costa Rica.
Per natural welfare measures are not estimates of the gains to migration, they are an alternative
step to calculating these measures, we estimate outcomes of populations from different countries
away from their place of birth, and this can be seen as a stepping stone towards estimating the
actual gains o migration, which require careful consideration of the influence of observable and
unobservable individual characteristics on outcomes and the migration decision.
There are two key conclusions from this analysis. The first is that poorer nations stand to gain the
most from international migration, and the second is that even if we consider migration between
developing nations, these gains can be quite significant.
References
J. Angrist and A. Krueger, “Instrumental Variables and the Search for Identification,” Journal of
Economic Perspectives 15[4], Fall 2001, 69-85
Clemens, M. and Lant Pritchett (2008), "Income Per Natural: Measuring Development for
People rather than Places", Population and Development Review, 34 (3): 395-434.
Clemens, M. C. Montenegro and L. Pritchett “The Place Premium: Wage differences for
identical workers across the US border”, CGD Working Paper 148, 2008.
Hsieh and Urquiola "The effects of generalized school choice on achievement and stratification:
Evidence from Chile's school voucher program", Journal of Public Economics, 90, 1477-1503,
2006.
McEwan, P., M. Urquiola and E. Vegas "School choice, stratification, and information on school
performance" Economía (Journal of the Latin American Economic Association), 8(2), 1-42,