Munich Personal RePEc Archive
Risk Management in International
Bussiness
Nistor, Rozalia and Nistor, Costel and Muntean,
Mihaela-Carmen
"Dunarea de Jos" University of Galati, "Dunarea de Jos" University
of Galati, "Dunarea de Jos" University of Galati
2009
Online at
https://mpra.ub.uni-muenchen.de/25362/
RISK MANAGEMENT IN
INTERNATIONAL BUSSINESS
Abstract: Any activity or economic effort is based on a number of unknown and uncertain factors or opportunities simply because its subject is located in the future. All decisions or actions that will lead to a production process or act of foreign trade is inevitably initiated or taken in circumstances of uncertainty and risk. There are sometimes situations where the uncertainty is too high, making it virtually impossible because a decision or goal in itself or the way that it can achieve are not sufficiently defined, or that risks could be totally destructive. In normal economic life, we don’t have to choose between risky situations and certain situations, but between different degrees of risk and different outcomes.
Key words: risk, uncertainty, variable, risk cost
Jel cod: D81, F23, F50, G32
Introduction: This work is structured in four major chapters. The first chapter presents general concepts and specific sizing economic risk and level indicators characterizing the size effect at a time. Chapter two describes the economic risk management, presenting an analysis model based on three elements: variability cost of risk and risk treatment. In chapter three specific are analyzed risk factors in international economic relations as processes that have fostered the development of trade and economic development as part of human society. The last chapter outlines some specific risk factors of foreign trade with agricultural products that act in hopes demand for food.
1. Dimension of economic risk
Over the last two decades, risk management in the economic activity as well as its implications on the economic entities brought about an explosive development of technical and methodological approaches of the concept. This aspect occurred over a period of increase of interdependence degree of the economic systems and acceleration of the information flow.
As a result of this process, the diversity of technical and methodological approaches was explained strictly on a disciplinary basis, being founded on a number of criteria varying from the commercial, financial or investment ones up to the psycho-sociological or philosophical ones. This particular approach of risk may induce to the economic receiver the perception of non-systematisation of the accomplished analytic constructions and of dynamics of chaos in this new universe of economic knowledge.
determination of the risk effects size are based on the use of some level indicators that characterize the size effect at a certain point. Among the various assessment methods are relevant those that capture and characterize the degree of complexity and size effects, at a certain point and in dynamics.
The size of risk effects can be expressed by the means of quantitative indicators, where the emphasizing of some dimensions of risk encountered in technical and economic fields are necessary, and if the risk concerns political and social areas, the indicators that are mainly used are the qualitative ones. In some cases, the simultaneous employment of both quantitative and qualitative indicators is particularly effective, especially if those forms of risk relating to economic or technical dimensions have consequences on the social level as well. Depending on the decisional situation circumstances, the quantities used to quantify the uncertainty level, can be classified into two categories: indicators that are specific to conditions of uncertainty and indicators specific to risk conditions.
A. Indicators specific to conditions of uncertainty
Among the quantities used to describe and assess the uncertainty level in the economic practice the following indicators are employed:
• the worst result;
• the best result;
• the result(s) with the greatest plausibility.
a) The worst result (aimin) of a decisional alternative (Vi) coresponds to that particular
decisional consequence that may occur when the most pessimistic hypothesis were accomplished on the external environment impact. Sometimes this indicator is used as a decisional constraint that serves to eliminate that variants considered being too risky. Moreover the worst result is used as a decisional criterion employed by the pessimistic method of
decision consolidation, elaborated by the statistician Abraham Wald on the concepts
formulated by the mathematician John von Neumann. This method is applied especially by the managers who show aversion to risk and who believe that the best alternative decision is the one which triggers the best results in the most unfavorable circumstances.
b) The best result (aimax) of a decisional alternative (Vi) is represented by the
decisional consequence that may occur when the most optimistic hypothesis were accomplished on the external environment impact. This indicator is used as a criterion of assessment employed by the optimistic method of decision consolidation which is applied especially by managers who show preference towards risk and who believe that the best decision is the one that brings the best results under the most favorable circumstances.
c) The result(s) with the greatest plausibility (aiv) of a decisional alternative (Vi)
corresponds to that particular consequence (or multitude of consequences) in connection with which the decision-maker thinks it might have all the chances of accomplishment. This indicator can be calculated only when the decision-maker can appreciate, even if not very rigorously, the chances of occurrence of various states of nature. The assessment of the decisional alternatives based on the most credible result, although it cannot provide a greater accuracy to decision consolidation, it can however provide a simplicity and efficiency to this process.
B. Indicators specific to risk conditions
• probability of adverse results occurrence;
• mathematical expectation (expected value) of results;
• average square deviation of the results;
• coefficient of results variation.
a) probability of adverse results occurrence (pi-) is an indicator that shows the
chances of the decisional alternative implementation (Vi) to have losses as a result. This size
can be calculated in two ways, depending on the type of the random variable that characterises the decisional situation.
* when a discrete type random variable is used the occurence probability of some negatice results for a Vi variant is provided by the following:
∑
=−
=
r1 k
* k
1
p
p
(1.1.)where:
pk* are the probabilities coressponding to the states of nature for which the variant Vi
will record the negative results.
• when the decisional situation is characterised by a continuous type random variable,
having a spreading density f(x), the probability of occurence of some negative results (reprezented by the blackened surface in figure 1) can be calculated by using the following formula:
∫
=
− 0
a 1
1
dx
)
x
(
f
p
(1.2.)where:
a1 is the inferior limit of the possible results interval of variant Vi (a1< 0).
This indicator is used in assessing decisional alternatives especially by managers who exhibit risk aversion and who dedicate great importance to the possibility of recording losses. Its relative simple method of calculation gives certain efficiency to decision consolidation but
0 a1
p
[image:4.595.123.477.342.522.2]a
the rigorous evaluation is affected by the fact that only negative results are taken into consideration.
b) mathematical expectation (expected value) of results (EV(ai)) is a size that can be
considered an average of the potential decisional consequences of a decissional alternative (Vi)
balanced by their ocuurence probabilities. This indicator can be determined in two ways depending on the random variable type that characterises the decisional situation.
• When a discrete type random variable is used the mathematical expectation of the results of a decisional variant (Vi) is given by the following formula:
∑
=
rk
ik k 1
)
p
a
a
(
EV
(1.3.)where:
pk is the accomplishment probability of the nature state SNk;
aik is the result that the decisional alternative (Vi) would have when the nature state
SNk.were accomplished.
• When the decisional situation is characterized by continuous type random variable,
having a spreading density f(x), the mathematical expectation of the results of the Vi
decisional variant can be calculated by applying the following formula:
∫
+∞
∞ −
⋅
=
x
f
(
x
)
dx
)
a
(
EV
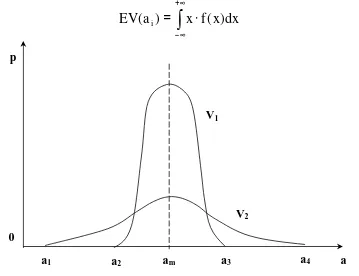
i (1.4.)In statistical decision theory, the mathematical expectation of the results is presented as the most important element of decision consolidation under risk. However the rigorous evaluation of decisional alternatives by using this indicator is influenced by the fact that it does not show all aspects of vulnerability reflected by a course of action. For example, in Figure 2 there are represented by probability distributions of two decisional alternatives -V1 and V2 –
V1
V2
p
0
[image:5.595.123.482.342.618.2]a1 a2 am a3 a4 a
that have the same mathematical expectations which means that being assessed by this criterion would have the same value. However it may be noticed that the [a2, a3] interval of the potential consequences of V1variant is much smaller than the [a1, a4] interval where the consequences can take values of variant V2. Moreover the V1 variant compared to V2 variant shows that the latter is more vulnerable to adverse developments with respect to a foreign environment but it can provide improved results in favorable conditions.
For a rigorous decision consolidation under conditions of risk it is necessary to use mathematical expectation of results combined with other indicators of uncertainty, especially with sizes that show the decisional consequences dispersion: the average square deviation, coefficient of variation, etc.
c) the average square deviation of the resuls (σσσσi) is a size that shows the degree in
which the consequences of the decisional alternatives (Vi) differ from the mathematical
expectation of their results. There are two methods of determining this indicator depending on the type of random variable that characrerises the decisional situation:
• When a discrete type random variable is used the average square deviation of the decisional variant results (Vi) is given by the following formula:
( )
[
]
∑
=
−
=
σ
r1 k
2 ik i k
i
p
EV
a
a
(1.5.)• When the decisional situation is characrerised by a continuous type random variable,
having spreading density f(x), the average square deviation of the decisional variant results (Vi) can be calculated by using the following formula:
∫
+∞∞ −
=
σ
ix
2f
(
x
)
dx
(1.6.)As an indicator of the decisional consequences dispersion, the average square deviation is a quantity which reflects an important aspect of uncertainty, being recommended in statistical decision theory to consolidate base decisions under risk. However in evaluating decisional alternatives, there should be taken into consideration that thips particular indicator reveals only the absolute dispersion and not the relative one of the results. The intricate method of calculating this size determines the managers to prefer simpler indicators for elaborating decisions under risk.
d) Coeficient of results variation (CVi) is an indicator that shows the relative
dispersion of the consequences of a decisional alternative (Vi). This size can be calculated by
relating the average square deviation to the results mathematical expectation:
)
a
(
EV
CV
i i i
σ
=
(1.7.)2. Economic risk management
Risk management and implicitly restricting the phenomena which disturb the activity of economic entities involve the consolidation of two additional sizes: one that can be quantified through the gravity level and financial consequences associated to risk (which allows economic entities, depending on the probability of risk occurrence to assess the possible damage), and the second size referring to the relationship between costs and risk management. Thus, once certain risks were identified they may be limited or eliminated only if certain protective measures are well founded. However, any measure, (insurance, establishment of special risk funds) involves an additional cost which increases the regular and mandatory costs. The two components of risk management, the complexity of the phenomena and the cost of risk represent the support for the diagnosis and implementation of some viable solutions in transformation of the size effects.
A simple model of analysis of the risk extent can be accomplished by using the following:
• variability – representing the size of damage, namely the gravity and size of
consequences that can be determined by damage causing phenomena.
• risk cost - assessing the size of probable and possible damage that an economic entity will
undertake, financially speaking;
• risk treatment - corresponding to the set of techniques that an economic entity will adopt
in the view of reducing consequences and risk cost implicitly.
Variability works together with the involved systems and the existing type of relations. The efectele are accomplished on different time horizons, hence their posibility of overlapping and interconditioning. When the risk associated losses are at a cost that cannot be financiallly supported by the economic entity the variability is at its maximum level. (figure 3).
Risk cost encompasses three elemenets:
• Expenses for investments and working solutions that aim at risk prevention and protection;
• Transfer expenses of risk effects upon third parties;
• Losses that cannot be avoided regardless the means employed by the entrepreneur or decisions he/she takes.
Cost
V
a
ri
a
b
il
it
y
Treatments
Treatment by transfer Variability limits (maximum possible
damage)
[image:7.595.125.469.434.641.2]Provisional treatments
Risk treatment is based on its assessment followed by capacity of the decision-maker to apply certain measures in order to place the company's activity within the limits of bearable cost and variability. The bearable cost term, represents for an economic entity the existence of a maximum limit beyond which management may have economic consequences that can not be supported (Figure 4).
[image:8.595.81.505.219.454.2]Therefore, the risk cost is the amount that can be risk ascribed. Moreover, if the subject of insurance is represented by risk insurance, the bearable cost involves taking into account and defining the cost levels required to pay the insurance premiums. Risk avoidance and its adverse effects on economic entities activity may be achieved through constructive activities that prevent and that involving certain specific expenses.
Figure 4. Risk dimension in comparison with frequency of occurence (variability)
Losses that determine the variability are reflected in economic entities activity divided into three categories three forms:
• Direct loss - loss of a part of the company assets, loss of interest areas;
• consecutive loss – lack of earnings as a result of some accidental stops, but repeated, occurring in a relatively short period of time;
• indirect loss - loss of reputation, of customers, loss of market.
Based on the two dimensions of bearable cost, it can be mentioned that variability does not have a specific value when the risk is covered by a voluntary or compulsory insurance.
The two dimensions of risk, namely variability and cost, outlines the risk management policy characteristics and specify the area where the economic entity is placed.
Being aware of the risk’s area of occurrence and action, and purely speculative, economic entities may decide to take some specific precautions and transfer.
Preventive activities are related to the activities referring to minimizing cost of risk under the circumstances of phenomena accomplishing of recurrence. They aim at reducing variability in the size of the consequences due to prevention activities of occurrence of such
EXPECTED RISK UNEXPECTED RISK
CATASTROFIC RISK
LOW MEDIUM BIG VERY BIG EXTREME
Risk’s dimensions
Ri
sk
’s
f
re
q
u
en
cy
o
f
o
cc
u
re
n
risks. Precautions measures will be effective only if the internal and external variability is known.
Therefore, the means of intervention in risk prevention are diverse and their application in the view of reducing costs is accomplished gradually. The means of control through prevention and protection, as a dynamic form of action against risk, are intended to reduce the possibilities of risk occurence due to preventive measures that ensure risk reduction and limit the loss volume that would occur even under conditions of risk.
Means of control through risk transfer are applicable in cases where risk has a higher level of tolerance allowed by the economic entity and can not be controlled by specific means of prevention or protection. In any event, the economic entity acts to transfer all or part of the third party risk based on contractual relations. The transfer operation accomplishes the risk variability transformation in cost by a transfer agent. To financial hedge risks, the conversion agent or risk takeover is, in most cases, the financial market and the takeover of pure risks is done by insurance companies.
According to some authors’ opinion, in order to quantify risk economic entities must identify those decisions that would ensure the company penalty at a lower level than the risk effects. Risk estimation and its effects can be accomplished only if the decision-makers are aware of the probability and extent of effects, timing and dynamics displayed. The criteria for classification and assessment of the effects are grouped according to three dimensions: •size (complexity, number of variables);
•importance (the time factor);
• probability (degree of uncertainty determined in a probabilistic way).
Figure 5 shows the possibility of occurrence of some particular series. Thus, in the G point the probability of an event occurrence is low, given that the size and significance of the effects is great. In section E future events may occur whose effects are of limited significance, but are of considerable size and with a high probability of occurrence.
To ensure a real assessment of the size of risk, especially in terms of comparability, it is necessary to convert on the equity bases the qualitative aspects in quantitative aspects. In
Probability
Importance Size
F(1; 0; 0) E(1; 1; 0)
A(0; 0; D(0; 1;
[image:9.595.85.467.421.709.2]B(0; 0; 1) C(0; 1; 0) G(1; 0; H(1; 1;
this respect we use different methods of aggregation: by using typical ladder „+.0.-” - for positive and negative influences.
The probability of effects accomplishment is provided by the system complexity that can develop the risk. It can be interpreted as "objective" when the observations are real and are based on statistical data obtained through observations in a period of time, or "subjective" if the effects come from the impossibility of complete knowledge of the phenomenon.
Out of the information presented so far it can be noticed that the risk issue is more complex than it appears at first sight thus without a multi criterion and multidisciplinary approach we cannot achieve a rigorous classification of the risk’s different facets displayed in the economic activity.
3. Risk factors specific to international economic relations
The international economic exchanges can be considered as the vital function of the macro-organism called global economy. The link between the entities that form the global economy and from which each national economy receives substances it needs (that can not produce by itself) is accomplished by the international trade.
The international trade occurred when some of the current national economic systems did not exist, others were in their early stages and has evolved with them, becoming more complex with increasing number of states, development and diversification of the economy. The states of the world unbalanced resource endowment is the determining factor the existence of international economic exchanges. The great differences between the participants in these exchanges, from climate and geographic location, social and psychological elements to the legislation and technology, generates the complexity of international trade.
Like any organization, the international trade may be as well affected by certain dysfunctions that may influence it either entirely or only constitutive parts or basic elements (economic entities, companies). The source of the most important failures that influence the economic entities, and the international trade implicitly are the risk that became reality.
Risks arise virtually in every phase of world trade, being the main enemy. The
negative influence of risk may be seen both as losses caused when they occur and as a psychological factor that hinder trade. The factors that generate risks in international economic relations are controllable factors, like unskilled human resources or even ill will and uncontrollable factors as wars, revolutions or natural disasters, etc.
Risks have evolved with the economic exchanges and have diversified on the extent
of develoipment under the economic aspect of human society, currently being an economic category of its own. Among the processes that have supported this trend we mention the
following: increase of volatility of economic variables, development of financial innovation,
external debt crisis of developing countries, development of alternative exposure techniques that approach insurance, the widespread use mathematical models to control risk .
4.1. Volatility increase of some economic variables
Beginning with the 70s of last century the approach of some risk categories witnessed significant changes as a result of the volatility increase of economic variables. The types of risks affected by this process included: currency risk, risks associated with price variation of raw materials, interest rate risk, the risk of ongoing actions, etc. The main events of the last century which influenced the volatility increase of the economic variables can be summarized by:
system of floating exchange rates that led to the accelerated increase of the exchange rate volatility. Under these circumstances, the results of some international transactions were risky to a great extent which led to granting a greater importance this type of risk when taking economic decisions. This brought about the development of a considerable number of techniques and control instruments of exchange rate risk.
b) Political developments in Asia and Africa, in particular the amplification process of decolonization, led however to the loss of control that some firms in developed countries had on raw materials exports bringing about the increase of their price volatility. A particular trend was registered on the world oil market where, on December 22, 1973, the Oil Exporting Countries decided to increase the oil barrel price, which remained stable for decades, from 3 to 12 U.S. $. This decision, whose effects became known as the "first oil shock”, brought about considerable difficulties for many businesses, from the entire world economy. In the following years, both the price of oil and the price of other raw materials often experienced abrupt fluctuations, which contributed to the granting of a special role in economic decision consolidation to the analysis of potential effects of raw materials price fluctuations.
c) In the years that followed the Second World War, in most countries having market economies, the keynesian monetary policies were applied, policies that had among their characteristics the maintaining, sometimes even forced, of the interest rates stability. The late 70's were marked however by the application of the neoliberal concepts in economic policies in many countries which had as a consequence the significant increase of the interest rates volatility. In the U.S.A., for instance, in 1979 the margin of federal funds rate fluctuation (the interbank market interest rate) was increased from 1.25 to 5%, decision that as caused significant fluctuations in the interest rates. This development brought about great difficulties for traders leading to the increased importance attributed to interest rate risk in the analysis of some credit and investment operations.
d) After the great crash of the New York Stock Exchange in October 1929 a long period of time followed when no shocks were recorded on the strong capital markets. On October 19, 1987 (day also known as the "Black Monday") but, on the same New York Stock Exchange, the Dow Jones fell by 22.6% (nearly two times more than on the "black Tuesday" of October 29, 1929 when the rates values decreased on average 12.8%) causing losses of nearly 500 billion dollars the in whole world economy. This new high crash triggered a chain reaction in the following days in other Western stock exchanges, where significant falls of share rates took place, this aspect revealing strong links between capital markets worldwide. These events contributed to the importance increase of the role of volatility analysis to base investment decisions in securities in the coming years.
Increased volatility of these variables was placed in an interdependence relationship with the weigh increase of some speculative operations on financial markets. By giving up to maintaining the stability of some rates, speculation flourished that frequenlty caused significant and unpredictable fluctuations of rates. Under these circumstances risk management importance associated to high volatility variables increased.
4.3. Foreigh debt crisis of the developing countries
At the beginning of the 80's, last century, as a result of the significant rise in interest rates for loans denominated in currencies Western countries, the debt crisis was triggered in developing countries. Most of the states had already experienced major difficulties arising from the increasing oil prices, and thus they ended up in the situation of being unable to reimburse the received loans. On August 11, 1982 the Mexican government announced the suspension of foreign debt payments, and it was shortly followed by other developing countries. The failure of paying back the loans created major problems to the creditor banks, some of them being on the brink of bankruptcy. This aspect increased the importance of risk management partnership within the credit operations.
4.4. Development of risk-treatment techniques alternative to insurance
Currently insurance is considered the most important method of treating risk exposure. To many managers, risk management boils down to mere signing an insurance contract. Some of this process drawbacks and especially a certain stiffness of security institutions to adapt to a changing business environment have made more companies to move to other methods of risk treatment in recent years.
Increasingly more large companies have been trying to make a proper image of the risks they face. Treating them as parts of a single portfolio, they expect to give up buying insurance policies to cover every potential loss. They hope to cover the risks by using as few or no insurance policy at all.
The result of taking risks into consideration in a business to cover other risks, were caused by the fact that insurance against certain risks (such as earthquakes) have become less necessary. This is terrible news for insurers of major categories of risks, which are about to lose more business. This has already happened in the traditional insurance field "properties
and damage" (P & C). Many large companies approach risks of P & C type internally, through
the so-called "self-insurance", instead of buying insurance policies. Most insurers are not innovative. Therefore they keep on losing their customers.
The problems of adjusting insurance institutions to new business developments considerable effects of the terrorist attacks of September 11, 2001 were added. Their magnitude made governors intervention necessary in the S.U.A. to rectify the insurance industry.
Moreover, after the terrorist attacks of September 11, 2001, the major insurance companies have either dropped to provide further protection against terrorist actions or they have requested large premiums for this, prohibitive for most businesses. The current decline in the insurance sector could determine many economic entities to move to other risk treatment techniques in the future.
4.5. Widespread use of mathematical models to control risk. The high complexity of transactions undertaken by some financial institutions and banks has made many of them to use mathematical models of risk management. Over the last decades several models have been developed (VAR model, model Delta, Black & Schools model, Garman & Kohlagen model, Cox model, Ross & Rubinstein etc.) which, by accomplishing an operational analysis of risk, enables a rapid response when conditions of the exposed operations change unexpectedly.
have arisen in particular on the financial markets during 1997 and 1998 when many financial institutions engaged in investment recorded significant losses.
Currently companies try to work out these deficiencies. More power is now being granted to risk management departments. Moreover, several large investment banks will rely less on models and more on the skills of the professionals to assess markets in the future. They will have to be able to answer the question "what would happen if our assumptions were wrong?".
The financial crisis of 1997 and 1998 showed that the mathematical models of risk management, no matter how sophisticated they were, should not be considered infallible. This aspect derives from the inability to capture in a single model of all factors of influence on the processes studied. In certain circumstances, as happened in the period 1997-1998, just the neglected aspects in the mathematical model could have a considerable influence on the exposed operations. However, despite this limit, mathematical modeling remains an essential process in managing risks associated with financial transactions that requires a special efficiency.
5. Specific risk factors of foreign trade with agricultural products that operate in the area of demand for agro alimentary products
Gradual liberalization of agricultural markets under the impact of the Uruguay Agreement on Agriculture (1994), the increase of agricultural competitiveness and rigorous quality control and health of agricultural products require taking into consideration of all risk factors that may affect the progress of agricultural and food trade between two or more national economic systems.
The first step towards identifying the risk factors that occur in the global trade of agricultural products is to define its main dimensions. We distinguish five dimensions, namely: •demand for agricultural products;
•supply of foodstuffs;
• analysis of markets where the agricultural and food products are quoted and traded; •conduct of the transaction itself;
• systemic restrictions.
a) The demographic increase is the first risk factor that influences the demand. World's population has experienced an explosive growth over the past 130 years, from several hundred million in 1870 to over 5.5 billion people today. Demographic forecasts show a total of 8.2 billion people in 2030 (FAOSTAT Source), or reach of a threshold of 11.5 billion people in the period 2030-2040 (Source: UN). The accelerated growth of population creates a constant pressure on agricultural and food products consumption. Therefore, in terms of agricultural production sale a high level of demand will be recorded in the near future.
b) Increase of urbanization level over the last 30 years was another factor that has influenced consumption and therefore food products trade. According to World Bank reports, the world's urban population increased from 34% in 1960 to 46% in 1998, representing a total of 3.4 billion people currently working in urban areas. Forecasts show that in 2020, the urban population will be around 4 billion people in developing countries if the increase pace of 3% is maintained for the these countries in recent years. Developed countries have only 20% of urban population of the world, but their growth rate will be below 1% per year.
In the following two decades urbanization will have a significant impact by the changes involved in the structure of food consumption, on agricultural markets, world trade and food consumption.
c) Consumers’ lifestyle is a risk factor that influences on a great extent the demand for agricultural products. The lifestyle of consumers is different from country to another and has formed after interaction with the traditions, customs, cuisine features accumulated over the centuries, following developments in various social and historical conditions. In some countries and economic areas, the current consumption of potatoes, cereals, rice leads to a constant demand for these categories of products. The specific culture of each nation determined the existence of certain holidays that have a special importance for each nation separately, which involves the organization of some traditional meals. Thus, at certain times of the year, the consumption of certain categories of agricultural products increases significantly. The behavior of the food consumer is characterized by certain nuances and particularities from one state to another and from one region to another.
d) Consumers’ preferences are also different depending on the age and determine a specific consumption of food. In the U.S. young people prefer meat products with higher calories intake, while the older population is interested in fruit, vegetables and juices. The existence of certain diseases in a significant number of people, and also of a pattern of beauty caused a specific diet (diet) to induce certain features to the demand for agricultural products. Moreover, the consumption in public locations like "fast food" and in restaurants has become a commonplace in contemporary times.
e) Women’s change of status in the society over the past 50 years has brought about some considerable changes on consumption. The transition from the housewife to the status of employee involved the demand adaptation to these new conditions that is weigh increase of products in various stages of processing and in final stage (ready prepared), over the last 50 years.
f) The existence of substitutes for a particular commodity and its degree of substitution influences directly the food consumption. If butter can be replaced by substitutes (like margarine), for bread we can not find a substitute. Thus, depending on the degree of substitution of a product, the agricultural products trade can move in one direction or another. Elasticity of demand can classify a product according to the percentage of consumers that are expected to give up buying it for another product if the price increases.
g) Transport technologies represent another factor that influence directly the global trade in agricultural goods. Perishability is a characteristic of agricultural products, which directly affects the supply of agricultural and food products that are on the market at a given time. Maintaining the quality of vegetable products in the circuit of processing (the time of harvest and up to industrial or biological product), but also the storage conditions and its marketing. Cereals have a greater resistance to various operational processes (handling, transport) and can be kept for a long period with relatively low losses. Vegetables and fruits can be kept less time than cereals and the process requirements are higher, resulting in additional costs. If the products of animal nature, the qualitative depreciations arise mainly due to microbiological changes that are recorded during the storage and can lead to loss of high added value. In this context, reducing delivery time, by maintaining the product quality, by reducing transport costs, advanced transport technologies are regarded as a contributing factor of global trade in agricultural products. They have a direct influence on trade flows by the weigh increase of non-bulk goods at the expense of bulk goods that are transported and sold on world markets (including by raising the degree of marketing for perishable products).
the 21st century will accelerate the consolidation of economic groups by forming new alliances on the regional and subregional levels. The main feature of this century will be the transition from a bipolar world to a multipolar world, due to acceleration of the technological transfer and financial markets globalization.
5. Conclusions
As a rule, risk and uncertainty are analyzed compared with certainty. Better safety may be associated with certainty and forecast with risk or uncertainty. The risk derives from uncertainty. From a formal point of view, the state of certainty is considered to designate the cases where expectations regarding the future flows are unique or do not vary significantly. The risk term is used to refer to future situations in which expectations are not unique, but it helps to assess the possible solutions for each variant.
If the risk can be associated with danger, uncertainty may display a negative component, either a positive component generated by unpredictable favorable states. In this case, the negative component is associated with risk.
Any activity or economic effort is based on a number of unknown and uncertain factors or possibilities, simply because its subject is located in the future. Once we have accepted the size of real time, we may try to turn any future event into a possible one, but we can not control with certainty. An area of uncertainty will always persist because of the fundamental impossibility of predicting all the elements that make up the environment when in real-time the evolution and dynamics are accepted as real life. The imperfect market systems and therefore uncertain and risky, represent an important pillar for a properly functioning economy.
References
Chorafas Dimitris - “Managing Risk in the New Economy”, New York Institute of Finance, Prentice Hall, 2001
Co ea Mircea - „Evaluarea riscurilor: Metode i tehnici de analiză la nivel micro i macroeconomic”, Editura Lux Libris, Bra ov, 1997
Gherasim Alexandru - „Dimensiunile riscului”, Tribuna Economică nr. 45, 1995 Hâncu Daniela - Models for founding decisions”, Chapter 2, Decision methods viewed in the light of traditional decision theory, Editura ASE, Bucure ti, 2002
Nistor Costel - Gestiunea riscului în relaţiile economice internaţionale, Editura Didactică i Pedagogică, Bucure ti, 2005
Raţiu Suciu Camelia - Modelarea i simularea proceselor economice, Editura Didactică i Pedagogică, Bucure ti, 1997