Munich Personal RePEc Archive
Bankruptcy prediction: a comparison of
some statistical and machine learning
techniques
Pena Centeno, Tonatiuh and Martinez Jaramillo, Serafin and
Abudu, Bolanle
Banco de Mexico, University of Essex
December 2009
Banco de M´
exico
Documentos de Investigaci´
on
Banco de M´
exico
Working Papers
N
◦2009-18
Bankruptcy Prediction: A Comparison of Some
Statistical and Machine Learning Techniques
Tonatiuh Pe˜
na
Seraf´ın Mart´ınez
Banco de M´exico Banco de M´exico
Bolanle Abudu
University of Essex
December, 2009
La serie de Documentos de Investigaci´on del Banco de M´exico divulga resultados preliminares de trabajos de investigaci´on econ´omica realizados en el Banco de M´exico con la finalidad de propiciar el intercambio y debate de ideas. El contenido de los Documentos de Investigaci´on, as´ı como las conclusiones que de ellos se derivan, son responsabilidad exclusiva de los autores y no reflejan necesariamente las del Banco de M´exico.
Documento de Investigaci´on Working Paper
2009-18 2009-18
Bankruptcy Prediction: A Comparison of Some
Statistical and Machine Learning Techniques
*Tonatiuh Pe˜na† Seraf´ın Mart´ınez‡
Banco de M´exico Banco de M´exico
Bolanle Abudu§
University of Essex
Abstract
We are interested in forecasting bankruptcies in a probabilistic way. Specifically, we com-pare the classification performance of several statistical and machine-learning techniques, namely discriminant analysis (Altman’s Z-score), logistic regression, least-squares support vector machines and different instances of Gaussian processes (GP’s) -that is GP’s classifiers, Bayesian Fisher discriminant and Warped GP’s. Our contribution to the field of computa-tional finance is to introduce GP’s as a potentially competitive probabilistic framework for bankruptcy prediction. Data from the repository of information of the US Federal Deposit Insurance Corporation is used to test the predictions.
Keywords: Bankruptcy prediction, Artificial intelligence, Supervised learning, Gaussian processes, Z-score.
JEL Classification: C11, C14, C45.
Resumen
Estamos interesados en predecir bancarrotas de una forma probabil´ıstica. En espec´ıfico, comparamos el desempe˜no de varias t´ecnicas estad´ısticas de clasificaci´on y de aprendizaje supervisado, ellas son: an´alisis de discriminantes (Z-score de Altman), regresi´on log´ıstica, m´aquinas de soporte vectorial de m´ınimos cuadrados y diferentes instancias de Procesos Gaussianos (GP’s) – estos son los GP’s para clasificaci´on, el discriminante Bayesiano de Fisher y los GP’s deformados. Nuestra aportaci´on al campo de las finanzas computacionales consiste en introducir a los GP’s como un marco potencialmente competitivo para predecir bancarrota. Datos provenientes del Seguro de Dep´osito de los Estados Unidos son usados para probar la calidad de las predicciones.
Palabras Clave: Predicci´on de bancarrota, Inteligencia artificial, Aprendizaje supervisado, Procesos Gaussianos, Z-Score.
*We thank Jos´e A. Murillo, Fabrizio L´opez-Gallo and Pascual O’Dogherty for providing support to carry
out this work and also Santiago Garc´ıa and Enrique Covarrubias for helpful comments. Antonio Noriega and Roc´ıo Elizondo kindly provided editorial support.
1
Introduction
Corporate bankruptcy is an active area of financial research because an event of this nature will always provoke adverse effects on the economy and pose a credibility challenge to financial authorities. In fact, the forecast of bankruptcies is a subject of paramount importance for different types of governmental and commercial organisations because a failed corporation can cause contagious failures to the rest of the financial system and thus lead to a systemic crisis. Such importance has been further increased by regulations such as the the Basel Committee on Banking Supervision (2004) or Basel II, which suggests financial institutions to build their credit portfolios based on the default assessment of their clients. As a consequence, the development of analytical tools to determine which financial information is more relevant to predict financial distress has gained popularity along with the design of early warning systems that predict bankruptcy.
Along the years two main methodologies have been developed to assist in the process of estimating financial distress (i.e. predicting bankruptcies): the first one uses accounting infor-mation while the second one, market inforinfor-mation. Among the former, financial ratio analysis is a technique that studies relations of the type X/Y where X, Y ∈ R are variables selected from an enterprise’s financial statement. Although there is no consensus for defining or cal-culating financial ratios we can still divide them into four categories: efficiency, profitability, short term and long term solvency ratios. The seminal work on prediction of corporate failure through financial ratio analysis was proposed by Beaver (1966) and it can be thought of as a univariate classification technique to estimate the probability of failure. Subsequently Altman (1968) worked on a generalisation through the estimation of a multivariate statistic known as Z-score.
While these two methods have proved useful for the last forty years, the advent of new regulations such as Basel II justifies the use of more sophisticated techniques to predict fi-nancial distress. Among such novel methodologies a group with an important computational component has been recently developed. For example the problems of asset valuation, port-folio allocation and bankruptcy prediction have been approached from different perspectives, like genetic algorithms (GA’s), artificial neural networks (ANN’s), decision trees, among oth-ers. We will use the term computational finance (Tsang and Martinez-Jaramillo, 2004, Chen, 2002) to refer to the development and application of these type of techniques to solve financial problems and some literature on the topic can be found at (Serrano-Cinca et al., 1993, Back et al., 1996, Joos et al., 1998, Varetto, 1998, Atiya, 2001, Shin and Lee, 2002, Park and Han, 2002, Yip, 2003, Quintana et al., 2007).
perspective, GP’s provide a natural way for learning a regression or classification function in terms of functional priors and some very good monographs on the topic have been written in recent years with (Rasmussen and Williams, 2006) as an example. Our work makes a contribution to the field by presenting a comparison of classical statistical techniques for classification against some recently developed machine learning algorithms. More specifically, we introduce GP’s as a potentially powerful and competitive probabilistic framework for bankruptcy prediction. As an added bonus of working within the realm of GP’s, we come up with a feature that allows to determine the relevance of the different financial ratios in an automatic way, something known as automatic relevance determination (ARD) in the neural networks literature.
Although the methods presented here are applicable to any type of company that handles financial ratios, data availability made us focus on the banking sector1
. Analysing bankrupt-cies in the banking sector implies taking into account that this type of institutions must satisfy very specific legal and accounting requirements imposed to them by financial authorities, so it is adequate to take them as a special case within the universe of corporate bankruptcy. In fact generalising this task to different countries is made even more difficult when we consider that some of their own regulations do not contemplate the existence of bankruptcies.
The rest of the paper is organized as follows: Section 2 introduces bankruptcy prediction as a statistical classification problem. Sections 3 and 4 are devoted to the description of some well-known statistical techniques used for bankruptcy prediction, namely discriminant analysis and logistic regression. Section 5 describes the technical details of how a family of stochastic processes, i.e. Gaussian ones, might be used to classify data and therefore applied to our problem domain. Section 6 describes experiments carried out on a set of data from the Federal deposit insurance corporation in order to assess how Gaussian processes fare with respect to the other type of classifiers. Section 7 is a discussion about how GP’s could be integrated into commercially available credit risk models. Finally Section 8 draws some conclusions about the proposed methods and outlines future work.
2
Bankruptcy prediction as a classification problem
We are interested in forecasting the failure of banks and also on assigning a probability value to quantify our degree of belief that this event will happen. In order to do so, we approach the bankruptcy prediction problem as a binary classification one, where each instance of a set of observed data belongs to a group of predefined classes (bankrupt or non-bankrupt) and the objective is to try to separate one class from the other with the minimum amount of
1
error. Thus we aim to have a system that predicts whether an institution will go bankrupt or not according to some type of financial information, for example through the institution’s financial ratios. This type of task is known as classification to the statistics community and supervised learning to the machine learning one.
In the next two sections we review some of the most widespread methods for data classifi-cation, among them Fisher’s discriminant analysis and logistic regression. Therefore, in order to introduce the discussion, we will assume the following: (i) a classification task whereby a new observation O⋆ needs to be allocated to one of k available classes that are known a priori; (ii) that such classes are mutually exclusive; (iii) that for some reason the allocation procedure depends on the application of an indirect method. By indirect we mean that a vector of featuresx⋆ is used instead ofO⋆. We will assume the availability of correctly labeled
training data and consequently that an exact way to classify the observations exists, but that for some reason is not feasible to apply. For example, medical diagnosis (identifying a dis-ease) and prognosis (estimating the prospect of recovery) are typical examples where direct classification is not feasible to apply, (MacLachlan, 1991).
Another suitable case for indirect classification is the determination of the level of financial stress of a corporation because a straightforward assessment is impossible to produce; that is, a company’s financial soundness simply cannot be ascertained from a direct checkup. Instead it is more appropriate to resort to indirect means, like the corporation’s financial ratios to determine whether it will go bankrupt or not.
A common approach to apply this strategy relies on the retrieval of the observed financial ratios of a number N of companies along a window of time T; where the financial ratio of each bank is denoted by a vector xn,t; with subindex n ∈ {1, N} denoting the bank and
t ∈ {1, T}, the time when data was observed. Because bankruptcies are rare to repeat, the data is usually considered time-invariant and therefore such dependency is dropped; in other words the following assumption is made xn,t = xn, which basically consists of making data
3
Fisher’s Discriminant analysis
Discriminant analysis is a popular classification technique devised by Fisher (1936) with the aim of solving a bone classification problem that he was requested to address2
. This technique is concerned with the relationship between a set of data and their corresponding labels values (MacLachlan, 1991) and its goal is to specify this relationship in terms of a function that ideally separates each instance of the training data according to their label. In the remainder of the paper we will refer to discriminant analysis as FDA. In this section we briefly review FDA for the specific case of binary classification and in such a way that lays the ground for the introduction of logistic regression and Gaussian processes for classification. We concentrate on discriminant analysis because it forms the basis of Altman’s Z-score, which is one of the best well-known techniques to assess financial distress.
3.1
Problem setup
Consider a set of training data D = (X,y) =
x(n), y(n) N
n=1 and denote by x
(n) a single
observation in a d-dimensional space and by y(n) ∈ {1,0}, the categorical variable or label
assigned to the observation. An observationx(n) consists of the set of financial ratios recorded at a fixed point in time for a given bank n, which was at that time either bankrupt or not, i.e. y(n). Mathematically, the aim of discriminant analysis is to assign a new observation O⋆
into one of the k = 2 available classes and the discriminant will do so by finding a vector of parameters w that will be optimal in some sense. In fact, the space Rd will be divided into
k regions by hyperplanes inRd−1 to do the separation.
The process is best explained in a pictorial way. Figure 1 shows a dataset composed of two classes being separated by a discriminant functionD(w)perpendicular tow. Each data point
x(n)is projected over w, such that the distance between the projected means d= (µ0−µ1)is
as wide as possible while the scatter around the projections (σ2
0 +σ12) is as small as possible
as well. The projection is achieved by taking the dot product f(n) = wTx(n) (∀n), thus the
quality of the solution depends on the tilt of the vector w. Observe that a classifier might be obtained by verifying the sign of the projected points with respect to D(w), i.e. assign every instance on D(w)≥0 to class1 and to class 0otherwise. Posterior class probabilities
p(C1|x)and p(C0|x) = 1−p(C1|x), may also be derived by assuming the projections come
from Gaussian densities.
Under this setting, Fisher (1936) was the first to conclude that the vector w is given by maximising the ratio of between to within-class variances,
2
x
1x
2−6
−4
−2
0
1
2
3
4
5
6
−
6
−
4
−
2
0
1
2
3
4
5
6
Class 1
Class 0
m
1m
0σ
1σ
0µ
1µ
0w
D
(
w
)
=
0
[image:8.612.106.487.208.565.2]f
(
n)
x
(
n)
Figure 1: Fisher discriminant analysis example. Two clusters of data being projected onto the direction of discrimination w. Members of each class are represented as ‘pluses’ or ‘dots’. The quality of the discriminant depends on the separation between the projected class means µ0 and µ1
J = (µ1−µ0)
2
σ2 1 +σ02
. (1)
Where we have used the subindex q = {0,1} to denote instances belonging to either of the classes. Given that
µq =
X
n∈q 1
Nq
wTx(qn)
and
σ2q =X n∈q
1
Nq
wTx(qn)−µq
2
,
coefficient J can be expressed in terms ofw and with some straightforward manipulation we arrive to
J(w) = w TΣ
Bw wTΣ
ww
, (2)
where the matrices
ΣB = (m1−m0) (m1−m0)T
and
Σw =
X
q∈{0,1}
Nq
X
n=1
x(qn)−mq
x(qn)−mq
T
are known as between and within-class covariance matrices, respectively. A solution to the discriminant problem consists of taking the derivative of Equation 2 w.r.t. w and solving. Zeroing the gradient and through some re-arrangement we get
ˆ
w ∝ Σ−w1(m0−m1), (3)
which is the expression we were looking for.
Therefore class predictions for new observationsx⋆ are readily available by projecting the data point over the estimated direction of discrimination wˆ and verifying the sign of the projection, i.e.
f⋆ = ˆwTx⋆+b ≥D( ˆw) ; (4)
4
Discriminative models for classification
We now focus our attention on probabilistic methods for classification. That is, we want predictions on data to take directly the form of class probabilities and not of values that need a post processing stage to be interpreted as such, as it happens with FDA. We first observe that classification problems might be addressed in similar terms to those of standard regression, that is by explicitly specifying a likelihood function (or cost function) that models the data generation process of the observations one can proceed with parameter estimation through the application of techniques such as maximum likelihood. In this section we introduce logistic regression, which is probably one of the most popular probabilistic methods for classification.
4.1
Logistic regression
Going back to the allocation problem of Section 2, we still want to make a class assignment for observation O and the most natural approach is to consider xandy as random variables and work with the joint densityp(x, y)that arises from them.3
Applying the rules of probability, the joint can be factorised as p(x|y)p(y) or as p(y|x)p(x) and from these representations stem the two different approaches for probabilistic data classification. The first approach is usually referred to asgenerative because it models the data generating process in terms of the class conditional density p(x|y), which combined with the class prior p(y) allows to obtain the posterior
p(y|x) = p(x|y)p(y)
p(x|y= 1)p(y= 1) +p(x|y = 0)p(y = 0) .
The second approach is calleddiscriminative because it focuses on modelling p(y|x)directly and will be the one we will concentrate on in this paper. In both the generative and discrim-inative approaches it is necessary to make modelling assumptions, for example deciding what type of density to use for representing p(x|y) orp(y|x).
A straightforward way to obtain a discriminative classifier is to convert the output of a regression function into the class probability being sought, for example by applying a response function.4
That is consider a regression function f(·) whose domain is (−∞,∞) then by ‘squashing’ it into the range [0,1]we will have obtained the desired classifier. An example is the logistic regression model
p(y= 1|x) = g wTφ(x)
, (5)
3
We recall thatxis a vector of observed features obtained through indirect means whereasyis a canonical variable representing the class.
4
whose response function is
g(z) = 1
1 + exp (−z). (6)
Note that (5) is a combination of a linear model, parameterised by w, a basis function φ(·)
and the logistic response function g. An alternative function is the cumulative Gaussian
g(z) = ´∞
−∞N (x|0,1)dx which produces what is known as a probit model.
Given a training set D = (X,y), with y(n) ∈ {1,0}, we can use the problem setup of
Section 3 to interpret how a logistic regression works. We can think back again that the goal is to find a vector of weights, such that the projections of data over it will be separated maximally according to a specified criterion. However, the criterion will not be Rayleigh’s quotient (1) anymore but rather the likelihood function (5) and therefore a new optimisation problem will arise,
ˆ
w = −arg min w
lnp(y|X,w)
= −arg min w
N
X
n=1
{ynlnσ(a
n) + (1−yn) ln (1−σ(an))},
(7)
where an =wTx(n).
An estimate forwˆ may be obtained through numeric methods (Bishop, 2006). In contrast with FDA, predictions are available by feeding the estimate wˆ and the test point x⋆ into the logistic function (6) and this time a probability of class-membership will be automatically produced. Suppose that the basisφ(·)is the identity, the probability becomesp(y⋆ = 1|x⋆) =
g wˆTx⋆
.
5
Gaussian processes for regression and classification
Gaussian processes (GP’s) are a generalisation of multivariate Gaussian densities to infinite continuous function sets (Rasmussen, 2004) and have been used for data inference tasks for at least one hundred years; for example Thiele (1903) was one of the earliest proponents. However modern applications of GP’s began with the work of mining engineer Krige (1966) and later with that of Kimeldorf and Wahba (1970), O’Hagan (1978) and Wahba (1990). The term process is used to refer to a collection of indexed random variables
f(1), . . . , f(N)
that (i) can be defined through a common probability density, in this case a Gaussian, and (ii) that satisfies some consistency and permutation properties; see (Grimmett and Stirzaker, 2004) for a definition of a consistent process.
processes offer the advantage of flexible modelling without the overhead of having to adapt a large number of parameters, something that has commonly hindered the application of ANN’s in many problem domains. Some work of computational finance that specifically addresses bankruptcy prediction in terms of ANN’s is (Atiya, 2001).
In this section we discuss linear regression and its complementary approach, GP regres-sion, both from a Bayesian perspective. In fact, it can be shown that both approaches are equivalent but that under certain circumstances it is more convenient to apply one over the other. The ensuing discussion will enable the introduction of some different guises of GP’s for data classification: Gaussian process classifiers, least-squares support vector machines, among others. The Bayesian approach to linear regression is discussed in texts like (Box and Tiao, 1973) for example, whereas GP regression in more modern ones like (Mackay, 2003, Rasmussen and Williams, 2006).
5.1
Bayesian linear regression: the parameter space approach
The following discussion in mostly based on (Williams, 1999). Let us consider what may be called generalised linear regression because we will be using a fixed set of basis functions
{φi(x)}mi=1. Suppose then a set of training dataD=
x(n), t(n) N
n=1, an underlying function
f, which we are interested to infer and that inputs and targets are related in a linear way through t(n) =f(n)+ǫ; with f(n) =wTφ x(n)
and ǫ ∼ N(0, σ2
v). Then an embodiment of
the information extracted from the data will be given by the posterior distribution over the parameters w, which is expressed in terms of Bayes’ rule as
p(w| D) = p(D|w)p(w)
p(D) ; (8)
wherep(D|w)is known as the likelihood function and p(w)as the prior. If observations are i.i.d.5
the likelihood may very well be represented by t(n)∼ N wTφ x(n)
, σ2
v
, whereas the prior as w ∼ N(0,Σwt). Under such assumptions it is very easy to show that the posterior will take the form
p(w| D) =N(wM AP,Ar),
where the mean vector
wM AP =βA−r1Φ
Tt
, (9)
and the covariance matrix Ar =Σ−wt1+βΦTΦ, withΦbeing the so-called design matrix and
β = 1/σ2
v the precision. We remark that the posterior covarianceAr is an m×m matrix.
From a data modelling perspective, the ultimate purpose is not to derive the posterior
5
distribution but rather make predictionsf⋆ for unobserved datax⋆, which in the present case
is done by evaluating
p(f⋆| D) =
ˆ
p(f⋆| D,w)p(w| D)∂w = N f¯⋆,(σ⋆)2
.
(10)
Note that the above integral is a weighted average of conditional expectations over the pos-terior6
. Expressions for the mean and variance are given by
¯
f⋆ = wT
M APφ(x
⋆) (11)
and
σ2
f(x⋆) = φ(x⋆) T
A−r1 φ(x⋆), (12)
respectively. Regarding the mean result, if we consider a classification setting, it is straight-forward to show wM AP (9) is equivalent to wˆF DA (3) by simply clamping the targets to the
label values (Bishop, 1995). It should be noted that in order to obtain the predictive variance
vart(x⋆)it is necessary to addσ2
v toσf2(x⋆)to account for the additional variance due to the
noise, since the two sources of variation are uncorrelated (Williams, 1999).
5.2
Gaussian processes for regression: the function space approach
In the previous section we saw how the uncertainty in a typical regression problem was described in terms of a probability distribution over the parameters w. It is also possible to deal directly with uncertainty with respect to the function values at the points we are interested in and this is the function-space (or GP) view of the problem, as stated by Williams (1999). The key point for departing from the parameter-based approach for data modelling is to realise the projections f(n)’s can also be treated as random variables. Specifically, by
assuming a finite instantiation f =
f(1), . . . , f(N)T
defined in a consistent way we will have a random process, which will be a GP, if f is described by a multivariate Gaussian density (Mackay, 1998).
In particular, we will assume that every f(n) depends on an input x(n) with index n,
such that f(n) =f x(n)
. Note this definition implies that parameterising the f’s with w is irrelevant for the modelling process. Nevertheless, the justification of the GP assumption is supported by the fact that placing a Gaussian prior over the parameterswinduces a Gaussian prior distribution over the set of instantiations f, provided that f is a linear function of w.
Thus assuming training data D has been observed, a posterior distribution will need to 6
be inferred in similar terms to those of Section 5.1. Regarding the specification of a prior of the GP type, it will be defined by a mean function m(x) and a covariance functionk(x,x′). In other words p(f) = N (0,K) with matrix K ∈ RN×N populated with entries of the form
k(xi,xj)∀i, j. If the likelihoodp(D|f)is Gaussian, that is if Dis composed by a set of noisy
observations t(n) = f(n)+ǫ, with ǫ ∼ N(0, σ2
v), it can be shown that application of Bayes’
rule will lead to
p(f| D) ∝ p(D|f)p(f)
= N K σv2I+K−1t, σv2 σv2I+K−1K, (13)
where vector f =
f x(1)
, . . . , f x(N)T
and t=
t(1), . . . , t(N)T
, (Seeger, 2004). The pos-terior distribution is thus influenced by the prior and this is ascertained in (13) by observing that posterior mean and covariance depend on the matrix K, which is the prior covariance.
So far, the posterior over the training datap(f| D)has been inferred but the most impor-tant task is to predict test points. This only requires that once we observe D we determine the posterior predictive distribution for a point f⋆ =f(x⋆), that is outside the training set.
This is readily done by applying
p(f⋆| D) =
ˆ
p(f⋆|f)p(f| D)∂f.
= Nk(x⋆)T K+σv2I−1
t, k(x⋆,x⋆) +k(x⋆)T,
(K+σ2
vI)
−1
k(x⋆)
(14)
where the vectork(x⋆)∈RN×1 is filled with scalars of the formk x(n),x⋆
, forn= 1, . . . , N. We remit the avid reader to (Williams, 1999) for a demonstration of the equivalence of the results (10) and (14).
Given that the weight and function space view are equivalent, it is worth asking which one is more convenient to apply. From a computational perspective, both approaches rely on a matrix inversion, which in the weight-space approach is that ofAr, an m×mmatrix (Section
5.1); whereas in the function space it is that ofK+σ2
vI, anN×N matrix. In general, for many
types of regression, m ≪ N and the weight space approach will be preferred. However for certain types of linear prediction, mwill be infinite and the only possible approach will be the function-space view. Recall the computational complexity of inverting a matrix M ∈Rℓ×ℓ is O(ℓ3), where ℓ is the number of rows (Golub and Van Loan, 1996). Further insights into the
−15 −10 −5 0 5 10 15 −1.5
−1 −0.5 0 0.5 1 1.5 2
(a) Prior
−15 −10 −5 0 5 10 15
−2 −1.5 −1 −0.5 0 0.5 1 1.5
[image:15.612.94.682.158.398.2](b) Posterior
Figure 2: This figure shows 3 samples taken from prior and posterior GP’s. (a) Samples from a priorp(f) = N(0,K). (b) Given some training dataD, the plot shows samples taken from the posterior p(f⋆| D)of Equation 14. In both plots an RBF covariance (15) was used to compute matrix K. Note that in (b) the functions continue to be smooth, but this time are pinned down by the observed points.
5.2.1 The covariance function
Most applications of GP’s assume the mean function m(x) is centred around 0, so the core of the formalism lies in the type of covariance function being used. Therefore it is worth analysing some of their features, for example in this work we only use isotropic functions of the form k(x,x′) = k(r), with r = kx−x′k. In isotropic covariances, the correlation between observations is independent of their absolute position; only their difference in terms of a norm counts. For example, by taking an Euclidean norm we ensure that points xand x′
lying close to each other will give rise to high correlation, therefore making f(x) and f(x′) close to each other as well. An example of an isotropic covariance we use is
k(f(xi), f(xj)) = k(xi,xj) = θ
1exp
−θ2 2 ||x
i−xj||2
(15)
also known as RBF or radial basis function covariance. The parameters Θk ={θ1, θ2} adjust
the scale and the width of the radial function, which in this case is a Gaussian. The inverse of θ2 is also known as the bandwidth parameter σ.
In order to compare how prior and posterior GP’s are affected by the choice of covariance function, Figure 2 shows samples from both of them, the former is defined asp(f) =N (0,K)
and the latter asp(f⋆| D), specified in Equation 14. An RBF covariance (15) was used to take
the samples. In plot (a) the functions can take up any shape, provided that they are smooth, whereas in plot (b), the functions must also be smooth but are pinned down by the observed points. In both cases, the bandwidth of the RBF was adjusted tologθ2 = logσ−1 =−2.3026.
5.3
Gaussian processes for classification
We can think of GP regression as a generalisation of the more well-known Bayesian linear one and in similar terms, GP classification can be thought of as a generalisation of logistic regression. Recall that in Section 4 the activation of the logistic function was given by a = wTφ(x), thus following a similar rationale to that of the previous section, a Gaussian process
may allow to non-linearise the function a by working directly over the space of functions. Thus by considering a collection of latent variables an for n ∈ {1, N}, we can replace the
linear models wTφ x(n) by a Gaussian process f. Furthermore, given an observationx⋆ we are interested in determining its probability of class membership π(x⋆) = p(y= 1|x⋆) =
σ(f(x⋆)). The inference process is performed in an analogue way to the one previously
described, thus the distribution over f⋆ is computed as
p(f⋆| D) =
ˆ
wherep(f| D)∝p(D|f)p(f)is the posterior obtained through the application of Bayes’ rule. However, in contrast to the regression case of Section 5.2, the noise model that needs to be specified is that for classification, i.e. a Bernoulli distribution of the form
p(D|f) = N
Y
n=1
σ(fn)ynh1−σ(fn)(1−yn)i . (17)
This density is equivalent to that presented as an argument in the optimisation problem of Equation 7, but with parameterisations of the form wTφ(x)replaced by f’s.
The posterior (16) is used subsequently to estimate a probabilistic prediction of the class label, that is
π⋆ = p(y⋆ = 1| D,x⋆) =
ˆ
p(y⋆|f⋆)p(f⋆| D)∂f⋆. (18)
Both integrals (16) and (18) are not analytically tractable and thus have to be computed in an approximate way. However, whereas Equation 16 is usually computed through stochas-tic methods, such as Markov Chain Monte Carlo or determinisstochas-tic approaches like Laplace approximation or variational inference; Equation 18 being one dimensional can be evaluated through standard numeric techniques like quadrature. More references Gaussian processes for classification, or GPC’s, can be found at (Williams and Barber, 1998).
5.4
Some other types of GP’s
Perhaps the most straightforward approximation method is to make a quadratic expansion around the mode of the posterior p(f| D)and this is commonly referred as Laplace approxi-mation. However, it has been proved by several authors (e.g. Minka, 2001) that such types of approximation many times fail to capture the true nature of the distribution, thus producing bad predictive results. Several alternative methods exist in the literature, with one of them approximating the modes of the Bernoulli likelihood p(D|f) with Gaussian densities. This method yields a classifier with comparable properties to those of FDA and, as shown by Peña Centeno and Lawrence (2006), can produce competitive results in some problem domains. In the subsequent we will refer to this method as Bayesian Fisher Discriminant (BFD).
Finally, one of the main drawbacks of applying GP regression stems from the fact that it assumes Gaussian noise and unfortunately most problem domains do not show this char-acteristic. Snelson et al. (2003) generalised the GP framework for regression by learning a non-linear transformation of the outputs, so that non-Gaussian noise could still be modelled with a GP. As he mentions, the generalisation consists of learning a GP regressor in latent space and simultaneously a transformation or warping space for the outputs; in this way other types of noise are accounted for. This strategy will be termed warped Gaussian processes or WGP’s.
These three methods (BFD, LS-SVM and WGP’s) are just a set of algorithmic tools that have been developed by the machine learning community to solve regression and classification problems. In Section 6 we will go back to them and test their effectiveness on the problem of classifying a real dataset.
5.5
Adaptation of hyperparameters
In all the GP-based methods presented, it is only after a solution for the posterior predictive distribution p(f⋆| D) has been obtained that the issue of setting the hyperparameters Θ
k
of the covariance function can be addressed. Bayesian methodology dictates that these pa-rameters should be set in a hierarchical way, however the conditional parameter distributions arising from a covariance of the type in (15) are not amenable to Gibbs sampling. Thus practi-tioners have looked for more straightforward methods for parameter estimation, for example Williams (1999) recommends the use maximum likelihood or generalised cross-validation. More details about maximum likelihood estimation are given in this section, while the ap-plication of generalised cross-validation is given in (Rasmussen and Williams, 2006). In this work, we selected hyperparameters for all the GP algorithms through maximum likelihood.
In the simplest example of all, the regression case, given some training data D = (X,t), a noise model of the form p(D|f) = N(f, σ2
vI) and a GP prior p(f) = N(0,K), it can be
proved that the marginal likelihood is
p(D|Θk) =
ˆ
p(D|f)p(f|Θk)∂f
= 1
(2π)N/2|K+σ2
vI|
1/2 exp
−1 2t
T K+σ2
vI
−1
t
Therefore the log ofp(D|Θk)may be computed analytically as
l = logp(D|Θk)
= −1 2log
K+σv2I −
1 2t
T K+σ2
vI
−1
t− N
2 log 2π.
(19)
As there is no closed form solution for the maximisation of l w.r.t. Θk, one needs to rely on numeric methods such as conjugate gradients to find a local maximum. Indeed the gradient of (19) will be used and is written explicitly as
∂l
∂θi
= −1 2t
T K+σ2
vI
−1
t+tT K+σv2I−1 ∂K
∂θi
K+σ2vI−1t.
The strategy for parameter specification in the case of Gaussian process classifiers and variants (i.e. GPC, BFD and WGP) follows the same lines as that of regression. In other words, the idea is to maximise the marginal likelihood of the data, but now with the specific noise model defined by each method. For example in the case of GPC’s it will be Equation 17.
5.6
Automatic relevance determination
Adapting the values of the hyperparameters is important if one wants to have good generali-sation results and a better understanding of the data. Indeed for some families of covariance functions there is a hyperparameter associated with each input dimension, such that each one represents the characteristic length scale of the data7
, thus by applying a parameter adapta-tion method like maximum likelihood the relative importance of the inputs will be inferred. For instance
k xi,xj=θ1exp
−θ2 2 x
i−xjT
Θard xi−xj
+θ3δij, (20)
is a function that weighs each component of Θard = diag (θ4, . . . , θ4+d−1) -with d being the
dimension of the data when the training is done. The parameter δij is the Kronecker delta,
which for a large enough value θ3, ensures thatK is positive definite and therefore invertible
at all times.
This type of feature was proposed first in the context of neural networks by Mackay (1995) and Neal (1996) and is usually referred to as automatic relevance determination or ARD. If
7
the selection of prior covariance is adequate, then ARD may be a very useful method for ranking and selecting features as it effectively orders inputs according to their importance and eliminates those that are deemed unimportant. This feature might be very useful in the bankruptcy prediction problem because it can be used to rank the financial ratios in order of importance, as it is done later on.
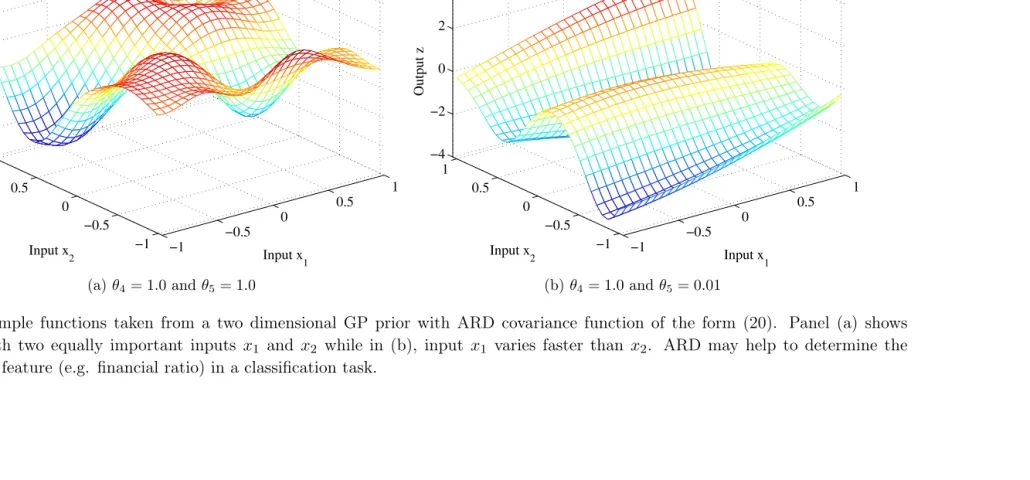
In order to understand better ARD, Figure 3 shows samples from a covariance of the form (20) with two dimensional inputs. Panel (a) shows a sample where both inputsx1 andx2have
the same associated weights θ4 and θ5; thus in average the ensemble of samples will have a
roughly equal degree of variation along the axes x1 andx2. On the contrary, panel (b) shows
a sample where the value θ4 > θ5, producing an output that varies more on the direction x1
than onx2. Therefore, in both cases, by observing some dataD, the fitted posterior will have
weights θ4 and θ5 that reflect their ‘real’ importance to the regression.
6
Data and Experiments
This section describes the experiments that were carried out to compare the predictive per-formance of the proposed algorithmic approaches, with respect to discriminant analysis and logistic regression. As previously mentioned, we used data from the Federal Deposit Insurance Corporation (FDIC) and a brief analysis of the results follows. It should be noted that ex-periments were performed under a limited setup and consequently results are not statistically conclusive but nevertheless provide some evidence about the potential power of GP’s.
6.1
FDIC data
The University of Essex (UK) kindly provided a data set comprised of 280 multivariate observations and whose main features are as follows. The sample consists of an equal number of failed and non-failed US banks that reported their financial statements to the FDIC from
−1
−0.5 0
0.5 1
−1 −0.5 0 0.5 1 −8 −6 −4 −2 0 2 4
Input x
1
Input x
2
Output z
(a)θ4= 1.0 andθ5= 1.0
−1
−0.5 0
0.5 1
−1 −0.5 0 0.5 1 −4 −2 0 2 4
Input x
1
Input x
2
Output z
[image:21.612.97.682.161.401.2](b)θ4= 1.0 andθ5= 0.01
Figure 3: Sample functions taken from a two dimensional GP prior with ARD covariance function of the form (20). Panel (a) shows a function with two equally important inputs x1 and x2 while in (b), input x1 varies faster than x2. ARD may help to determine the
relevance of a feature (e.g. financial ratio) in a classification task.
Financial ratios
1. Net interest margin 7. Efficiency ratio
2. Non-interest income to earning assets 8. Non-current assets plus other real estate owned to assets
3. Non-interest expense to earning assets 9. Cash plus US treasury and government obligations to total assets
[image:22.612.77.532.78.211.2]4. Net operating income to assets 10. Equity capital to assets 5. Return on assets 11. Core capital leverage ratio. 6. Return on equity
Table 1: Financial ratios used in the classification experiments. Data comes from the Federal deposit insurance corporation (FDIC) and was kindly provided by the Centre for Computational Finance and Economic Agents (CCFEA), University of Essex. Each ratio is described in Appendix A.
Due to the limited amount of data we had to rely on random splits of training and test data in order to average our results and reduce as much as possible any variance effects. We created 100 different pairs of training and testing sets out of the 234 available observations, keeping the same proportion of training to testing data as the original data set. Using random splitting of the data to reduce the variance of the estimates is not uncommon and is justified by the work of Efron (1979) and Stone (1974) on boot-strapping and cross-validation, respectively; (Rätsch et al., 1998) used a similar approach to ours. This setup also helps to reduce the effects of any possible overfitting, although this is not completely guaranteed.
6.2
Experimental setup
We tested five different algorithms on the referred data: Fisher discriminant analysis (FDA), least-squares support vector machines (LS-SVM), GP’s for classification (GPC), Warped GP’s (WGP) and Bayesian Fisher discriminant (BFD). Every set was normalised to have zero mean and unit standard deviation. The algorithms were thus trained 100 times and tested 100
more and because of this, we considered most convenient to report the average classification performance over the 100 splits in terms of the areas under the ROC curves (AUC’s).
In fact AUC’s are highly convenient way to measure the performance of a classifier when-ever the decision threshold has not been defined. This is because an ROC curve plots over a two-dimensional space the number false positives (FP’s) and negatives (FN’s) that are ob-tained under different classification thresholds. Recalling the function D(w) of Figure 1 and Equation 4, the number of FP’s and FN’s will vary according to what the value of the offset
them to predict sovereign debt rescheduling. Because the costs of wrongly classifying a bank as bankrupt are unknown to us, ROC’s are a good way to measure the performance of the set of proposed algorithms. Good introductory discussions about ROC curves and AUC’s are found in (Engelmann et al., 2003, Fawcett, 2003, 2006).
6.3
Implementation and results
The FDA, logit and probit classifiers were implemented with the Matlab function classify
(Statistics toolbox, version 5.0.1). Whereas for LS-SVM, we used the LSSVMlab toolbox of Suykens et al. (2002). The default 10-fold cross-validation parameters were used for the training. BFD was implemented with the toolbox of Peña Centeno and Lawrence (2006). Meanwhile, the WGP implementation was that of Snelson et al. (2003), with the parameter
[image:23.612.100.510.530.624.2]I set to 5function components. As WGP’s are designed for regression but not classification, we clamped the targets to the label values. Finally, for GPC’s we used the code of Rasmussen and Williams (2006). For all these methods, we generated ROC curves with the output values each of them produced, i.e. in most cases posterior class probabilities, except for FDA and WGP’s.
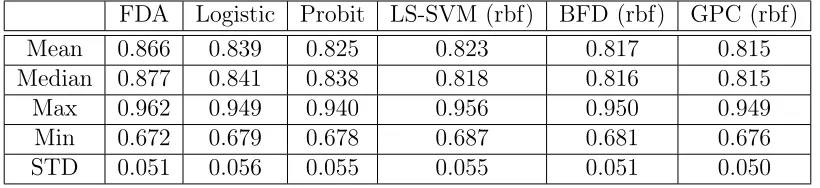
Table 2 reports the averages of the AUC’s over all the100 testing instances of the FDIC data. In this comparison, LS-SVM, GPC and BFD were trained with a covariance function of the form (15). Note that FDA outperforms all the other methods, in terms of the mean and median parameters. These results made us think the FDIC dataset could be separated by a linear trend rather than by a non-linear function, thus instead decided to use a linear covariance of the form k(x,x′) =xTΘardx′, withΘard ={θ1, . . . , θd} for the reported
exper-iments of Table 3. This type of covariance is known as ARD ( Section 5.6) because it assigns a hyperparameter θi to each dimension i of the data.
FDA Logistic Probit LS-SVM (rbf) BFD (rbf) GPC (rbf) Mean 0.866 0.839 0.825 0.823 0.817 0.815 Median 0.877 0.841 0.838 0.818 0.816 0.815 Max 0.962 0.949 0.940 0.956 0.950 0.949 Min 0.672 0.679 0.678 0.687 0.681 0.676 STD 0.051 0.056 0.055 0.055 0.051 0.050
BayLS-SVM BFD (linard) GPC (linard)
[image:24.612.162.447.77.173.2]Mean 0.839 0.832 0.869 Median 0.853 0.831 0.873 Max 0.952 0.964 0.982 Min 0.627 0.720 0.578 STD 0.061 0.048 0.051
Table 3: Average classification results on the Federal Insurance Deposit Corporation data with algorithms that have ARD priors (Section 5.6). We report mean, median, maximum, minimum and standard deviation of the percentage AUC over all testing instances. The compared methods are: Bayesian least-squared support vector machine (BayLS-SVM), Bayesian Fisher’s discriminant (BFD) and Warped Gaussian processes (WGP’s). Compare these results to those of Table 2.
In the second experiment (Table 3) we observe much better results for GPC and a moderate improvement for the Bayesian version of LS-SVM’s (Van Gestel et al., 2002) and for BFD (linard), if compared with the figures of Table 2. In this case the mean of GPC is slightly higher than FDA’s, although the median is still lower.
As a final experiment we decided to prove the WGP algorithm of Snelson et al. (2003), because in some domains it may have more expressive power than the other methods. Results of AUC’s are shown in Table 4 below. It can be seen that WGP has a better predictive performance than the rest of the compared models, including FDA and GPC (see Tables 2 and 3); although with a higher variance.
Mean Median
Max Min STD
WGP 0.914 0.978 1.000 0.541 0.114
Table 4: Average classification results on the FDIC data with the warped Gaussian process algorithm (WGP) of Snelson et al. (2003). The figures reported are mean, median, maximum, minimum and standard deviation of the percentage area under the ROC curve (AUC) over all testing instances of the data.
[image:24.612.257.351.445.541.2]discussed in Section 8, we expect to have a more complete dataset in the future in order to overcome these limitations. We also remark that taking into account the standard deviation of the reported results implies that neither GPC’s nor WGP’s are substantially better than FDA. Finally, the standard deviation of WGP’s is the highest of all (Table 4) and this tells the algorithm is performing substantially better in some cases but substantially worse in others.
6.4
Analysis of features
This section briefly describes the findings of applying ARD priors to the FDIC dataset. The study was performed on GPC’s, LS-SVM’s, BFD and WGP’s, due to the results of the experiments reported in Tables 3 and 4. However only WGP’s are reported because they were method that yielded the best classification results. Due to the random splitting of the data, one hundred different rankings were obtained, each member of the set being the ordering of the 11 financial ratios. Therefore it was considered most appropriate to summarise the number of times a feature was allotted to a particular rank through histograms, with Figures 4 and 5 doing so. It is important to consider that ARD measures the degree of variation of a feature to do the ranking and although it also assumes independence among features, this does not necessarily means that a low rank will necessarily be irrelevant for the classification. Descriptions of each of the financial ratios are included in Appendix A.
Figures 4 and 5 show some regularity on the first four as well as on the last three po-sitions occupied by the features. Among the first group, features six, five, seven and four, corresponding to return on equity (ROE), return on assets (ROA), efficiency ratio (ER) and net operating income (NOI), are the most frequently ranked. ROE is a relevant financial ratio to determine financial soundness because it measures the efficiency of a company to generate profits from every dollar of stockholders’ equity. ROA is also a plausible feature because it is frequently used to compare the performance of financial institutions, banks for example; although it might not be such a useful feature when it comes to compare other types of institutions, like e.g. insurance companies, which in particular have specific reserve requirements. As mentioned in Appendix A, there is no consensus on how to compute the ER, however a larger value of this parameter is usually taken as a sign of corporate distress and this characteristic makes it a good candidate to predict bankruptcy. Lastly, the NOI is generally perceived as a reliable measure of a company’s performance and therefore is another reasonable selection.
generally thought that modern banks should rely less on this parameter due to the competitive gains achieved by the financial sector during recent times. Regarding NII, this ratio does not seem to have a direct relationship with the typical symptoms of financial distress a bank may have; therefore further analysis is due. Finally, although CR is probably one of the most important ratios to assess financial health, it was the one that occupied the lowest rankings. Nevertheless, this observation might be misleading if one considers that CR is also a candidate to occupy the sixth rank (of all the eleven) and more importantly, on the fact that the previously mentioned feature independence assumption of ARD might not necessarily hold for this dataset.
It would be useful to prove if the relevant features: return on equity, return on assets, efficiency ratio and net operating income continue to be just as relevant along different periods of time; this in relation to the claim made by Goodhard (1975) that the informative content of economic and financial indicators is lost once they start being used to make predictions. This is of course a shared weakness of all the presented methods in this paper: FDA, logistic regression and the different guises GP’s; although we believe this issue could be addressed by using methods that break the i.i.d.assumption of the data. Nevertheless, in the specific case of FDA, it is remarkable that the estimated weights of the Z-score have remained virtually unchanged for about four decades.
7
Credit risk in portfolios
We have presented a new family of algorithmic techniques unknown to the computational economics community, that of Gaussian processes interpreted as a prior distribution over functional space and how they can be applied to do bankruptcy prediction in terms of a classification task. Some commercial products such as CreditMetricsTM
are used to quantify full credit risk, i.e. give an estimate of the losses of a portfolio through the application of a suite of different techniques; including FDA. Indeed, the CreditMetrics framework (JP , 1997) made us realise that GP’s are perfectly suitable for integration into such product in the form of a binary classification module. Something similar would happen with other types of products such as Moody’s KMVTM
1 2 3 4 5 6 7 8 9 10 11 0 2 4 6 8 10 12 14 16 Position:1 Feature number
No. of occurrences
1 2 3 4 5 6 7 8 9 10 11 0 2 4 6 8 10 12 14 16 18 Position:2 Feature number
No. of occurrences
1 2 3 4 5 6 7 8 9 10 11 0 5 10 15 Position:3 Feature number
No. of occurrences
1 2 3 4 5 6 7 8 9 10 11 0 2 4 6 8 10 12 Position:4 Feature number
No. of occurrences
1 2 3 4 5 6 7 8 9 10 11 0 2 4 6 8 10 12 14 Position:5 Feature number
No. of occurrences
1 2 3 4 5 6 7 8 9 10 11 0 2 4 6 8 10 12 Position:6 Feature number
[image:27.612.66.706.67.439.2]No. of occurrences
Figure 4: Histograms of the first six rankings (positions) produced by warped Gaussian processes (WGP) over the FDIC dataset. The way to read the results is the following: e.g. the top-left histogram shows the first ranked feature is number6, i.e. return on equity (ROE), with 16 occurrences; while the top-middle histogram shows features 5, return on assets (ROA) and 8, non current assets (NCA) almost equally as important in the second position with 18 and 17 occurrences respectively. The analysis may continue in a similar fashion in order to cover all positions available and in the overall the results tell that features six, five, seven and four are the mostrelevant to the classifier. Feature definitions are included in Appendix A.
1 2 3 4 5 6 7 8 9 10 11 0 2 4 6 8 10 12 14 16 18 20 Position:7 Feature number
No. of occurrences
1 2 3 4 5 6 7 8 9 10 11 0 2 4 6 8 10 12 14 16 Position:8 Feature number
No. of occurrences
1 2 3 4 5 6 7 8 9 10 11 0 2 4 6 8 10 12 14 Position:9 Feature number
No. of occurrences
1 2 3 4 5 6 7 8 9 10 11 0 2 4 6 8 10 12 14 Position:10 Feature number
No. of occurrences
1 2 3 4 5 6 7 8 9 10 11 0 2 4 6 8 10 12 14 Position:11 Feature number
[image:28.612.65.710.84.453.2]No. of occurrences
Figure 5: Histograms of the last five rankings produced by warped Gaussian processes (WGP) over the FDIC dataset. Please refer to Figure 4 for further reference on how to interpret these plots. Plots corresponding to positions9,10and11tell that the net interest margin (NIM), non-interest income (NII) and the capital ratio (CR) are theleast relevant for the predictions. Features are defined in Appendix A.
8
Conclusions and further work
This work has presented a comprehensive review of some statistical methods for classifica-tion and their applicaclassifica-tion to the bankruptcy predicclassifica-tion problem. A comparison with newly developed tools, such as various guises of Gaussian processes for classification has also been included. Justification for trying new techniques lies on the fact that standard approaches for estimating a classifier are based on parametric approaches. However, it was demonstrated that by taking a parametric approach a richer and more flexible class of models was being neglected, that of the non-parametric models to whom Gaussian processes belong.
GP’s are a generalisation of the Gaussian density to infinite dimensional function spaces and lend themselves naturally to Bayesian inference tasks because of their simple analytic properties and ease of use. However, these characteristics do not preclude them being applied on a set of complex problem domains like for example separating data between classes. In this work we used data from the Federal deposit insurance corporation to show how different instances of GP’s yielded potentially competitive classification results with respect to well established techniques like the Z-score of Altman (i.e. discriminant analysis) and logistic regression; although we admit that the experimental setup was far from optimal.
An interesting by-product of the Bayesian formalism is that certain priors lead to the ranking and effective pruning of features when inference is done, and GP’s are no exception. This by-product is known as automatic relevance determination and is enabled whenever a prior parameter is assigned to each dimension of the data (in our case the dimensions were given by each of the financial ratios of the FDIC data). With the aim of understanding better which financial ratios were more important to the classification task, some ARD covariance functions were tried and the results showed that for warped Gaussian processes the return on equity (ROE), return on assets (ROA), equity ratio (ER) and net operating income (NOI) were the highest ranked. The capital ratio (CR) a widely viewed relevant ratio for financial health assessment, was ranked in low positions.
A
Appendix
A brief description of the financial ratios that compose the FDIC data follows.
Ratio 1. Net interest margin (NIM) is the difference between the proceeds from borrowers
and the interest payed to their lenders.
Ratio 2. Non-interest income (NII) is the sum of the following types of income: fee-based,
trading, that coming from fiduciary activities and other non-interest associated one.
Ratio 3. Non-interest expense (NIX) comprises basically three types of expenses:
per-sonnel expense, occupancy and other operating expenses.
Ratio 4. Net operating income (NOI) is related to the company’s gross income associated
with its properties less the operating expenses.
Ratio 5. Return on assets (ROA) is an indicator of how profitable a company is relative
to its total assets. ROA is calculated as the ratio between the company’s total earnings over the year and the company’s total assets.
Ratio 6. Return on equity (ROE) is a measure of the rate of return on the shareholder’s
equity of the common stock owners. ROE is estimated as the year’s net income (after pre-ferred stock dividends but before common stock dividends) divided by total equity (excluding preferred shares).
Ratio 7. Efficiency ratio (ER) is a ratio used to measure the efficiency of a company,
although not every one of them calculates it in the same way.
Ratio 8. Non current assets (NCA) are those that cannot be easily converted into cash,
e.g. real estate, machinery, long-term investments or patents.
Ratio 9. It is the ratio of cash plus US treasury and government obligations to total
assets.
Ratio 10. Equity capital (EC) is the capital raised from owners.
Ratio 11. The capital ratio (CR) also known as the leverage ratio is calculated as the
References
E. I. Altman. Revisiting credit scoring models in a Basel 2 environment. Technical report, Stern School of Business, New York University, May 2002.
E. I. Altman. Financial ratios, discriminant analysis and the prediction of corporate bankruptcy. Journal of Finance, 23(4):589–609, September 1968.
A. F. Atiya. Bankruptcy prediction for credit risk using neural networks: A survey and new results. IEEE Transactions On Neural Networks, 12:929–935, July 2001.
B. Back, T. Laitinen, K. Sere, and M. van Wezel. Choosing bankruptcy predictors using discriminant analysis, logit analysis, and genetic algorithms. Technical Report 40, Turku Centre for Computer Science, September 1996.
D. Bamber. The area above the ordinal dominance graph and the area below the receiver operating graph. Journal of Mathematical Psychology, 12:387–415, 1975.
Basel Committee on Banking Supervision. International Convergence of Capital Measurement and Capital Standards. A Revised Framework. Bank for International Settlements, June 2004.
W. H. Beaver. Financial ratios as predictors of failures. Journal of Accounting Research, 4: 71–111, 1966.
C. M. Bishop. Neural Networks for Pattern Recognition. Oxford University Press, Oxford, UK, 1995.
C. M. Bishop. Pattern Recognition and Machine Learning. Information Science and Statistics. Springer-Verlag, New York, USA, 2006.
G. E. Box and G. C. Tiao. Bayesian Inference in Statistical Analysis. Wiley Classics Library, Published 1992. John Wiley & Sons Ltd., New York, USA, 1973.
S.-H. Chen, editor. Genetic Algorithms and Genetic Programming in Computational Finance. Kluwer Academic, 2002.
C. Cortes and V. V. Vapnik. Support vector networks. Machine Learning, 20:273–297, 1995.
B. Efron. Bootstrap methods: Another look at the Jackknife. The Annals of Statistics, 7: 1–26, 1979.
J. Egan. Signal Detection Theory and ROC Analysis. Series in Cognition and Perception. Academic Press, New York, 1975.
B. Engelmann, E. Hayden, and D. Tasche. Testing rating accuracy. Risk, 16:82–86, 2003.
A. Estrella, S. Park, and S. Peristiani. Capital ratios as predictors of bank failure. Federal Reserve Bank of New York Economic Policy Review, pages 33–52, July 2000.
T. E. Fawcett. ROC graphs: Notes and practical considerations for researchers. Technical Report HPL-2003-4, HP Labs, 2003.
T. E. Fawcett. An introduction to ROC analysis. Pattern Recognition Letters, 27:861–874, 2006.
R. A. Fisher. The use of multiple measurements in taxonomic problems. Annals of Eugenics, 7:179, 1936.
G. H. Golub and C. F. Van Loan. Matrix computations. Johns Hopkins Studies in Mathe-matical Sciences. Johns Hopkins University Press, Baltimore, MD, USA, 3rd edition, 1996.
C. Goodhard. Monetary relationships: A view from Threadneedle Street. Papers in Monetary Economics, 1975. Reserve Bank of Australia.
G. Grimmett and D. Stirzaker. Probability and Random Processes. Oxford University Press, Oxford, UK, 3rd edition, 2004.
P. Joos, K. Vanhoof, H. Ooghe, and N. Sierens. Credit classification: A comparison of logit models and decision trees. In10th European Conference on Machine Learning. Proceedings Notes of the Workshop on Application of Machine Learning and Data Mining in Finance, pages 59–72, Chemnitz, Germany, April 24 1998.
Credit Metrics - Technical Document. JP Morgan, New York, April 1997.
G. S. Kimeldorf and G. Wahba. A correspondence between Bayesian estimation on stochastic processes and smoothing by splines. Annals of Mathematical Statistics, 41(2):495–502, 1970.
D. G. Krige. Two-dimensional weighting moving average trend surfaces for ore evaluation.
D. J. C. Mackay. Probable networks and plausible predictions - a review of practical Bayesian methods for supervised neural networks. Network: Computation in Neural Systems, 6(3): 469–505, 1995.
D. J. C. Mackay. Introduction to Gaussian processes. In C. M. Bishop, editor,Neural Networks and Machine Learning, volume 168 of NATO ASI Series, pages 133–165. Springer-Verlag, Berlin, Germany, 1998.
D. J. C. Mackay. Information Theory, Learning and Inference Algorithms. Cambridge Uni-versity Press, Cambridge, UK, 2003.
G. J. MacLachlan. Discriminant Analysis and Pattern Recognition. John Wiley & Sons Ltd., New York, USA, 1991.
C. McDonald and L. van de Gucht. High-yield bond default and call risks. Review of Eco-nomics and Statistics, 81:409–419, 1999.
T. P. Minka. A Family of Algorithms for Approximate Bayesian Inference. PhD thesis, Massachusetts Institute of Technology, 2001.
R. M. Neal. Bayesian Learning for Neural Networks. Springer-Verlag, New York, USA, 1996.
A. O’Hagan. Curve fitting and optimal design for prediction. Journal of the Royal Statistical Society, Series B (Methodological), 40(1):1–42, 1978.
C. Park and I. Han. A case-based reasoning with the feature weights derived by analytic hierarchy process for bankruptcy prediction. Expert Systems with Applications, 23:255– 264, 2002.
T. Peña Centeno and N. D. Lawrence. Optimising kernel parameters and regularisation coefficients for non-linear discriminant analysis. Journal of Machine Learning Research, 7: 455–491, 2006.
D. Quintana, Y. Saez, A. Mochon, and P. Isasi. Early bankruptcy prediction using ENPC.
Journal of Applied Intelligence, 2007. ISSN 0924-669X.
C. E. Rasmussen. Gaussian processes in machine learning. In O. Bousquet, U. von Luxburg, and G. Rätsch, editors, Advanced Lectures on Machine Learning, volume 3176 of Lecture Notes in Computer Science/Artifical Intelligence. Springer-Verlag, 2004.
G. Rätsch, T. Onoda, and K.-R. Müller. Soft margins for AdaBoost. Technical Report NC-TR-98-021, Royal Holloway College, University of London, London, UK, 1998.
A. Rodriguez and P. Rodriguez. Understanding and predicting sovereign debt rescheduling: A comparison of the areas under receiving operating characteristic curves. Journal of Forecasting, 7(25):459–479, 2006.
B. Schölkopf and A. J. Smola. Learning with Kernels: Support Vector Machines, Regulariza-tion, Optimization and Beyond. MIT Press, Cambridge, MA, USA, 2002.
M. Seeger. Gaussian processes for machine learning. International Journal of Neural Systems, 14(2):69–106, 2004.
C. Serrano-Cinca, C. B. Martin, and J. Gallizo. Artificial neural networks in financial state-ment analysis: Ratios versus accounting data. In 16th Annual Congress of the European Accounting Association, Turku, Finland, 28-30 Apr. 1993.
K.-S. Shin and Y.-J. Lee. A genetic algorithm application in bankruptcy prediction modeling.
Expert Systems with Applications, 23:321–328, October 2002.
E. Snelson, C. E. Rasmussen, and Z. Ghahramani. Warped gaussian processes. In S. Thrun, L. K. Saul, and B. Schölkopf, editors,Advances in Neural Information Processing Systems 16, Cambridge, MA, USA, 2003. MIT Press.
M. Stone. Cross-validatory choice and assessment of statistical predictions. Journal of the Royal Statistical Society, 36:111–147, 1974.
J. A. Suykens and J. Vandewalle. Least squares support vector machines. Neural Processing Letters, 9(3):293–300, 1999.
J. A. Suykens, T. Van Gestel, J. D. Brabanter, B. D. Moor, and J. Vandewalle. Least Squares Support Vector Machines. World Scientific, Singapore, 2002.
K. Tam and M. Kiang. Managerial application of neural networks: The case of bank failure predictions. Management Science, 38:926–947, 1992.
T. N. Thiele. Theory of Observations. Layton, London, UK, 1903. Reprinted in Annals of Mathematical Statistics 2:165-308, 1931.
T. Van Gestel, J. A. Suykens, G. Lanckriet, A. Lambrechts, B. de Moor, and J. Vandewalle. Bayesian framework for least squares support vector machine classifiers, Gaussian processes and kernel discriminant analysis. Neural Computation, 14(5):1115–1147, 2002.
F. Varetto. Genetic algorithms applications in the analysis of insolvency risk. Journal of Banking and Finance, 22:1421–1439, 1998.
A. Verikas, Z. Kalsyte, M. Bacauskiene, and A. Gelzinis. Hybrid and ensemble-based soft computing techniques in bankruptcy prediction: A survey. Soft Computing - A Fusion of Foundations, Methodologies and Applications (Online), September 2009.
G. Wahba. Spline Models for Observational Data. Society for Industrial and Applied Math-ematics. CBMS-NSF Regional Conference in Applied Mathematics 59, 1990.
C. K. Williams. Prediction with Gaussian processes: from linear regression to linear prediction and beyond. In M. I. Jordan, editor, Learning in Graphical Models, D, Behavioural and social sciences 11. Kluwer, Dordrecht, The Netherlands, 1999.
C. K. Williams and D. Barber. Bayesian classification with Gaussian processes. IEEE Trans-actions, Pattern Analysis and Machine Intelligence, 20(12):1342–1351, 1998.