Munich Personal RePEc Archive
Predictors of sickness absence and
presenteeism: Does the pattern differ by
a respondent’s health?
Böckerman, Petri and Laukkanen, Erkki
2 September 2009
Online at
https://mpra.ub.uni-muenchen.de/17067/
P A L K A N S A A J I E N T U T K I M U S L A I T O S
•
T Y Ö P A P E R E I T A
LABOUR INSTITUTE FOR ECONOMIC RESEARCH • DISCUSSION PAPERS
* Corresponding author. Labour Institute for Economic Research. Address: Pitkänsillanranta 3A, 6th floor, FI-00530 Helsinki, Finland.
Phone: +358-9-25357330. Fax: +358-9-25357332. E-mail: petri.bockerman@labour.fi
** The Central Organisation of Finnish Trade Unions, Helsinki, Finland. Address: Hakaniemenranta 1, FI-00530 Helsinki, Finland.
Phone: +358-40-5321777. E-mail: erkki.laukkanen@sak.fi
253
Predictors of
sickness absence
and presenteeism:
Does the pattern
differ by a
respondent’s
health?
TIIVISTELMÄ
Se, sairastaako työntekijä kotona vai työpaikalla, riippuu sekä työntekijän ominaisuuksista
että tavasta organisoida työpaikan työt. Aiempaan tutkimukseemme pohjautuen olemme
sel-vittäneet työaikajärjestelyjen ja työpaikan tehokkuusvaatimusten vaikutusta
sairauskäyttäy-tymiseen koetun työkyvyn mukaan. Tulosten mukaan se, että haluttu viikkotyöaika täsmää
tehdyn viikkotyöajan kanssa, vähentää sekä sairauspoissaolojen että sairaana työskentelyn
todennäköisyyttä, mutta vain huonon työkyvyn omaavilla. Vastaavasti sellainen
tehokkuus-normi, jossa työpaikan johto asettaa tehokkuuden kaiken muun edelle, lisää sairaana
työsken-telyn todennäköisyyttä, mutta vain hyvän työkyvyn omaavilla.
ABSTRACT
Objectives: We examine the predictors of sickness presenteeism in comparison with sickness
absenteeism. The paper focuses on the effects of working-time match and efficiency demands
and differentiates the estimates by a respondent’s self-assessed health.
Methods: We use survey data covering 884 Finnish trade union members in 2009. We
estimate logit models. All models include control variables such as the sector of the economy
and the type of contract.
Results: Working-time match between desired and actual weekly working hours reduces
both sickness absence and presenteeism in the whole sample that consists of workers with all
health levels. The point estimates reveal that working-time match decreases the prevalence of
sickness absence by 7% and presenteeism by 8%. However, the estimates that differentiate
by a respondent’s health show that this pattern prevails only for those workers who have poor
health. Hence, the point estimates for those who have poor health are much larger than the
ones for the whole sample. Working-time match reduces the prevalence of sickness absence
by 21% and presenteeism by 20% for those workers who have poor health. In contrast,
working-time match has no influence whatsoever on the prevalence of work-related sickness
in the whole sample. However, additional results reveal that this pattern prevails only for
those workers who have good health.
Conclusions: The effects of working-time match and efficiency demands on the prevalence
of sickness absence and presenteeism are strongly conditional upon a worker’s self-assessed
health level. Therefore, the worker’s initial health is an important attribute that has to be
taken into account when one is designing appropriate policies to reduce sickness absence and
presenteeism.
Key words:Absenteeism, Sickness absence, Presenteeism
INTRODUCTION
Decrease in sickness absenteeism reduces firms’ costs. However, it also contains an
opportunity for decreasing productivity through presenteeism (“present at work in spite of
sickness”).1 Sickness presenteeism may contribute to workers’ ill health and firms’ costs in
the long run,2, 3, 4 and even to dysfunctional “competitive presenteeism”, which constitutes an
extreme example of competitive culture at workplaces.5
The question about the right management strategy concerning sickness absenteeism and
presenteeism is very important for employers as well as for the healthcare sector as a whole.
Productivity loss in absenteeism is 100 per cent, since the person’s work contribution during
sickness absence is non-existent. The direct and indirect costs caused by presenteeism are
much more difficult to estimate.6, 7
Before the evaluation of costs, deeper knowledge of the determinants of sickness absenteeism
and presenteeism is essential. It is reasonable to assume that sickness presenteeism is affected
by the same underlying factors as sickness absenteeism, i.e. attributes related to workers and
workplaces.8 Special attention should be paid to working-time arrangements,9 workers’
replacement practices,10 attendance-pressure factors11 and personal attitudes,12 according to
This article contributes to the existing knowledge by studying the predictors of sickness
presenteeism in comparison with sickness absenteeism. We focus on the effects of
working-time match between desired and actual weekly working hours and efficiency demands. In
particular, we differentiate the estimates by the respondent’s self-assessed health, because the
literature has largely ignored worker heterogeneity in terms of health. Using survey data of
Finnish union members from 2009, we provide fresh evidence of the determinants of both
work-related sickness categories. The Finnish case is particularly interesting, because flexible
working-time arrangements have gained substantial popularity during the past 10 years.
These policies should improve the working-hours match at the workplaces. However, at the
same time there has been an increase in the adverse effects of time pressure on wage and
salary earners, according to the Quality of Work Life Surveys by Statistics Finland.13
METHODS
Sample
Our data set consists of 884 members in SAK-affiliated unions. SAK, the Central
Organisation of Finnish Trade Unions, is the largest workers’ confederation in Finland, and
includes 26 unions. The members of these unions cover all sectors of the Finnish economy.
Most of them are blue-collar workers. The survey provides a broad picture of the labour
market in Finland, because the union density (i.e. the share of trade union members among
wage and salary earners) is 70 per cent. 1,346 individuals were selected for a telephone
interview by using random sampling among the SAK-affiliated union members that was
conducted by Statistics Finland in January and February 2009. Out of this sample, 1,020
persons or roughly 75 per cent participated in the interviews. However, 136 of them are
unemployed or out of the labour force. Therefore, the sample size that is used in the
estimations is 884, because we focus on those who are wage and salary earners.
Variables
The outcome variables of the models, absenteeism and presenteeism, are constructed
while sick) during the last 12 months are marked as zero; those who have been absent
(present) several times as one. This gives a prevalence of 30 per cent for absenteeism and 33
per cent for presenteeism (Table 1). Both averages are higher for women than they are for
men. The association between absenteeism and presenteeism is also strongly positive. 55 per
cent of the workers who have been absent from work several times have also been present at
work several times while sick.
The predictor variables include the control variables such as age groups, the sector of the
economy, establishment size and workers’ replaceability, following the literature,12, 14, as
listed in Table 2. When these factors are controlled for, it is possible to assess the impact of
factors that are firms’ possible policy variables.
In this study we focus on working-time match and efficiency demands, because there is
earlier evidence that they are particularly important predictors of sickness absence and
presenteeism.15 Working-hours match is defined between desired and actual weekly working
hours. The working-time match between the desired and the actual working hours is used as
an indicator of overall working-time balance. The efficiency demands reflect the relative
position of workers compared with employers. The respondents were asked to assess their
work by means of the statement: “In tough situations efficiency rules out everything else”. If
the respondents agreed with the statement, as 26 per cent did, the variable for the efficiency
demands was set as one, otherwise as zero. This indicator very strongly correlates with other
workplace quality measures that are available in the survey, like continuing rush (i.e. a
situation in which the worker is engaged in tasks without appropriate breaks from work) and
the opportunities to influence one’s work. To avoid multicollinearity problems, we use one
overall indicator instead of several.
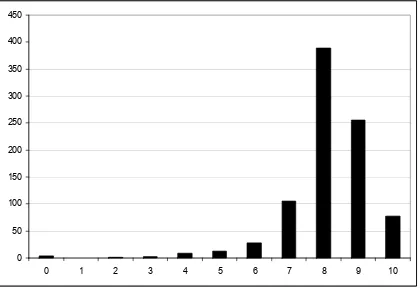
We differentiate the estimates by the worker’s health. One’s self-assessed health is an answer
to the question: “How is your health in general compared to your lifetime maximum?”. This
question aims to summarise a person’s general state of health at the moment of interview.
Self-assessed health is measured on an ordinal 10-point Likert scale with the alternatives from
10 (‘very good’) to 0 (‘very poor’). Hence, a higher value on this scale means that a person
currently feels healthier. Figure 1 illustrates the distribution of the variable. There is a
who have answered 8-10 as having ‘good health’, based on the clear cut-off point in Figure 1.
Other workers (health level 0-7) are categorized as having ‘poor health’.
Statistical methods
We estimate logit models, because our outcome variables are dichotomous indicators that
categorize the data into two groups. We use Stata v10.1 to estimate the models. The predictor
variables are entered in a single block. To make it easier to understand the estimates, we
report the marginal effects. For binary variables, they are calculated as differences in the
predicted probabilities.
RESULTS
Working-time match between desired and actual weekly hours reduces both sickness absence
and presenteeism in the whole sample that consists of workers with all health levels (Table 2,
Panels A-B, Column 1). These results are in accordance with the earlier research.15 The point
estimates reveal that working-time match decreases the prevalence of sickness absence by
7% and presenteeism by 8%. However, the estimates that differentiate between the
respondent’s self-assessed health point out that this pattern prevails only for those workers
who have poor health (Table 2, Panels A-B, Columns 2-3). Hence, the point estimates for
those who have poor health are much larger than those for the whole sample. Working-time
match reduces the prevalence of sickness absence by 21% and presenteeism by 20% for those
wage and salary earners who have poor health. In contrast, working-time match has no
influence whatsoever on work-related sickness for those who have good health (Table 2,
Panels A-B, Column 3). We also find that efficiency demands increase presenteeism in the
whole sample, but they do not have any influence on sickness absence. Efficiency demands
increase the prevalence of presenteeism by 8%, according to the point estimates (Table 2,
Panel B, Column 1). However, additional results reveal that this pattern prevails only for
those workers who have good health. The point estimate is also larger for them than it is for
the whole sample. Thus, efficiency demands increase the prevalence of sickness presenteeism
We have estimated models in which we have divided the variable for working-time match
into two separate predictor variables that capture those workers who would like to work more
weekly hours and those who would like to work fewer hours than their current actual hours
are (not reported). These results show that those with good health who work more than their
desired hours have a higher level of sickness absence. Furthermore, those workers with poor
health who work more than their desired weekly hours have a higher prevalence of
presenteeism.
There is also a variation in absenteeism and presenteeism that is unaccounted for after the
effects of the predictor variables have been taken into account, as indicated by McFadden’s
pseudo R2. One reason for this is that we use cross-sectional data. Thus, we cannot control
for individual characteristics that are constant over time, such as personality.
DISCUSSION
Workers differ with respect to their health. It is important to take this simple fact into
account when one is analysing the predictors of sickness absence and presenteeism. Our
results point out that the effect of working-time match between desired and actual weekly
working hours and efficiency demands on the prevalence of sickness absence and
presenteeism varies a lot according to the respondent’s self-assessed health. These results
carry important lessons for the design of policies to reduce them.
Working-time match between desired and actual hours decreases sickness absence and
presenteeism only for those workers who have poor health. A plausible explanation for this
pattern is that working-time balance supports a person’s overall well-being. Better
self-control that comes with working-time balance could be a particularly important factor for
those who have poor health to reduce their work-related sickness behaviour. Instead,
improvements in working-time arrangements do not affect work-related sickness among
those who have good health. New firms usually hire young workers who have good health.
Our findings suggest that measures other than working-time arrangements should be
preferred in those firms in order to reduce the prevalence of sickness absence and
prevalence of sickness presenteeism only for those workers who have good health. One
apparent explanation for this pattern is that there are more opportunities for those who are
generally in good health to respond by working while ill, as efficiency demands in a firm
increase. Hence, if the aim of a firm is to reduce sickness presenteeism among those who
have poor health, it would be useful to focus on other measures than the firm’s efficiency
demands. All in all, our results suggest that the general lessons of the literature regarding the
predictors of work-related sickness have to be considered with caution when one is designing
policies for particular firms, because the apparent worker heterogeneity in terms of health has
been largely ignored in the earlier research. Other aspects of worker heterogeneity such as
attitudinal factors also need to be considered in future research.
As we are examining a cross-sectional survey, we cannot explore the direction of causality.
This would require an instrumental variables strategy, involving instruments that would
predict the presence of working-time match and efficiency demands but not the prevalence of
work-related sickness. Hence, it is possible that our estimates are subject to selection bias, at
least to some degree, if the unobserved factors that determine whether workers have
working-time match or face efficiency demands also influence their work-related sickness behaviour.
The use of a worker’s self-assessed health should also be complemented with the utilization
of objective health information, although subjective measures of health have been proven to
have considerable value in predicting objective health outcomes, including morbidity and
mortality.16 Furthermore, the use of panel data would allow us to include a “personal history
of sickness” as one of the determinants of absenteeism and presenteeism. Another limitation
of our approach is that we took advantage of a survey of Finnish union members. Union
members do not constitute a fully representative sample of the total workforce, even in a
country with high union density. Finally, we were not in a position to estimate duration
models, because our survey data do not record how long the individual spells of absences and
WHAT THIS PAPER ADDS
• Sickness presenteeism is a newcomer. The concept emerged in the empirical literature
as late as the 1990s. Information about the determinants of sickness presenteeism is
still relatively sparse. To our knowledge, the apparent worker heterogeneity in terms
of health has been ignored in the literature.
• Using survey data of Finnish trade union members from 2009, we provide fresh evidence of the determinants of sickness absence and presenteeism. We focus on the
effects of working-time match and efficiency demands and differentiate the estimates
by the respondent’s self-assessed health.
• Working-time match between desired and actual weekly hours reduces both sickness
absence and presenteeism in the whole sample that consists of workers with all health
levels. However, the estimates that differentiate by the respondent’s health reveal that
this pattern prevails only for those workers who have poor self-assessed health. Thus,
working-time match has no influence whatsoever on sickness absence for those who
have good health.
• Efficiency demands also increase the prevalence of presenteeism in the whole sample.
However, additional results point out that this pattern prevails only for those workers
who have good health.
• The effects of working-time match and efficiency demands on the prevalence of
sickness absence and presenteeism are strongly conditional upon the worker’s
self-assessed health level. Therefore, the worker’s initial health is an important attribute
that has to be taken into account when one is designing appropriate policies to reduce
REFERENCES
1. Goetzel RZ, Long SR, Ozminkowski RJ, Wang S, Lynch W. Health, absence, disability,
and presenteeism cost estimates of certain physical and mental health conditions
affecting U.S. employers. J Occup Environ Med 2004;46 (4):398-412.
2. Ahola K, Kivimäki M, Honkonen T, Virtanen M, Koskinen S, Vahtera J, Lönnqvist J.
Occupational burnout and medically certified sickness absence: A population-based
study of Finnish employees. J Psychosom Res 2008;64 (2):185-193.
3. Dew K, Keefe V, Small K. ‘Choosing’ to work when sick: Workplace presenteeism. Soc Sci Med 2005;60 (10):2273-2282.
4. Kivimäki M, Head J, Ferrie J, Hemingway H, Shipley MJ, Vahtera J, Marmot MG.
Working while ill as a risk factor for serious coronary events: The Whitehall II Study.
Am J Public Health 2005;95 (1):98-102.
5. Simpson, R. Presenteeism, power and organizational change: Long hours as a career
barrier and the impact on the working lives of women managers. Br J Manag
1998;9(1):37-52.
6. Middaugh DJ. Presenteeism: Sick and tired at work. Dermatology Nursing
2005;19(2):172-185.
7. Schultz AB, Edington DW. Employee health and presenteeism: A systematic review. J Occup Rehabil 2007;17(3):547-579.
8. Böckerman P, Ilmakunnas P. Interaction of working conditions, job satisfaction, and
sickness absences: Evidence from a representative sample of employees. Soc Sci Med
2008;67(4):520-528.
9. Webster J. Diversity management in the ICT Industry: Challenges and issues for social dialogue. Report prepared for Union Network International. London: UNI Global Union, 2007.
10. Aronsson G, Gustafsson K, Dallner M. Sick but yet at work. An empirical study of
sickness presenteeism. J Epidemiol Community Health 2000;54:502-509.
11. Aronsson G, Gustafsson K. Sickness presenteeism: Prevalence, attendance-pressure
12. Hansen CD, Andersen JH. Going ill to work – What personal circumstances, attitudes and
work-related factors are associated with sickness presenteeism? Soc Sci Med
2008;67(6):956-964.
13. Lehto A-M, Sutela H. Three decades of working conditions. Findings of Finnish Quality of Work Life Surveys 1977-2008. Helsinki: Statistics Finland, 2009.
14. Pauly MV, Nicholson S, Polsky D, Berger ML, Sharda C. Valuing reductions in
on-the-job illness: Presenteeism from managerial and economic perspectives. Health Economics
2008;17(4):469-485.
15. Böckerman P, Laukkanen E. What makes you work while you are sick? Evidence from a
survey of workers. Eur J Public Health 2009; Forthcoming.
16. Idler EL, Benyamini Y. Self-rated health and mortality: A review of twenty-seven
Figure 1. Figure legend: The distribution of self-assessed health level (0-10) among respondents.
0 50 100 150 200 250 300 350 400 450
Table 1. Definitions and averages of the variables as percentages.
Variable Definition All Men Women
Outcome variables
Absenteeism Person has been absent several times because of illness during the past 12
months = 1, otherwise = 0 30 28 33 Presenteeism Person has been present several times
while sick during the past 12 months = 1,
otherwise = 0 33 29 40
Predictor variables
Policy variables
Working hours match Desired and actual weekly working hours
match = 1, otherwise = 0 68 69 66 Efficiency demands In tough situations efficiency rules out
everything else in firm, according to the
survey respondent = 1, otherwise = 0 26 27 25
Control variables
Sex Male = 1, female = 0 58 .. ..
Age
Less than 35 years Less than 35 years = 1, otherwise = 0
(reference) 12 9 17
35 – 50 years Age 35–50 = 1, otherwise = 0 42 41 42 > 50 years Age > 50 years = 1, otherwise = 0 46 49 41
Sector
The public sector Employer is state or municipality = 1,
otherwise = 0 (reference) 27 15 45 Processing industries Employer is in the processing industries
= 1, otherwise = 0 40 57 17
Private services Employer is in the private service sector
= 1, otherwise = 0 33 28 38
The type of contract
Temporary worker Temporary contract = 1, otherwise = 0
(reference) 7 4 12
Part-time worker Part-time worker = 1, otherwise = 0 8 3 14
Regular overtime Regular paid and unpaid overtime = 1,
occasional or none = 0 8 7 10
Variable Definition All Men Women
Less than 20 workers Size of plant less than 20 workers = 1,
otherwise = 0 (reference) 35 29 44 20 - 50 workers Size of plant 20 - 50 workers = 1,
otherwise = 0 28 28 27
> 50 workers Size of plant over 50 workers = 1,
otherwise = 0 37 44 29
Replaceability
No replacement Replacement is not possible = 1,
otherwise = 0 (reference) 11 11 10 Replacement by
substitutes
Replacement is possible by substitutes =
1, otherwise = 0 27 21 35
Replacement by colleagues
Replacement is possible by colleagues =
1, otherwise = 0 62 68 55
Rules No absence without a
sickness certificate
Not even a single day’s absence is possible without a sickness certificate, as defined in the collective labour
agreements = 1, otherwise = 0 (reference) 41 43 38 One or two days’ rule One or two days’ paid sickness absence
possible without a sickness certificate, as defined in the collective labour
agreements = 1, otherwise = 0 14 16 11 Three days’ rule Three days’ paid sickness absence
possible without a sickness certificate, as defined in the collective labour
agreements = 1, otherwise = 0 45 41 51
Table 2. The determinants of sickness absenteeism and presenteeism.
Panel A: Absenteeism
Sample All ‘Poor health’ ‘Good health’
Working hours match -0.0705** [0.0370]
-0.2092** [0.0320]
-0.0413 [0.2580] Efficiency demands -0.0443
[0.2120]
-0.0874 [0.3780]
-0.0421 [0.2830]
Control variables Yes Yes Yes
McFadden’s pseudo R2 0.0408 0.1546 0.0455
n 884 163 721
Panel B: Presenteeism
Sample All ‘Poor health’ ‘Good health’
Working hours match -0.0847** [0.0140]
-0.1956** [0.0310]
-0.0549 [0.1490] Efficiency demands 0.0847**
[0.0220]
-0.0311 [0.7380]
0.1074** [0.0110]
Control variables Yes Yes Yes
McFadden’s pseudo R2 0.0451 0.1339 0.0474
n 884 163 721