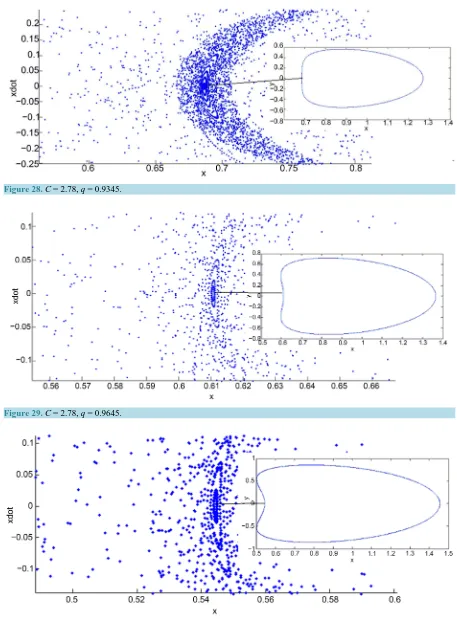
Evolution of Periodic Orbits in the Sun Saturn System
Full text
Figure


Related documents
To verify the regions of diversity (L 2 -D hy- brids), single amplicons of these regions (the tarp gene, incA , hctB , and toxin locus genes; the IGR upstream of ftsK ) that
Pylorus ring resection reduces delayed gastric emptying in patients undergoing pancreatoduodenectomy: a prospective, randomized, controlled trial of pylorus-resecting
It was decided that with the presence of such significant red flag signs that she should undergo advanced imaging, in this case an MRI, that revealed an underlying malignancy, which
Using the pattern-centered analysis function of BISON (Fig. 4), we were able to determine all patterns that con- tain the hmm.flhd domain in the regulator protein (left portion of
Figure 6-45(a,b) Achieved smoothed track accuracy for Benchmark target trajectory 6, excluding periods of manoeuvre, and (b) Percentage of radar time required for tracking
They spurn from the terrorist and Islamic militants groups in the Middle East, Africa, Far East, Europe, and The Latinos to the young American who abhors the inconsistencies
This paper mainly uses a kind of excellent performance and robust video characteristics: optical flow histogram characterization descriptor to express video
siRNA mediated knock down of KIF20A decreased pAKT (Ser473) protein expression in U251 ( Figure 5A , 5B ) and U87 ( Figure 5A , 5C ) cells compared to the control group,


