How cities develop: Affinity Factor
Model for forecasting city development
and dispersion
Deodhar, Rahul Prakash
R A H U L D E O D H A R
Rahul Deodhar
This paper discusses the principles that determine firstly how cities evolve over seven phases in what I call the Affinity Factor model. Secondly, we see how Affinity Factor model may help understand how development spreads or distributes within the city. We observe how these principles impact selection of office location and how we can predict the future of developing business districts. We try to understand how house prices get influenced. Finally, based on the principles discussed, we try to work out a possible township model.
09
Introduction
Real estate development in every city is unique. Still hidden within, are certain principles that are common. To understand it, we need to understand two central concepts. First, how town evolve and second how evolution happens within a town.
I propose a seven‐phase model explaining how a population surrounding a business or factory transforms into a town. Through the transformation we point to some important developments in terms of people and their work.
The paper postulates a growth model called “Affinity Factor Model” to explain how localities develop within a town. “Affinity factors” are those that drive the citizens towards them – e.g. business district and schools are key affinity factor.
The models help us understand why airports, usually built outside city limits, attract residential populations. Or, on a lighter note, we can guess where a company will locate its office!
We also derive a method to understand relative pricing between different areas. Further, we look at fundamental ideas for knowing if house prices are higher.
I also propose a structure of a township centred around a workplace based on first principles.
License
How do localities develop?
A fresh or new town forms over following seven phases.
Phase I) Seed Phase: In this phase the seed of development is sown. This is typically a business district or factory is established. The business district is planned with a certain population in mind. The people who work here live here.
Phase II) Development of Support infrastructure: In this phase support infrastructure develops. This leads to slight increase in population. Generally, planners already account for these. This typically includes:
Retailers for regular goods (groceries, pharmacy stores, gas stations etc)
Support services e.g. (food take‐away, lawn management, domestic help, plumbing and electrician services etc ) Phase III) Business Expansion: The dominant businesses attract other
supporting industries and a factory settlement starts becoming a town.
This leads to further population expansion but the population still lives closer.
Phase IV) Strengthening of support infrastructure: In this phase the support infrastructure itself becomes an income generating activity. The breadth and depth of services increases drastically leading improvement in quality of life. Typically,
Consumer durable retail (car showrooms, Electronic goods showrooms etc) start growing
A mall or departmental stores opens in the vicinity.
These activities add to the population that predominantly works in support sector.
Phase V) Developing Business hub: In this phase the locality turns into a business hub or a popular town.
Now we significant percentage of population travelling from newly emerging localities in the proximity.
Crowd movement (travel in and travel out) gains importance and infrastructure is usually created to support this.
Now the established infrastructure needs to support resident population full time (work and after work) and daily migrant population part time (during work).
Support infrastructure is strained. Support services become costlier Slums start appearing in the locality
Phase VI) Super straining: In this phase municipal innovations in debottlenecking, infrastructure additions create some relief. Though slums increase and cost of doing business starts skyrocketing.
Infrastructure now has to support far too many people. Commute times skyrocket accompanied by rising real
estate prices.
Investors and companies start looking for alternative locations but are wary of moving out of the town.
Phase VII) Sustainability: After coming to a breaking point wherein a nearby locality starts becoming a location of choice for businesses.
The new locality has benefit of better‐planned infrastructure and lower cost.
It has advantage of being closer to a popular town.
Our current town shrinks in size and starts undergoing a change in character.
This phase involves higher municipal taxes and spending.
Affinity Factor Model
There are some characteristics that attract us to any locality within a city. Such preferences lead to clustering of similar people – though they never meet or interact with each other. Affinity factor model postulates a basic framework through which we can aggregate these factors.
1. Affinity factor is factor that attracts people to a residential location. a. Affinity factors exert a force that can be expressed similar to
gravitational force.
b. The force of attraction between an Affinity factor and a locality (neighbourhood) is directly proportional to importance of factor and inversely proportional to the square of distance between them.
c. Since there is no documentation and calculation of affinity factors, we cannot surely say if we should use distance or square of distance as in Newton’s law of gravitation.
d. The ultimate preference of location is a vector sum of all the attraction forces acting on the locality.
2. The evaluator relatively sets importance.
a. A single worker tends to set higher weight for proximity to workplace.
b. Parents tend to set higher weight for proximity to schools. c. Cities located near water bodies tend to value waterfronts. d. Importance is also accretive.
i. A business district employing larger numbers gets higher importance.
ii. The importance also increases if composition of businesses is more diverse.
3. Distance here is actually “commute” rather than actual distance.
a. Commute is actually the distance one can travel in acceptable travel time.
b. For workplace it is the commute to workplace.
c. For school it is function of child’s commuting time + commute time between nearest parent’s workplace and school. The second part reduces, as kids get older.
4. Affinity factors can be of various types:
a. Natural factors, e.g. beach, hill, lakefronts, special parks, etc.
b. Man‐made e.g. parks, gardens, palaces, churches, temples, town squares, etc.
c. Leisure driven, e.g. football clubs, golf courses, etc. d. Convenience based e.g. work place, school, etc. e. Safety based
i. Physical safety – swamp, landslide‐prone, etc
ii. Social safety – good neighbours, walk‐safe routes to stations, bus stops etc.
Concept of Commute
It is important to understand what I mean by “commute” in little more detail.
1. Commute refers to distance travelled in acceptable travel times. 2. Acceptable travel time changes over time as city grows.
a. In mega‐cities the times are higher than 30mins (one way) journey often reaching 90mins (one way).
b. Smaller cities tend to have 10 to 15 mins (one way) journey times are normal.
c. Journey is by car or public transport and some 5‐10min time is often added to walk to and from station or bus‐stops.
3. The distance travelled in the commute time changes dramatically with improving infrastructure. So metro rail, rapid transit systems allow people to travel further in the same time.
4. The distance variable is interpreted
a. Based on certainty of commute time: A 30‐min drive (average time) through safe lonely roads is preferred over 30‐min drive through mostly crowded roads.
b. Based on safety: A 45‐min drive through absolutely safe roads is preferred over 20 min drive through disturbed neighbourhoods.
Dispersion development and Subsequent Affinity factor development
Dispersion development is the understanding of how population settles given the Affinity factors existence. Subsequent Affinity factor development is a function of the existing and planned settlement. These two phenomena compliment each other iteratively. The overall development is thus fractal in nature.
Dispersion Development helps us understand which areas will see house price rise. It can help predict median prices in a locality. It can definitely predict relative price ranks between localities or neighbourhoods.
Subsequent affinity factor development is dependant on dispersion at the time. This helps understand practical questions. We can predict where a company will relocate its office. We can predict if new business district will be successful or not. We can even design strategy to make it a success.
Dispersion development
The Affinity factor model drives how the dispersion of the city occurs. Dispersion forces radiate out of affinity factor like, business districts (or workplaces) that are first affinity factor. Such dispersion forms areas based on commutes. The innermost circle, representing shortest commutes, develops first.
Single Affinity‐Factor dispersion
We can see a good example of such one‐factor influenced development at industrial townships or settlements around as single manufacturing plant. Here commutes are often as low as 10 mins.
The development starts closer to factory gates as this minimizes commute time (even in this small scale). Development eventually moves outward gradually in a circular fashion. The concentric circles represent commutes.
Now if we add a connection, say a road or metro link then we influence the dispersion. Dispersion around the Affinity Factor is higher along this connection as commutes are easier along the road or metro lines. The dispersion is now skewed along the road or metro line. The shaded area represents the new dispersion.
However, rarely do we have such single factor examples in real life. Usually as additional factors get introduced we start getting skewed distributions. Fully formed cities are examples of multiple affinity‐factor driven settlements.
Multiple Affinity factor development
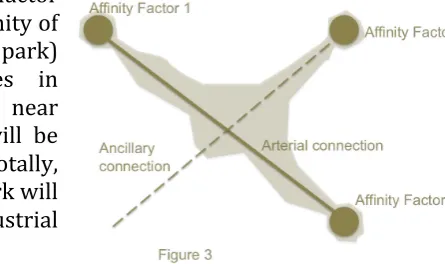
We can therefore extrapolate the dispersion in multifactor localities. As mentioned, the Affinity factors forces are vector additions and various combinations can be worked upon based on type of Affinity factor and commutes.
Alongside we have shown an example of 3 factor dispersion (shaded) with main road (arterial connection) and an
Subsequent Affinity Factor Development
Just as Affinity factors influence dispersion, dispersion also influences new developments. This refer to development of new business districts or expansion of existing business districts or development of other Affinity factors. This means based on current location (home and workplace) of population we can predict what areas are more likely to be the next business districts.
There exists between Affinity Factors and dispersion an interdependence. The fractal nature (iterative with simple rules) of development possibly causes this.
The interdependence is breakable and initiating a new Affinity Factor usually creates forces of distortion. This new affinity factor has to be a high importance factor and cannot simply be a park or garden. Usually, new airport, new business district (Canary Wharf e.g.) has the potential. Still, such new factors take longer to pay‐back for investors.
Impact of zoning and other regulations
Some practical observations and insights
Now let us use the concepts above and distil them into practical applications. These should help real estate brokers, developers, investors and users to understand development better. I have included price understanding separately. I would love to hear examples reinforcing or contradicting these observations.
Where will a new office be located?
Imagine a company that has to shift its office. The new office, ideally, should be located so that it is convenient for employees, customers and suppliers to reach. So it follows that if we construct importance and spread of employees, customers and suppliers we can find the optimum location. This gives us a neat logic for why businesses often seen clustered around a location. So we can infer the following:
1. The importance of top management residential dispersion is higher and in some cases it is only thing that matters.
• The office location is mostly the most convenient location for top management (or key decision makers).
• This results in most offices locating closer to prestigious residential areas resulting in longer commutes for most of the employees.
2. Existing companies give good indication where offices might be located
• If a new metal company wants to set up office, it will prefer an area where lot of metal companies are already thriving.
• Old, established metal companies might choose to pioneer a new location based on its brand value.
3. This explains the presence of shop clusters along various streets in cities for unbranded, un‐malled or speciality goods.
• Certain areas are famous for certain goods, clothes are best found in particular areas.
• Branded goods are easily available in malls (hence malled!). Singapore’s Mall street (or Orchard road) is a good case study for retail malls and location.
Setting up new business districts
Success of new business districts is defined by convenience of commute for top management. The top management prefer to stay in prestigious residential areas; so new business district must be accessible from such areas. Therefore, we can infer the following:
1. If it takes more time to reach the new business district then its success odds are lower.
• The travel time is measured from key decision maker residential areas and employee residential areas
• Even here it has to offer lower rentals, higher floor plates, additional conveniences like more parking per seat, more visitor parking etc.
3. If connection to the new business district runs through congested, low‐ income areas the odds of success decrease.
• Fortunes of ailing business districts can drastically change by developing new connections (roads, rails, metro etc.) to top residential areas.
Influence of airports
New airports are often located outside the cities where the aircraft noise will not disturb citizens. Yet curiously, the residential areas eventually come up close to airports. There is a reason. The administration usually builds a fast‐lane highway or high‐speed train to the airport directly from business district. This cuts the commute time significantly. Soon we find that it is easier and faster to commute from airport than our congested residential neighbourhood. Naturally the residential development moves closer to airport.
Therefore, whenever a new airport is developed with a high‐speed connectivity then real estate investment along the connection become lucrative.
1. If the connection is a metro then it makes sense to buy land near the metro stations. Initially the high‐speed train has no stops in between. However eventually normal metro trains run along that line and those stop at in‐between areas.
2. If the connection is a road then red‐lights or signals are best place to make investments. Signals on this road indicate importance and therefore easier exit.
3. If there are two connections then land between them and towards the airport is of prime significance.
4. Logically it may appear that near‐airport lands are best used for hotels and other tourist infrastructure. But there is lot of residential development as well and it is not limited to low‐income housing.
Determining Real Estate prices & development
Understanding price is very difficult exercise. The complexity is result of twin tracks upon which price depends. Price varies spatially and over time.
In my experience it is better to understand fundamental price variation across the city. Then we need to understand how fundamental prices change over time. And finally, we superimpose adjustments for Real Estate industry cycle and economic cycles.
Spatial distribution
Spatial distribution is easily determined using Affinity Factor model. The Affinity Factor model gives us lines of influence adding at a location. This is a vector addition implies the result has a value and direction. The value can be used to understand relative prices across localities / neighbourhoods. The direction tells us, indicatively, what Affinity Factor is most influential and hence what could be fundamental price level. The relative ranking of neighbourhoods is constant in short term and changes only gradually over decades.
Let us revisit the multiple affinity factor diagram. Here the prices in proximity of Affinity factor 1 (say industrial park) will be determined by wages in industrial park. Similarly prices near Affinity factor 2 (say IT park) will be influenced by IT salaries. Anecdotally, the fundamental prices near IT park will be higher than those around Industrial park.
However, the prices at the central intersection will derive from all three factors. Further, if Affinity Factor 3 is a golf course residential community then prices around that will be driven by highest income earners amongst all three factors.
Changes to fundamental prices over time
We now need to understand changes in fundamental prices over time. This is a function of median income in the
[image:12.595.268.491.349.481.2]business district and neighbourhood. Typically the median income and fundamental price follow the path indicated in figure 4. This depicts the price changes in single Affinity factor model.
drop happens as migrant population comes in to stay around the factor. This population is dependant on residents and therefore has lesser income than residents. If township planning is done properly, new growth opportunities emerge leading to growth in incomes and therefore fundamental prices.
Actual Price movement
Actual price is result of certain factors weighing in on the fundamental price. Fundamental prices are easier to defend even in downturns and form some sort of floor for prices in the area. However any decision related to real estate investment must consider future actual prices. Following are the factors that affect actual prices:
1. Loan to value ratio of banks: Banks give certain part of house value as loan. The rest amount comes from individual / household savings. For same down payment, changes in LTV impact affordable house price drastically.
• E.g. If down payment is $10,000 then at 90% LTV person can afford house of $100,000. But if bank changes down payment to 80% then affordable house price is just $50,000. So 10% change in LTV create affordability swing of 50%. This does impact prices. 2. Interest Rate Scenario: If people believe interest rates will continue to
remain stable on lower side then house prices tend to increase.
3. Policy intervention: Government can give tax breaks and incentives that may impact the prices.
4. Income profile changes: Overall income profiles may change as type of business in the business district changes. This is creeping change and takes longer time.
5. Business cycles: The changes also depend upon where we are in economic cycle and real estate industry cycle.
Thoughts on development of townships
It occurs that development of towns should follow flow‐based design similar to safety design of stadium or amphitheatre etc where flow of people and materials is central design criteria.
In a city there are four types of people as we describe below. The term “worker” here includes business owners, free lancers etc. We simply want to understand the movement of people in and around the city. The classification has no relation to income differences. The four types are:
1. Primary workers: This comprises two types:
a. Firstly the people who work in the business district. They are the central work force of the city. They are the ones who man the computer terminals or factory machines.
b. Then there are people who actively support the dependant population. Teachers, health‐care workers etc. are included here. 2. Secondary Workers: These support the primary workers around the
business district.
a. They man the restaurants, convenience shops, malls etc. in the business district.
b. They also support through mail, courier (FedEx, UPS etc).
3. Tertiary Workers: They support primary and secondary workers around residential premises and business district.
a. They do housekeeping at business district after it closes.
b. They also critically support the primary and secondary workers helping them before they go to work or after they return from work. E.g. Metro train operators, airlines, house‐help, baby‐sitters, taxi operators, police, etc.
4. Dependant Population: This includes school (including high‐school) children and senior citizens.
Flow of people
The flow essentially takes place in following steps every day.
1. Tertiary Workers movement to residential area before primary and secondary workers can leave for work.
2. Secondary Workers movement towards the business district before workers. At the same time Tertiary workers leave the business district. 3. Primary Workers movement towards business district
4. Business Activity flows towards and out of the business district. This represents clients visiting, people travelling, lunch delivery and other activity. Simultaneously, we have dependant movement in residential areas.
5. Secondary workers change shifts at business district (for evening coffee) 6. Tertiary workers change shifts in residential areas for end‐of‐day
7. Secondary workers go home and Tertiary workers move to business district.
Flow of material
The material flow is logically fitting with people flow. Material delivery capacity has to be allocated so that goods and material may flow in and out of the place.
• The usual material required at business district is transported before the business district opens or after it closes.
• Secondary workers usually handle this activity. Same is the case for material support for dependants.
• This does not impose stress on material capacity of the area.
• Material requirements of residential areas are served during the day (when transporters cannot access business districts).
• Food and other time critical material (mail) moves into the business district during the working time. The infrastructure needs to be planned for this movement. Infrastructure implies:
• Parking for mail vans, food vans, food delivery people etc.
• Loading and unloading bays at offices and shops for above
• Some material delivery capacity (on roads and rail) is required to be reserved for medical and emergency services like fire, etc. This means even roads and walkways have to have safe‐access in case of emergency.
• Generally some capacity is required for moving construction machinery and materials as there is always some construction going on.
• This includes utilities (power, water, gas, telephones) lines maintenance, cement trucks (when time critical) etc.
• Construction equipment and heavy machinery is moved after hours.
• If the central Affinity Factor is a factory then there is high material movement and that requires separate connectivity routes.
Proposed Township model
Above ideas can be used to create an easy access township model. One such model could be as shown alongside. We draw a representative segment of a town – often called sector.
1. That is close to BD (Business district) and well connected from other residential areas. This is to reduce cost to LIG dwellers.
2. This is high‐density residential settlement.
3. No specific dependency ratio (workers to dependants). 4. High public transport frequency and options
MIG is middle‐income group residential area. 1. Accessibility is maintained
2. It is low‐density settlement. Further because of nature of cities there are less middle‐income group people as compared to LIG.
3. Dependency ratio is usually lesser than average.
4. Car or personal vehicles infrastructure in addition to high frequency public transportation.
a. Limited options for public transport are fine just the frequency should be high
b. Typically to LIG and BD
HIG refers to rich people residential area.
1. This is usually located around a leisure factor like beach‐fronts, lake‐ fronts etc.
2. Very low density settlement comprising large properties. 3. Dependency ratio is high.
4. Better automobile or personal vehicle infrastructure is required.
a. Additionally, high frequency public transportation is required as there is lot of tertiary work force supporting this area.
b. Direct high speed highway to business district is required
c. Public transportation is required to LIG (high frequency) and MIG (medium to low frequency is fine)
Notes and Disclaimers
The ideas presented in this paper are from my experience and observations. They suggest possible principles at work. These have helped me understand real estate prices, land‐use, success rates etc.
I welcome suggestions and testing of these principles and look forward to working on them. I will continue to change modify or alter the theories based on further experience or research. Users should exercise caution while studying the principles. If in doubt please email me at [email protected]
The paper and contents can be shared for non‐commercial use as per creative commons licence detailed above.
About Rahul Deodhar
Rahul is an investor and an author. He has over 10 years experience spanning manufacturing, consulting, investment banking firms. He has advised a wide range of clients including Fortune 500 companies, banks, hedge funds and private equity funds among others.
He is interested in the changing equations of value, the next chapter of wealth creation and its implication. His interests centre around four areas viz., investment management, economics, poverty alleviation and development of education.
Rahul is based in Mumbai. He is a mechanical engineering and MBA. A lot of his ideas are shared freely on his website and his blog. He can be reached at [email protected].
Links
www.rahuldeodhar.com