i
StatiSticS
at a Glance
1
about Forfás
Forfás is Ireland’s policy advisory board for enterprise, trade, science, technology and innovation. It provides independent and rigorous research, advice and support in the areas of enterprise and science policy. This work informs the Department of Jobs, Enterprise and Innovation and wider Government. Forfás works with IDA Ireland, Enterprise Ireland and Science Foundation Ireland to ensure the coherence of policies across the enterprise development agencies.
Forfás manages the work of and provides research and analytical support to:
Advisory Council for Science, Technology and Innovation
Expert Group on Future Skills Needs
National Competitiveness Council
table of contents
Section 1
Economic contExt and output
1.1 Economic Environment at a Glance, 2006-2012
1.2 GDP Growth of Main Trading Partners, 2009-2012
1.3 Number Employed and Unemployment Rate in Ireland, 2006-2011
1.4 Contribution of Net Exports to Irish Economic Growth, constant prices, 2004-Q2 2011
1.5 Services Exports, Growth Rate 2009-2010
1.6 Trade of Goods and Services, Outlook 2010-2012, Various Countries
1.7 Index of Manufacturing Output Volume and Services Exports, 2003-2010
1.8 Gross Value-Added, Persons Engaged and Number of Enterprises in Manufacturing in Ireland, by Ownership, 2009
3
Section 2
intErnational ExportS of GoodS and SErvicES
2.1 Ireland’s Merchandise and Services Exports, Value & Volume, Current Prices, 2001-2010
2.2 Exports of Agency-Assisted Companies as a share of total economy exports, current prices, 2001-2010
2.3 Composition of Ireland’s Goods and Services Exports, Current Prices, 2010
2.4 Destination of Ireland’s Goods and Services Exports, current prices, 2010
2.5 Ireland’s Goods Exports by Value, Constant Prices, 2001-2010
2.6 Composition of Ireland’s Goods Exports, Constant Prices, 2002-2010
2.7 Destination of Ireland’s Goods Exports, Current Prices, 2010
2.8 Composition and Geographical Distribution of Ireland’s Services Exports, current prices, 2010
Section 3
intErnational importS of GoodS and SErvicES
3.1 Ireland’s Merchandise and Services Imports, Value & Volume, Current Prices, 2001-2010
3.2 Composition of Goods and Services Imports, Current Prices, 2010
3.3 Origin of Ireland’s Goods and Services Imports, current prices, 2010
3.4 Composition of Ireland’s Goods Imports, Constant Prices, 2000-2010
3.5 Composition and Geographical Distribution of Ireland’s Services Imports, current prices, 2010
5
Section 4
dirEct invEStmEnt poSition
4.1 Index of Outward Direct Investment (ODI) Stock, 2000-2010
4.2 Ireland’s ODI Stock and Flow by Destination of Investment, 2010
4.3 ODI Stock, selected activities, 2010
4.4 Cumulative Stock of ODI as a Percentage of GDP, Selected Countries, 2007, 2010
4.5 Index of Foreign Direct Investment (FDI) Stock, 2000-2010
4.6 FDI Stock and Flow in Ireland by Location of Investor, 2010
4.7 FDI Stock, Selected Activities, 2010
Section 5
national ExpEnditurE on r&d – HEadlinE fiGurES
5.1 Gross Expenditure on R&D (GERD) – Ireland 2000-2010
5.2 Gross Expenditure on R&D (GERD) as a Percentage of GDP/GNP – Ireland, EU and OECD, 2000-2010
5.3 Gross Expenditure on R&D (GERD) as a Percentage of GDP/GNP – Ireland and Selected Countries
5.4 Performance of National R&D by Sector, 2003, 2009
5.5 Gross Expenditure on R&D (GERD) – Performers, 2009
5.6 (i) Government Budget Appropriations or Outlays on R&D (GBAORD) as a Percentage of GDP/GNP
7
Section 6
ExpEnditurE on r&d by SEctor: buSinESS, HiGHEr Education and public
6.1 Business Sector-Performed R&D (BERD) in Current and Constant Prices, 2003-2010
6.2 Business Sector-Performed R&D (BERD) as a Percentage of GDP/GNP, Ireland, OECD, EU27, 2000-2010
6.3 Business Sector-Performed R&D (BERD) by Industrial Sector, 2009
6.4 Distribution of Business Sector R&D (BERD) Expenditure by Size of Spend, 2005, 2009
6.5 Higher Education-Performed R&D (HERD) in Current and Constant Prices, Ireland, 2000-2009
6.6 Higher Education-Performed R&D (HERD) as a Percentage of GDP/GNP, Ireland, OECD and EU27, 2000-2009
6.7 Government Sector-Performed R&D (GovERD) – in Current and Constant Prices, 2000-2010
Section 7
r&d WorkforcE7.1 Total Researchers (FTE) per 1,000 Total Employment, Ireland, OECD, EU27, US, 2005, 2007, 2009
7.2 Total Researchers (FTE) per 1,000 Total Employment, Ireland and Selected Countries, 2009
7.3 Headcount of PhD and Other Researchers in the Business Sector, 2003-2009
7.4 (i) FTEResearch Personnel (Researchers plus Support Staff) by Sector of Employment, 2005, 2007, 2009
(ii) FTE Research Personnel (Researchers plus Support Staff) by Sector of Employment - Share of Total, 2009
(iii) FTE Research Personnel (Researchers plus Support Staff) by Sector and Category of Employment - 2009
7.5 (i) Total Headcount Research Personnel (Researchers plus Support Staff) by Sector and Gender - 2009
(ii) Percentage of Total Female Headcount Research Personnel (Researchers plus Support Staff) by Sector of Performance and Occupation, 2009
(iii) International Comparison of Women Researchers as a Percentage of Total Researchers (Headcount)
9
Section 8
innovation StatiSticS
8.1 (i) Innovation Activity Rate by Size of Enterprise, 2006-2008
(ii) Innovation Types by Sector and Size, 2006-2008
8.2 Sectoral Innovation Activity Rates, 2006-2008
8.3 (i) Percentage of Total Turnover Attributed to Product Innovation Activities, 2006-2008
(ii) Innovation Hampering Factors as a Percentage of Total, 2006-2008
Section 9
otHEr SciEncE and tEcHnoloGy indicatorS
9.1 Science and Engineering Scientific Articles per Million Population, 2007
9.2 (i) Triadic Patent Families Per Million Population, 2009
11
Introduction
Statistics at a Glance 2011 combines data on enterprise and R&D
statistics from publications by Forfás, the Central Statistics Office and other international bodies such as Eurostat, the OECD, EU Commission, WTO, UNCTAD, etc. It contains a summary of statistics on a number of areas relevant to the performance of the Irish enterprise sector including: the economic context, economy expenditure and output, Ireland’s international trade in goods and services, inward and outward foreign direct investment flows, as well as data on headline R&D figures, sectoral spend on R&D (business, higher education and public), the R&D workforce, innovation, and other STI indicators. The data cover various years/timescales, and in all cases the latest available data are used. The statistics in this booklet highlight some of the key trends in the activities of enterprises and R&D performers based in Ireland and help to describe how they are developing and changing over recent years. Some key messages that emerge from the data are summarised below.
The total direct expenditure in the Irish economy by firms supported by the enterprise agencies amounted to €35bn in 2010, with similar contributions from foreign and Irish-owned companies. The growth in business sector R&D (BERD) in 2009 was driven primarily by Irish-owned companies. BERD rose by 16.5 per cent from the 2007 level to €1.868 billion in 2009. However, estimates for 2010 indicate a levelling-off of R&D expenditure. This is the first time in more than a decade that BERD estimates are not expected to rise. A key finding in this year’s BERD relates to the shift in R&D away from manufacturing to the services sector.
Exports of goods and services performed very well in 2010. Exports of services rose by 10 per cent between 2009 and 2010, with a 5.9 percentage increase among merchandise exports; these increases follow on from significant declines in 2009.
13
and services’ import sectors in Ireland. Some categories of imports continued to experience decreased values in 2010 - the decrease in machinery and transport equipment was the highest in monetary terms and proportionately. In contrast to exports, the UK remains Ireland’s main source of goods’ imports, while the US continues to be the main origin of services’ imports.
Services contributed 91 per cent to total Irish ODI stock abroad in 2010. The level of FDI stock in Ireland has lagged growth rates in the world and the EU FDI over recent years.
Gross R&D spending in the government, higher education and business sectors of the economy has contracted by 2.6 per cent in current prices in 2010. The overall R&D intensity ratio is expected to reach 2.16 per cent of GNP in 2009, up from 1.43 per cent in 2006. This increase is expected to bring Ireland closer to the OECD and the EU-27 averages, although this ratio improvement has been assisted by the rapid decline in Gross National Product during 2008 and 2009.
Overall improvements in R&D spending continue to be a strong driver of innovation performance in the business sector. In 2008 44.9 per cent of firms were engaged in some form of technological innovation, with 42.6 per cent of firms engaged in some form of non-technological activity. About 40 per cent of small firms undertake some form of innovation, compared to 61 per cent of medium-sized firms and 76 per cent of large firms, while indigenous firms are, overall, less likely to engage in innovation than foreign-owned firms.
Looking at the individual sectors of R&D performance, business sector-performed R&D (BERD) rose to €1.83 billion in 2010, with the BERD intensity ratio expected to grow to 1.47 per cent of GNP in 2010 from 0.95 per cent in 2006 so that it now exceeds the EU-27 average of 1.17 per cent, but falls just short of the OECD average of 1.63 per cent. The business sectors performing the largest percentage of R&D are the manufacturing
sectors (39.8 per cent of total BERD), and information and communication services (26.1 per cent).
Expenditure on R&D in the higher education sector (HERD) rose to an estimated €829 million in 2009. The HERD intensity ratio (HERD as a per cent of GNP) is now 0.63 per cent which is above the OECD (0.4 per cent) and EU-27 averages (0.46 per cent).
Total expenditure on R&D performed in the State sector (GOVERD) fell to €131 million in 2010 (including R&D
performed in hospitals). The anticipated GOVERD/GNP intensity ratio for 2010 is 0.1 per cent; this remains considerably below the EU and OECD averages (0.26 per cent).
15
Section 1
Economic context and output
1.1 Economic Environment at a Glance, 2006-2012
1.2 GDP Growth of Main Trading Partners, 2009-2012
1.3 Number Employed and Unemployment Rate in Ireland, 2006-2011
1.4 Contribution of Net Exports to Irish Economic Growth, constant prices, 2004-Q2 2011
1.5 Services Exports, Growth Rate 2009-2010
1.6 Trade of Goods and Services, Outlook 2010-2012, Various Countries
1.7 Index of Manufacturing Output Volume and Services Exports, 2003-2010
1.8 Gross Value-Added, Persons Engaged and Number of Enterprises in Manufacturing in Ireland, by Ownership, 2009
SECTION 1
1.1 Economic Environment at a Glance, 2006-2012
2006 2007 2008 2009 2010 2011 (f) 2012(f)
GDP, € million 178,297 189,933 179,990 160,596 155,992 155,699 159,087 Personal
consumption change %
6.7% 6.4% -1.1% -6.9% -0.8% -2.6% -0.8%
Investment
change % 4.5% 2.9% -10.2% -28.7% -24.9% -9.2% -0.5% General
Government (Exchequer) Balance as % of GDP
3.0% 0.1% -7.3% -14.2% -32.0% -10.0% -8.6%
Current account as % of GNP
-4.1% -6.2% -6.6% -3.6% 0.6% 0.4% 2.5%
Note: (f) forecast
Source: CSO National Income and Expenditure, September 2011; Central Bank of Ireland Quarterly Bulletin, Q4, October 2011; Department of Finance Budgetary and Economic Statistics, September 2011.
1.2 Gdp Growth of main trading partners,
2009-2012
% change 2009 2010 2011 (f) 2012(f)
Ireland -7.0% -0.4% 1.0% 1.8%
Euro area -4.1% 1.8% 1.6% 1.1%
UK -4.9% 1.3% 1.1% 1.6%
US -2.7% 3.0% 1.5% 1.8%
World Growth -0.9% 5.1% 4.0% 4.0%
17
1.3 number Employed and unemployment rate in
ireland, 2006-2011
2006 2007 2008 2009 2010 2011 (f)
Employment (Q1 for each year, '000s)
2,009 2,089 2,124 1,966 1,858 1,821
Unemployment
rate (%) 4.4 4.6 6.3 11.8 13.6 14.3 Unemployment
(seasonally adjusted, Q1 for each year, '000s)
93.5 98.9 110.4 223.0 275.3 304.5
Live register (month of May for each year, '000s)
394.1 437.9 440.9
SECTION 1
1.4 contribution of net Exports to irish Economic
Growth, constant prices
1, 2004-Q2 2011
-12.0% -7.0% -2.0% 3.0% 8.0%
2004 2005 2006 2007 2008 2009 2010 Q2 2011
Private
Consumption PublicConsumption Investment
Net Exports
Source: CSO Database Direct, National Accounts, Forfás calculations
Private
Consumption ConsumptionPublic Investment Net Exports GDP
2004 2.2% 0.4% 1.5% 0.3% 4.5%
2005 3.5% 0.7% 3.4% -2.3% 5.3%
2006 3.6% 0.9% 1.7% -0.8% 5.3%
2007 4.5% 0.1% -0.4% 0.9% 5.2%
2008 -3.7% 0.3% -0.7% 1.1% -3.0%
2009 -1.7% -0.1% -9.0% 3.9% -7.0%
2010 -0.4% -0.7% -3.1% 3.7% -0.4%
19
1.5 Services Exports, Growth rate 2009-2010
-12.1% -8.3% -6.2% -2.5% 1.0% 1.4% 4.6% 5.4% 5.5% 6.4% 7.5% 7.7% 7.8% 7.9% 8.2% 8.2% 8.5% 8.5% 9.8% 10.0% 12.2% 13.8% 14.3% 17.2% 17.4% 18.6% 19.4% 22.7%
-0.15 -0.1 -0.05 0 0.05 0.1 0.15 0.2 0.25
Netherlands Romania Finland Slovakia Latvia Slovenia Austria France Greece Spain Bulgaria Estonia UK Portugal Germany Italy EU27 Hungary Belgium Ireland Czech Republic Denmark Sweden Lithuania Luxembourg Poland Malta Cyprus
20
SECTION 1
1.6 trade of Goods and Services, outlook
2010-2012, various countries
8
5.2
6.6 6.5 5.7 6.5 6.0 7.5 9.3 6.2 4.0 7.5 7.2 5.1 7.0 6.1 2.5 9.3 5.9 0 1 2 3 4 5 6 7 8 9 10
% change, volume
Exports 2012 Imports 2012
Source: EU Commission, European Economic Forecast, Spring 2011.
2010 2011 2012
% change, volume Exports Imports Exports Imports Exports Imports
Ireland 9.4 6.6 6.0 3.2 5.2 4.0
France 10.5 8.2 6.7 6.8 6.6 7.5
Germany 14.1 12.6 7.6 7.5 6.5 7.2
Italy 9.1 10.5 6.0 4.6 5.7 5.1
Luxembourg 6.3 6.7 6.8 8.0 6.5 7.0
Netherlands 10.9 10.5 6.4 5.8 6.0 6.1
UK 5.3 8.5 8.9 4.0 7.5 2.5
USA 11.9 12.7 7.8 6.7 9.3 9.3
21
1.7 index of manufacturing output volume and
Services Exports, 2003-2010
8
0 20 40 60 80 100 120 140 160 180
2003 2004 2005 2006 2007 2008 2009 2010
2005=100
Services Exports Modern Manufacturing Other Manufacturing
Source: CSO, Industrial Production and Turnover, April 2011; Balance of International Payments, June 2011
Base year = 2005 2003 2004 2005 2006 2007 2008 2009 2010
Services Exports 77 88 100 118 141 144 139.2 153.1
Modern
Manufacturing2 95 95 100 104 111 120 113 124.7
Other
22
SECTION 1
1.8
Gross value added
3, persons Engaged
4and
number of Enterprises in manufacturing in
ireland, by ownership, 2009
8 0 20 40 60 80 100 120 140 160 180
2003 2004 2005 2006 2007 2008 2009 2010
2005=100
Services Exports Modern Manufacturing Other Manufacturing
0% 20% 40% 60% 80% 100%
Gross Value Added in Manufacturing, '000
Persons Engaged
in Manufacturing Number of Enterprises
Ireland United Kingdom Germany Other EU27
United States Other countries
Source: CSO, Census of Industrial Production, 2009.
Country of Ownership
Gross Value Added in Manufacturing, €’000 Persons Engaged in Manufacturing Number of Manufacturing Enterprises
Ireland 4,759,371 90,511 4,018
United Kingdom 699,766 7,171 53
Germany 449,156 6,350 58
Other EU27 1,576,992 10,105 84
United States 20,986,312 51,941 188
Other countries 1,145,301 8,137 48
23
1.9 value added (va)
5and direct Economy
Expenditure (dEE)
6of agency assisted
7firms
by sector, current prices, 2010
8
5,000 10,000 15,000 20,000 25,000
Computer Prog.,
Consult. & Related
Activities Chemicals Computer
,
Electronic &
Optical Products
Food/Drink/
Tobacco
Financial Services Other Misc. Manu & Medical Devices
Business,
Education & Other
Services Other
Million
Irish-Owned Companies VA Foreign-Owned Companies VA
Irish-Owned Companies DEE Foreign-Owned Companies DEE
SECTION 1
1.9 Continued
Million €
Irish-Owned Companies VA Foreign-Owned Companies VA Irish-Owned Companies DEE Foreign-Owned Companies DEE
Computer prog., consult. &
related activities 807 18,697 797 7,970 Chemicals 119 19,531 219 2,870
Computer, electronic &
optical products 356 4,385 328 1,440 Food/Drink/ Tobacco 3,104 2,133 8,374 1,238
Financial services 1,309 1,541 384 626
Other misc. manu & medical
devices 233 3,703 386 2,035 Business, education & other
services 2,096 347 1,594 94 Other 3,152 2,407 4,914 1,681
Energy, water, waste &
construction 890 - 1,810 - Machinery & equipment 304 396 424 304 Non-metallic minerals 341 107 623 75 Basic & fabricated metal
products 421 189 562 187 Textiles, clothing, footwear
& leather 80 15 104 14 Wood & wood products 103 19 308 135 Paper & printing 222 94 293 92 Rubber & plastics 225 497 265 216
Electrical equipment 107 276 150 207
Transport Equipment 44 291 39 212
Publishing, broadcasting &
telecommunications 174 42 182 19 Other IT & computer services 238 481 155 220
25
Section 2
international Exports of Goods and Services
2.1 Ireland’s Merchandise and Services Exports, Value & Volume, Current Prices, 2001-2010
2.2 Exports of Agency-Assisted Companies as a share of total economy exports, current prices, 2001-2010
2.3 Composition of Ireland’s Goods and Services Exports, Current Prices, 2010
2.4 Destination of Ireland’s Goods and Services Exports, current prices, 2010
2.5 Ireland’s Goods Exports by Value, Constant Prices, 2001-2010
2.6 Composition of Ireland’s Goods Exports, Constant Prices, 2002-2010
2.7 Destination of Ireland’s Goods Exports, Current Prices, 2010
2.8 Composition and Geographical Distribution of Ireland’s Services Exports, current prices, 2010
26
SECTION 2
2.1 ireland’s merchandise and Services Exports, value
& volume, current prices, 2001-2010
Source: World volumes from WTO International Trade Statistics 2009. Irish data from CSO, StatBank.
Million € 2001 2002 2003 2004 2005 2006 2007 2008 2009 2010 CAGR8
2006-2010
Services Exports,
value 28,562 31,589 37,133 42,424 48,219 57,069 67,960 67,947 67,134 73,837 8.90%
of which
IFSC9 5,727 8,303 9,131 14,546 14,122 20,137 21,157 20,669 19,062 20,428 7.66%
Merchandise
Exports, value 92,690 93,675 82,076 84,410 86,732 86,772 89,226 86,394 84,239 89,193 0.56%
Total Exports 121,252 125,264 119,209 126,834 134,951 143,841 157,186 154,341 151,373 163,030 3.85%
Volume Index, base
= 2000 2001 2002 2003 2004 2005 2006 2007 2008 2009 2010
Irish Merchandise
Exports Volume 105 108 104 111 114 114 120 121 117 121
8 100 110 120 130 140 150 160 0 20,000 40,000 60,000 80,000 100,000 120,000 140,000 160,000 180,000
2001 2002 2003 2004 2005 2006 2007 2008 2009 2010
Merchandise Volume, Base = 2000
Million
27
2.2 Exports of agency-assisted companies as
a share of total economy exports, current
prices, 2001-2010
8
2010
2001 2002 2003 2004 2005 2006 2007 2008 2009
0 20 billion 40 60 80 100 120 140 160 180
Exports of foreign owned agency assisted firms Exports of indigenous agency assisted firms Exports of non-agency assisted firms
Source: CSO, External Trade and Balance of Payments data and Forfás, Annual Business Survey of Economic Impact (ABSEI), 2010
2000 2001 2002 2003 2004 2005 2006 2007 2008 2009 2010 CAGR8,
%, 2005-2010
Total economy
exports 150,563 121,253 125,264 119,209 126,834 134,951 143,841 157,186 154,341 151,373 163,030 3.85%
Total agency-assisted company exports
82,391 87,756 91,152 93,095 95,489 101,723 121,996 130,224 134,403 122,632 126,994 4.54%
Total indigenous agency-assisted company exports
8,966 9,026 8,692 8,685 8,943 9,663 10,753 12,624 12,368 10,786 12,369 5.06%
Percentage
manufacturing 82.7% 80.8% 82.5% 80.7% 77.6% 75.6% 76.3% 75.9% 75.4% 72.0% 73.7%
Percentage
SECTION 2
2.3 composition of ireland’s Goods and Services
Exports
10, current prices, 2010
2% 4% 5% 17% 14% 4% 4% 7% 32%
6% 5% Tourism and travel
Financial services Insurance Computer services Business services Other services exports Food and live animals Machinery & transport equipment Chemicals and related Products nes Miscellaneous manufactured articles Other merchandise exports
Source: CSO, StatBank and External Trade Bulletin June 2011.
Million € 2003 2004 2005 2006 2007 2008 2009 2010
Tourism and travel 3,409 3,536 3,863 4,258 4,426 4,287 3,506 3,075 Financial services 3,365 4,267 4,850 6,214 7,440 6,595 5,794 5,978 Insurance 7,691 7,821 6,909 8,738 8,799 8,155 7,300 7,777 Computer services 12,575 15,100 15,755 18,298 21,726 23,876 24,352 28,186 Business services 6,957 8,439 13,072 15,399 20,571 20,047 20,901 22,333 Other services
exports 3,136 3,261 3,770 4,162 4,998 4,987 5,277 6,488 Food and live
animals 5,779 6,063 6,380 7,034 7,603 7,085 6,271 6,982 Machinery &
transport equipment 23,521 22,935 22,710 23,186 21,806 18,365 13,585 11,001 Chemicals and
related products nes 35,785 37,492 40,421 39,696 43,069 44,225 47,988 52,226 Miscellaneous
manufactured
articles 9,457 9,910 9,066 8,651 8,489 8,902 9,190 10,475 Other merchandise
29
2.4 destination of ireland’s Goods and Services
Exports
11, current prices, 2010
8
9,136 9,199
8,854 8,834 9,091
9,812 10,986 12,930 12,589 11,514 8000 9000 10000 11000 12000 13000 14000
2000 2001 2002 2003 2004 2005 2006 2007 2008 2009
million - 5,000 10,000 15,000 20,000 25,000 30,000 35,000 UK
Belgium Germany France Italy
Netherlands Spain
Other EU USA
Switzer land Other
countries
million
Services Goods
Source: CSO, External Trade Bulletin (March 2011), CSO, Services Exports and Imports (September 2011), and CSO, StatBank
€ million Goods Services Total % of Total
UK 13,768 14,395 28,163 17%
Belgium 12,819 1,341 14,160 9%
Germany 7,215 7,760 14,975 9%
France 4,493 5,109 9,602 6%
Italy 2,713 4,204 6,917 4%
Netherlands 3,093 3,422 6,515 4%
Spain 3,362 2,350 5,712 4%
Other EU 4,294 6,703 10,997 7%
USA 20,763 5,234 25,997 16%
Switzerland 3,557 1,752 5,309 3%
Other countries 13,116 21,567 34,683 21%
30
SECTION 2
2.5 ireland’s Goods Exports by value, constant
prices
12, 2001-2010
8 72,000
70,000 74,000 76,000 78,000 80,000 82,000 84,000 86,000 88,000 90,000
2001 2002 2003 2004 2005 2006 2007 2008 2009 2010
Million
31
2.6 composition of ireland’s Goods Exports,
constant prices
13, 2002-2010
8 0 10,000 20,000 30,000 40,000 50,000 60,000 70,000 80,000 90,000 100,000
2002 2003 2004 2005 2006 2007 2008 2009 2010
Million
Machinery (SITC 7)
Manufactured Goods Classified by Material (SITC 6) Chemicals (SITC 5)
Food, Beverages and Other Animal Products (SITC 0+1+4) Other (SITC 2+3+8+9+U)
SECTION 2
2.6 Continued
SITC14
Product Groups Section
Million € 2002 2003 2004 2005 2006 2007 2008 2009 2010
0 Food and live animals 4,877 5,351 5,830 6,105 6,738 7,461 7,230 6,340 6,899
1 Beverages and tobacco 846 1,025 997 1,056 1,302 1,381 1,262 1,091 1,190
2 Crude materials, inedible, except
fuels 728 801 953 1,031 1,430 1,510 1,340 983 1,426
3 Mineral fuels, lubricants and
related products 305 186 384 590 539 674 849 601 1,015
4 Animal and vegetable oils,
fats and waxes 22 29 24 18 19 27 42 20 27
5 Chemicals
15 and related products
nes 32,963 33,135 36,050 38,680 38,023 42,266 45,128 48,521 51,606
6
Manufactured goods classified chiefly by material
1,625 1,659 1,747 1,679 1,642 1,784 1,695 1,257 1,434
7 Machinery & transport
equipment 27,992 21,779 22,053 21,732 22,209 21,400 18,739 13,736 10,870
8 Miscellaneous manufactured
articles 6,991 8,756 9,529 8,676 8,286 8,331 9,084 9,292 10,351
9
Commodities and transactions not classified elsewhere
2,700 3,273 3,595 3,432 2,922 2,728 2,022 2,491 2,679
U Unclassified - - - - 6 0 0 - -
33
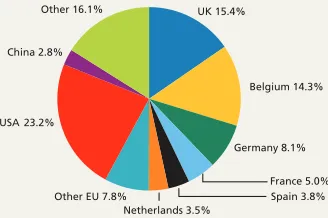
2.7 destination of ireland’s Goods’ Exports,
current prices, 2010
8
UK 15.4%
Belgium 14.3%
Germany 8.1%
France 5.0% Spain 3.8% Other EU 7.8%
USA 23.2% China 2.8%
Other 16.1%
Netherlands 3.5%
[image:35.298.75.239.69.178.2]Source: CSO, External Trade Bulletin, March 2011. Note: at the time of writing updated data on the breakdown of exports by destination was unavailable, resulting in the total value of goods exports differing from table 2.1.
Million €
2010 CAGR 2006-2010
UK 13,768 -2.97%
Belgium 12,819 -2.53%
Germany 7,215 1.05%
France 4,493 -2.88%
Spain 3,362 0.79%
Netherlands 3,093 -2.03%
Other EU 7,008 -4.36%
USA 20,763 6.37%
China 2,502 29.99%
34
SECTION 2
2.8 composition and Geographical distribution
of ireland’s Services Exports, current prices,
2010
8 0
5,000 10,000 15,000 20,000 25,000 30,000 35,000 40,000
UK Other Europe USA Asia Other Regions Not
Geographically Allocated
Million
Communications Other Royalties/Licences
Transport Financial Services Insurance
Business Services Computer Services Tourism & Travel
35
2.8
Continued
Million €
Other
Europe UK USA Asia RegionsOther
Not
Geograph-ically
Allocated Total
Total 35,615 14,395 5,234 7,052 5,287 6,254 73,837
% of total
Services Exports 48.2% 19.5% 7.1% 9.6% 7.2% 8.5% 100.0% % CAGR 2005
and 2009 11.9 4.1 6.1 15.1 7.8 52.5 11.2
Million €
Other
Europe UK USA Asia
Other Regions
Not
Geograph-ically
Allocated Total
% share 2008
CAGR, %,
2005-2009
Communications 147 183 26 9 32 152 549 0.7 6.2
Other 47 340 120 24 28 81 640 0.9 2.4
Royalties/
Licences 572 103 * * * 137 1695 2.3 28.4
Transport 1,271 2,092 161 * 11 70 3605 4.9 14.0
Financial
Services 2,505 1,443 731 476 669 154 5978 8.1 5.4
Insurance 3,747 1,923 1239 218 591 59 7777 10.5 3.0
Business
Services 9,285 3,287 1615 3010 2,204 2933 22334 30.2 14.3
Computer
Services 20,051 3,933 * 3085 * 2401 28186 38.2 15.7
Tourism & Travel 988 1,094 531 134 53 275 3075 4.2 -5.5
36
SECTION 2
2.9 Share of total Extra- and intra-Eu27 Goods
and Services Exports, current prices, 2006
and 2010
8
Share 2010 Share 2006
0.1% 0.2% 0.2% 0.2% 0.4% 0.4% 0.5% 0.9% 0.9% 1.0% 1.1% 1.3% 1.4% 1.7% 2.3% 2.3% 2.9% 3.1% 3.2% 3.3% 5.5% 7.3% 8.1% 9.6% 9.9% 10.0% 22.3%
0% 5% 10% 15% 20%
25% Malta Cyprus Latvia Estonia Lithuania Bulgaria Slovenia Romania Greece Slovakia Portugal Luxembourg Finland Hungary Czech Republic Denmark Poland Austria Ireland Sweden Spain Belgium Italy United Kingdom France Netherlands Germany
37
Section 3
international imports of Goods and Services
3.1 Ireland’s Merchandise and Services Imports, Value & Volume, Current Prices, 2001-2010
3.2 Composition of Goods and Services Imports, Current Prices, 2010
3.3 Origin of Ireland’s Goods and Services Imports, current prices, 2010
3.4 Composition of Ireland’s Goods Imports, Constant Prices, 2000-2010
3.5 Composition and Geographical Distribution of Ireland’s Services Imports, current prices, 2010
38
SECTION 3
3.1 ireland’s merchandise and Services imports,
value & volume, current prices, 2001-2010
8 40,000 80 90 100 110 120 130 140 150 0 20,000 60,000 80,000 100,000 120,000 140,000
2001 2002 2003 2004 2005 2006 2007 2008 2009 2010
Merchandise Volume Index, Base = 2000
Million
Services Imports Value Merchandise Imports, Value Irish Merchandise Imports Volume World Merchandise Imports Volume
Source: World volumes calculated from WTO Time Series Database; Irish data from CSO, Balance of Payments Quarter 1, June 2011 and External Trade Bulletin October 2011.
Million € 2001 2002 2003 2004 2005 2006 2007 2008 2009 2010
CAGR8
2006-2010
Services
Imports Value 41,822 45,370 48,223 52,625 57,521 63,867 69,081 74,574 75,186 80,931 6.10% Of Which: IFSC 5,966 5,581 9,692 8,908 12,557 12,955 13,657 12,613 13,403 1.64% Merchandise
Imports, Value 57,384 55,628 47,864 51,105 57,465 60,857 63,486 57,585 45,061 45,764 -6.88%
Total Imports 99,206 100,998 96,087 103,730 114,986 124,724 132,567 132,159 120,247 126,599 0.37% Volume Index
Base = 2000 2001 2002 2003 2004 2005 2006 2007 2008 2009 2010
Irish Merchandise Imports Volume
100 101 94 103 115 118 124 109 91 88
World Merchandise Imports Volume
39
SECTION 3
3.2 composition of Goods and Services imports,
current prices, 2010
26%
23% 10%
7% 6% 4% 5% 5%
4% 4%
3% 3% Business Services
Royalties/Licences
Machinery & transport equipment Chemicals and related products NES15 Other services
Tourism and travel
Miscellaneous manufactured articles Insurance
Mineral fuels, lubricants and related products Food and live animals
Other merchandise imports
Manufactured goods classified chiefly by material
Note: total of breakdown differs from total imports figure in 3.1
SECTION 3
3.2 Continued
Million € 2002 2003 2004 2005 2006 2007 2008 2009 2010
Business services 20,517 19,472 22,146 25,313 26,203 28,674 29,700 29,876 32,279 Royalties/licences 11,697 14,208 15,169 15,482 17,534 18,621 24,275 25,148 28,533 Machinery
& transport equipment
28,317 20,732 21,964 25,002 25,571 25,379 20,049 14,292 12,324
Chemicals and related products NES15
6,922 6,897 7,140 7,419 7,964 8,127 8,282 7,372 8,758
Other services 5,027 4,808 5,087 5,852 7,445 8,353 8,301 7,679 8,174 Tourism and travel 3,942 4,188 4,184 4,898 5,446 6,300 7,046 6,287 5,826 Miscellaneous
manufactured articles
6,116 6,303 6,332 7,086 7,360 7,610 6,861 6,122 6,153
Insurance 4,187 5,547 6,039 5,976 7,239 7,133 6,295 6,196 6,119 Mineral fuels,
lubricants and related products
1,932 1,969 2,814 4,020 4,719 5,728 6,595 4,445 5,608
Food and live
animals 3,157 3,160 3,273 3,681 4,086 4,593 4,681 4,417 4,579 Other merchandise
imports 4,846 4,559 4,964 5,309 5,588 4,632 4,468 3,925 3,851 Manufactured
goods classified chiefly by material
4,338 4,245 4,620 4,947 5,569 6,082 5,457 3,428 3,499
41
SECTION 3
3.3 origin of ireland’s Goods and Services
imports, current prices, 2010
8
- 5,000 10,000 15,000 20,000 25,000 30,000 35,000
Million
Services Goods
Source: CSO External Trade Bulletin and Services Imports and Exports. Note: at the time of writing updated data on the breakdown of imports by origin was unavailable, resulting in the total value of goods imports differing from table 3.1.
Million € Goods Services Total
UK 14,588 10,466 25,054
Netherlands 2,211 10,243 12,454
Germany 3,499 3,482 6,981
France 1,832 3,364 5,196
Italy 767 2,335 3,102
Belgium 1,080 1,123 2,203
Other EU 3,633 10,768 14,401
USA 6,414 24,644 31,058
China 2,755 302 3,057
Other 8,729 14,204 22,933
42
SECTION 3
3.4 composition of ireland’s Goods imports,
constant prices
16, 2000-2010
8
- 5,000 10,000 15,000 20,000 25,000 30,000 35,000
Million
Services Goods 0
10,000 20,000 30,000 40,000 50,000 60,000
2000 2001 2002 2003 2004 2005 2006 2007 2008 2009 2010
Million
Machinery (SITC 7) Manufactured Goods Classified by Material (SITC 6) Chemicals (SITC 5)
Food, Beverages and other Animal Products (SITC 0+1+4) Mineral Fuels, Lubricants and
Related Products (SITC 3)
Miscellaneous manufactured articles (SITC 8) Commodities and transactions
not classified elsewhere (SITC 9) Other (SITC 2+U)
43
3.4 Continued
SITC Product
Groups Section Million €
2000 2001 2002 2003 2004 2005 2006 2007 2008 2009 2010
0 Food and live
animals 2,208 2,364 2,491 2,722 2,884 3,218 3,472 3,916 3,911 3,878 3,841
1 Beverages and tobacco 408 515 575 608 613 678 684 770 698 676 689
2 Crude materials, inedible, except fuels
640 606 632 681 743 817 908 940 695 512 569
3
Mineral fuels, lubricants and related products
1,797 1,683 1,525 1,696 2,479 3,514 4,010 4,883 5,509 3,903 4,699
4
Animal and vegetable oils, fats and waxes
95 93 91 104 103 113 138 137 174 155 152
5
Chemicals and related products NES15
4,770 4,811 5,464 5,941 6,290 6,485 6,766 6,928 6,919 6,472 7,347
6
Manufactured goods classified chiefly by material
3,399 3,331 3,424 3,656 4,070 4,325 4,732 5,185 4,559 3,009 2,935
7
Machinery & transport equipment
23,234 22,932 22,350 17,857 19,351 21,855 21,725 21,636 16,749 12,548 10,339
8
Miscellaneous manufactured articles
4,604 4,780 4,827 5,429 5,579 6,194 6,253 6,488 5,731 5,375 5,161
9
Commodities and transactions not classified elsewhere
850 935 1,081 1,090 1,152 1,096 970 2,102 2,166 2,104 1,821
U Unclassified 0 0 11 0 - - 0 1 -
44
SECTION 3
3.5 composition and Geographical distribution
of ireland’s Services imports, current prices,
2010
8
- 5,000 10,000 15,000 20,000 25,000 30,000 35,000
Million
Services Goods
0 5,000 10,000 15,000 20,000 25,000 30,000 35,000
UK Other Europe USA Asia Not Geographically
Allocated
Other Regions
Million
Communications Other Royalties/Licences
Transport Tourism and Travel Financial Services
Insurance Business Services Computer Services
45
3.5 Continued
Million € UK
Other
Europe USA Asia
Not Geographically
Allocated Other
Regions Total
Total 10,466 33,662 24,644 1,906 5,049 5,204 80,931 % of total
Services Imports 12.9 41.6 30.5 2.4 6.2 6.4 100.0 % CAGR 2005
and 2009 4.7 13.4 5.5 5.9 15.7 5.5 8.9
Million € UK EuropeOther USA Asia
Not Geographically
Allocated Other
Regions Total
Share of Total, %, 2009
% CAGR 2005 and 2009 Communications 725 298 40 6 56 84 1,209 1.5 14.3
Other 64 22 40 7 43 16 192 0.2 4.8
Royalties/
Licences 1,230 16,082 7,576 98 711 2,836 28,533 35.3 16.5
Transport 483 381 329 33 375 12 1,613 2.0 -5.0
Tourism and
Travel 857 2,994 903 18 997 57 5,826 7.2 4.4
Financial Services 600 1,182 2,486 122 58 65 4,513 5.6 14.2 Insurance 68 4,025 * 125 81 1,900 6,199 7.7 0.9 Business Services 4,907 9,875 11,857 1,469 2,537 1,634 32,279 39.9 6.3 Computer
Services 134 201 * 25 110 178 648 0.8 16.5
46
SECTION 3
3.6 Share of total Extra- and intra-Eu27 Goods
and Services imports, current prices, 2006
and 2010
8 - 5,000 10,000 15,000 20,000 25,000 30,000 35,000 MillionServices Goods
0.1% 0.2% 0.2% 0.2% 0.4% 0.5% 0.5% 0.9% 1.1% 1.1% 1.3% 1.4% 1.4% 1.6% 2.0% 2.2% 2.5% 3.0% 3.0% 3.1% 6.1% 7.1% 9.0% 9.1% 11.0% 11.1%
0% 5% 10% 15% 20%
Malta Cyprus Latvia Estonia Lithuania Bulgaria Slovenia Luxembourg Romania Slovakia Greece Portugal Finland Hungary Denmark Czech Republic Ireland Austria Sweden Poland Spain Belgium Italy Netherlands United Kingdom France Germany Share 2010 Share 2006
Section 4
direct investment position
4.1 Index of Outward Direct Investment (ODI) Stock, 2000-2010
4.2 Ireland’s ODI Stock and Flow by Destination of Investment, 2010
4.3 ODI Stock, selected activities, 2010
4.4 Cumulative Stock of ODI as a Percentage of GDP, Selected Countries, 2007, 2010
4.5 Index of Foreign Direct Investment (FDI) Stock, 2000-2010
4.6 FDI Stock and Flow in Ireland by Location of Investor, 2010
4.7 FDI Stock, Selected Activities, 2010
4.8 Cumulative Stock of FDI as a Percentage of GDP, Selected Countries, 2007, 2010
SECTION 4
4.1 index of outward direct investment (odi
17)
Stock
18, 2000-2010
0 100 200 300 400 500 600 700 800 900 1000 1100 1200 1300
2000 2001 2002 2003 2004 2005 2006 2007 2008 2009 2010
Irish ODI Stock EU ODI Stock World ODI Stock
Source: UNCTAD, World Investment Report 2011.
Base = 2000 2000 2001 2002 2003 2004 2005 2006 2007 2008 2009 2010
Irish ODI
Stock 100 146 211 263 382 373 432 537 605 1036 1249 EU ODI
Stock 100 100 107 139 160 166 209 250 227 260 256 World ODI
49
4.2 ireland’s odi Stock and flow
19by
destination of investment, 2010
-20,000 -10,000 0 10,000 20,000 30,000 40,000 50,000 60,000 70,000 80,000 90,000 100,000
UK Netherlands Other Europe USA Central America Other
Million
2009 Stock 2009 Flow
40,010
28,986
93,747
24,423
61,182
12,644
-3,466 -1,354 -911 -790
-10,305
3,385
Source: CSO, Foreign Direct Investment 2010.
Million € 2008 Stock 2008 Flow 2010 Stock 2010 Flow
Stock % change 2008 and 2010
UK 33,591 -5,157 40,010 -3,466 19.1
Netherlands 6,973 636 28,986 -1,354 315.7
Other Europe 46,250 -1,966 93,747 -911 102.7
USA 18,682 -3,318 24,423 -790 30.7
Central America 8,201 -2,844 61,182 -10,305 646.0
Other 7,684 -287 12,644 3,385 64.5
50
SECTION 4
4.3 odi Stock, selected activities, 2010
8 8%
7% 1%
11%
53%
20% Computer activities
Trade and repairs
Food products
Financial Intermediation
Other business activities
Other
Source: CSO, Foreign Direct Investment 2010
Note: data is not available on all activities, so only some were selected for inclusion in the chart.
Million € 2010 Stock 2010 Flow
Total Manufacturing 13,341 -947
Total Services 236,824 -12,923
Computer activities 20,541 *
Trade and repairs 17,231 -3,764
Food products 2,942 288
Financial Intermediation 30,231 2,982
Other business activities 138,362 -7,823
Other 51,685 *
51
4.4 cumulative Stock of odi as a percentage of
Gdp, Selected countries, 2007-2010
8
0 20 40 60 80 100 120 140 160 180
% GD
P
2010 2007
Source: UNCTAD, World Investment Report 2011
% GDP 2007 2010
Singapore 127.2 139.4
Ireland 57.9 171.1
Netherlands 120.4 113.9
UK 65.3 75.3
Sweden 71.8 73.2
France 69.0 58.9
EU 51.5 54.9
Germany 40.0 42.9
USA 37.4 32.8
Italy 19.8 23.2
52
SECTION 4
4.5 index of foreign direct investment (fdi
20)
Stock, 2000-2010
8
70 100 130 160 190 220 250 280 310 340
2000 2001 2002 2003 2004 2005 2006 2007 2008 2009 2010 Irish FDI Stock EU FDI Stock World FDI Stock
Source: UNCTAD, World Investment Report 2011
Base = 2000 2000 2001 2002 2003 2004 2005 2006 2007 2008 2009 2010
Irish FDI
Stock 100 105 144 175 163 129 123 160 148 195 194 EU FDI Stock 100 107 127 169 206 203 239 324 280 314 297 World FDI
53
4.6 fdi Stock and flow in ireland by location
of investor, 2010
8
-10,000 -20,000 0 10,000 20,000 30,000 40,000 50,000 60,000 70,000 80,000 90,000
Million
2010 Stock 2010 Flow
UK Netherlands Luxembourg Other Europe USA Other
23,833 23,867
78,431
14,128 31,039
13,627 1,456
-7,869
10,099
7,536 6,617
2,041
Source: CSO, Foreign Direct Investment 2010
Million € 2008 Stock 2008 Flow 2010 Stock 2010 Flow
Stock % change 2008 and 2010
UK 14,661 4,116 23,833 1,456 62.6
Netherlands 35,267 -459 23,867 -7,869 -32.3
Other Europe 60,439 3,078 78,431 10,099 29.8
USA 11,280 -16,862 14,128 7,536 25.2
Central America 14,808 3,534 31,039 6,617 109.6
Other -1,160 -4,639 13,627 2,041 -1274.7
54
SECTION 4
4.7 fdi Stock, Selected activities, 2010
8
0 10,000 20,000 30,000 40,000 50,000
Million
10,967 47,455
11,674 6,551
39,079
28,193 41,006
Trade and
Repairs intermediation Monetary Chemicals Other Financial intermediation
Other Business activities
Insurance Services
Other
Source: CSO, Foreign Direct Investment 2010
Million € 2010 Stock 2010 Flow
Total Manufacturing 28,895 -5,175
Total Services 155,625 25,101
Trade and Repairs 10,967 231
Monetary intermediation 47,455 1,456
Chemicals 11,674 -6,388
Other Financial Intermediation 6,551 15,143
Other Business activities 39,079 *
Insurance Services 28,193 3,155
Other 41,006 6,283
55
4.8 cumulative Stock of fdi as a percentage of
Gdp, Selected countries, 2007, 2010
8
0 50 100 150 200 250
Singapore Irel and
Sweden Netherlands
Czech Republic
UK EU
France US A
Germany Italy
% GDP
2010 2007
Source: UNCTAD, World Investment Report 2011.
% Gdp 2007 2010
Singapore 188.26 218.38
Ireland 78.58 121.26
Sweden 63.44 75.96
Netherlands 97.96 75.44
Czech Republic 64.52 67.64
UK 44.22 48.44
EU 44.28 42.37
France 48.47 39.01
USA 25.18 23.38
Germany 20.89 20.36
57
Section 5
national Expenditure on r&d: Headline figures
5.1 Gross Expenditure on R&D (GERD) – Ireland
2000-2010
5.2 Gross Expenditure on R&D (GERD) as a
Percentage of GDP/GNP – Ireland, EU and
OECD, 2000-2010
5.3 Gross Expenditure on R&D (GERD) as a
Percentage of GDP/GNP – Ireland and
Selected Countries
5.4 Performance of National R&D by Sector,
2003, 2009
5.5 Gross Expenditure on R&D (GERD) –
Performers, 2009
5.6 (i)
Government Budget Appropriations
or Outlays on R&D (GBAORD) as a
Percentage of GDP/GNP
(ii)
Government Budget Appropriations
SECTION 5
5.1 Gross Expenditure on r&d (GErd
21) - ireland
2000-2010
0 500 1000 1500 2000 2500 3000
2000 2001 2002 2003 2004 2005 2006 2007 2008 2009 2010
GERD m current Prices GERD m constant Prices
Sources: CSO/Forfás, Derived from the Survey of R&D in the Business Sector, 2009/10; Forfás Survey of R&D in the Higher Education Sector, 2008; Forfás R&D Funding and Performance in the State Sector 2009/2010.
2000 2001 2002 2003 2004 2005 2006 2007 2008 2009 2010
GERD € Million Current Prices
1176 1284 1447 1637 1840 2029 2209 2443 2616 2838 2765
% Annual
59
5.2 Gross Expenditure on r&d (GErd
21) as a
percentage of Gdp/Gnp - ireland, Eu and
oEcd, 2000-2010
1.0% 1.2% 1.4% 1.6% 1.8% 2.0% 2.2% 2.4%
2000 2002 2004 2006 2008 2009 2010
OECD EU 27
GERD/GNP Ireland GERD/GDP Ireland
Sources: CSO/Forfás, Derived from the Survey of R&D in the Business Sector, 2009/10; Forfás Survey of R&D in the Higher Education Sector, 2008; Forfás R&D Funding and Performance in the State Sector 2009/2010; OECD, Main Science and Technology Indicators database, Volume 2010/2, February 2011.
2000 2002 2004 2006 2008 2009* 2010*
OECD 2.20% 2.21% 2.18% 2.24% 2.34% -
EU 27 1.74% 1.76% 1.73% 1.77% 1.92% 1.92%
GERD/GNP Ireland 1.32% 1.36% 1.46% 1.43% 1.69% 2.16% 2.21% GERD/GDP Ireland 1.12% 1.11% 1.23% 1.25% 1.45% 1.78% 1.80%
SECTION 5
5.3 Gross Expenditure on r&d (GErd
21) as a
percentage of Gdp/Gnp - ireland and Selected
countries
1.48 1.53 1.66 1.68 1.80 1.81 1.84 1.86 1.92 1.95 1.96 2.21 2.21 2.75 2.82 3.02 3.62 3.87 4.270.00 0.50 1.00 1.50 2.00 2.50 3.00 3.50 4.00 4.50 Estonia Czech Republic Portugal Luxembourg Norway United Kingdom Netherlands Slovenia EU-27 Canada Belgium Ireland (GNP) France Austria Germany Denmark Sweden Finland Israel
61
5.4 performance of national r&d by Sector, 2003,
2009
8 7.8%
67.5% 24.7%
5.0%
65.8% 29.2%
% GERD Performed by Industry
% GERD Performed by Higher Education Sector
% GERD Performed by Government Sector
2003
2009
SECTION 5
5.5 Gross Expenditure on r&d (GErd
21) -
performers, 2009
1,834
829
141
0 200 400 600 800 1,000 1,200 1,400 1,600 1,800 2,000
Industry Higher Education (e) Government
Million
63
5.6 (i) Government budget appropriations
or outlays on r&d (Gbaord
22) as a
percentage of Gdp/Gnp*
0.00% 0.20% 0.40% 0.60% 0.80% 1.00% 1.20% Luxembourg
Australia Italy Belgium Ireland (GNP) UK Japan Netherlands Spain France Austria Norway Germany Sweden Denmark Portugal Iceland Finland
*2010 Figures (except Luxembourg, Belgium, Austria, Germany, Sweden, Denmark, Portugal – 2009 Figs)
SECTION 5
5.6 (ii) Government budget appropriations
or outlays on r&d (Gbaord
22) as a
percentage of Gdp/Gnp Excluding
defence*
0.00% 0.20% 0.40% 0.60% 0.80% 1.00% 1.20% Luxembourg
Australia United States UK Italy Czech Republic Belgium Estonia Ireland (GNP) Japan Netherlands Spain Norway Sweden Austria Germany Portugal Denmark Finland
*2010 Figures (except Belgium, Estonia, Spain, Sweden, Portugal - 2009 Figs)
Section 6
Expenditure on r&d by Sector:
business, Higher Education and public
6.1 Business Sector-Performed R&D (BERD) in
Current and Constant Prices, 2003-2010
6.2 Business Sector-Performed R&D (BERD) as a
Percentage of GDP/GNP, Ireland, OECD, EU27,
2000-2010
6.3 Business Sector-Performed R&D (BERD) by
Industrial Sector, 2009
6.4 Distribution of Business Sector R&D
Expenditure (BERD) by Size of Spend, 2005,
2009
6.5 Higher Education Sector-Performed R&D
(HERD) in Current and Constant Prices, Ireland,
2000-2009
6.6 Higher Education Sector-Performed R&D
(HERD) as a Percentage of GDP/GNP, Ireland,
OECD and EU27, 2000-2009
6.7 Government Sector-Performed R&D (GovERD)
– in Current and Constant Prices, 2000-2010
6.8 Government Sector-Performed R&D (GovERD)
as a Percentage of GDP/GNP, Ireland, OECD
and EU27, 2000-2010
SECTION 6
6.1 business Sector-performed r&d (bErd) in
current and constant prices, 2003-2010
900 1,000 1,100 1,200 1,300 1,400 1,500 1,600 1,700 1,800 1,900
2003 2005 2007 2009 2010
BERD current prices BERD constant prices
Source: CSO/Forfás, Derived from Business Expenditure on R&D, 2009/10 and CSO Consumer Price Index, March 2011.
2003 2005 2007 2009 2010
BERD €m Current Prices 1,105 1,329 1,603 1,868 1,833
67
6.2 business Sector-performed r&d (bErd) as a
percentage of Gdp/Gnp, ireland, oEcd, Eu27,
2000-2010
0.60% 0.80% 1.00% 1.20% 1.40% 1.60% 1.80%
2000 2002 2004 2006 2008 2010
OECD EU 27
BERD/GNP Ireland BERD/GDP Ireland
2000 2002 2004 2006 2008 2010*
OECD 1.53% 1.50% 1.48% 1.55% 1.63% 1.63%
EU 27 1.11% 1.11% 1.09% 1.11% 1.15% 1.17%
BERD/GNP
Ireland 0.94% 0.94% 0.96% 0.95% 1.09% 1.47%
BERD/GDP
Ireland 0.80% 0.77% 0.81% 0.82% 0.94% 1.19%
* Estimate
SECTION 6
6.3 business Sector-performed r&d (bErd) by
industrial Sector, 2009
Agriculture, Forestry, Fishing, Mining and Quarrying; 0.2%
Manufacturing; 39.8%
Electricity, Gas Supply; Water Supply, Sewerage, Waste Management and Remediation; Construction; 0.2%
Wholesale and Retail Trade, Repair of Motor Vehicles and Motorcycles; Transportation and Storage; 8.9%
Information and Communication Services; 26.1%
Financial and Insurance Activities; 8.4%
Real Estate; Professional, Scientific and Technical Activities; 15.6%
Admin. and Support Service Activities; 0.3%
All Other Services Activities; 0.4%
Sector €m %
Agriculture, Forestry, Fishing, Mining and Quarrying 3.6 0.2%
Manufacturing 743.3 39.8%
Electricity, Gas Supply; Water Supply, Sewerage, Waste
Management and Remediation; Construction 4.6 0.2% Wholesale and Retail Trade, Repair of Motor Vehicles and
Motorcycles; Transportation and Storage 166.6 8.9% Information and Communication Services 487.9 26.1% Financial and Insurance Activities 157.5 8.4% Real Estate; Professional, Scientific and Technical Activities 291.0 15.6% Admin. and Support Service Activities 6.0 0.3%
All Other Services Activities 7.9 0.4%
Total - All Enterprises 1,868.5 100.0%
69
6.4 distribution of business Sector r&d
Expenditure (bErd) by Size of Spend, 2005,
2009
546
453
253
68 50 435 439
277
65 67 0
100 200 300 400 500 600
< 100,000 100,000-500,000 5000,000-2,000,000
2,000,000-> 5,000,000
5,000,000 +
2005 2009
SECTION 6
6.5 Higher Education Sector-performed r&d
(HErd) in current and constant prices -
ireland 2000-2009*
200 300 400 500 600 700 800 900
2000 2002 2004 2006 2008 2009*
HERD m Constant Prices HERD m Current Prices
2000 2002 2004 2006 2008 2009*
HERD €m Current Prices 238 322 492 601 750 829
HERD €m Constant Prices 307 378 547 627 716 829
* Estimate
71
6.6 Higher Education Sector-performed r&d
(HErd) as a percentage of Gdp/Gnp, ireland,
oEcd and Eu27, 2000-2009*
0.20 0.25 0.30 0.35 0.40 0.45 0.50 0.55 0.60 0.65
2000 2002 2004 2006 2008 2009*
OECD EU 27
HERD/GNP Ireland HERD/GDP Ireland
2000 2002 2004 2006 2008 2009*
OECD 0.35% 0.38% 0.39% 0.39% 0.40% 0.40%
EU 27 0.36% 0.39% 0.39% 0.40% 0.43% 0.46%
HERD/GNP Ireland 0.27% 0.30% 0.39% 0.39% 0.48% 0.63%
HERD/GDP Ireland 0.23% 0.25% 0.33% 0.34% 0.42% 0.52%
*Estimate
SECTION 6
6.7 Government Sector-performed r&d
(GovErd
23) - in current and constant prices –
2000-2010*
80.0 100.0 120.0 140.0 160.0 180.0 200.0
2000 2002 2004 2006 2008 2010*
GovERD m Constant Prices GovERD m Current Prices
Includes Hospital R&D.
2000 2002 2004 2006 2008 2010*
GovERD €m Current Prices 96.0 125.0 138.0 150.0 182.0 131.0
GovERD €m Constant Prices 122.8 145.8 152.1 155.2 172.5 131.0
* Estimate
73
6.8 Government Sector-performed r&d
(GovErd
23) as a percentage of Gdp/Gnp,
ireland, oEcd and Eu27, 2000-2010
0.00% 0.05% 0.10% 0.15% 0.20% 0.25% 0.30%
2000 2002 2004 2006 2008 2010*
GovERD/GNP Ireland GovERD/GDP Ireland EU 27 OECD
2000 2002 2004 2006 2008 2010*
OECD 0.26% 0.27% 0.26% 0.26% 0.26% 0.26%
EU 27 0.25% 0.24% 0.24% 0.24% 0.24% 0.26%
GovERD/GNP Ireland 0.11% 0.12% 0.11% 0.10% 0.12% 0.10%
GovERD/GDP Ireland 0.09% 0.10% 0.09% 0.08% 0.10% 0.24%
* Estimate
Section 7
r&d Workforce
7.1 Total Researchers (FTE) per 1,000 Total Employment, Ireland, OECD, EU27, US, 2005, 2007, 2009
7.2 Total Researchers (FTE) per 1,000 Total Employment, Ireland and Selected Countries, 2009
7.3 Headcount of PhD and Other Researchers in the Business Sector, 2003-2009
7.4 (i) FTE Research Personnel (Researchers plus Support Staff) by Sector of Employment, 2005, 2007, 2009
(ii) FTEResearch Personnel (Researchers plus Support
Staff) by Sector of Employment - Share of Total, 2009
(iii) FTEResearch Personnel (Researchers plus Support
Staff) by Sector and Category of Employment - 2009 7.5 (i) Total Headcount Research Personnel
(Researchers plus Support Staff) by Sector and Gender - 2009
(ii) Percentage of Total Female Headcount Research Personnel (Researchers plus Support Staff) by Sector of Performance and Occupation, 2009 (iii) International Comparison of Women Researchers
as a Percentage of Total Researchers (Headcount) 7.6 Science and Engineering Tertiary Students as a
Percentage of all Tertiary Students, EU-27 and Selected Countries, 2008
SECTION 7
7.1 total researchers (ftE
24) per 1,000 total
Employment, ireland, oEcd, Eu27, uS, 2005,
2007, 2009*
5.0 6.0 7.0 8.0 9.0 10.0
2005 2007 2009*
US OECD EU 27 Ireland
2005 2007 2009*
US 9.6 9.5 9.5
OECD 7.6 7.6 7.6
EU 27 6.4 6.6 6.8
Ireland 6.2 6.9 7.6
*2009 Figures (except US and OECD 2007 Figures).
77
7.2 total researchers (ftE
24) per 1,000 total
Employment, ireland and Selected countries,
2009*
0.0 2.0 4.0 6.0 8.0 10.0 12.0 14.0 16.0 18.0
Finland 16.6 OECD 7.6
Denmark 12.3 Estonia 7.2
Sweden 10.4 Spain 7.0
Norway 10.2 EU-27 6.8
Portugal 9.1 Luxembourg 6.8
Austria 8.5 Slovak Republic 6.1
Belgium 8.4 Czech Republic 5.5
Germany 7.7 Netherlands 5.4
Slovenia 7.7 Hungary 5.0
United Kingdom 7.6 Italy 4.1
Ireland 7.6
*2009 Figures (except OECD 2007 and UK 2010).
SECTION 7
7.3 Headcount of phd and other researchers in
the business Sector, 2003-2009
6,145 6,866 7,063 7,321
466
830 1,179
1,639
0 1,000 2,000 3,000 4,000 5,000 6,000 7,000 8,000 9,000 10,000
2003 2005 2007 2009
Other Researchers PhD Researchers