THE EFFECT OF STATE FACTORS ON RESILIENT
MODULUS OF BITUMINOUS MIXTURE
Marliana Azura bt Ahmad Puzi
1and Tuan Noor Rafidah bt Tuan
Hassan
2ABSTRACT
The elasticity or resilient modulus of pavement materials is a very important material property in any mechanistically based design for flexible pavement. The resilient modulus test simulates the conditions in the pavement due to application moving wheel loadings. As a result, the test provides an excellent means for comparing the behavior of pavement construction materials under a variety of conditions including grading and bitumen content. Resilient modulus values can be used with structural response analysis models to calculate the pavement structural response to wheel loads and with pavement design procedures to design pavement structure. The key aim of this study is to identify the effect of state factor in term of grading, temperature and bitumen content on resilient modulus of bituminous mixture. Secondly, KenLayer software was used to indicate the pavement lifetime and proven the MR results from first objective.
Various laboratory tests were conducted; Penetration test, Softening point test, Specific Gravity, Marshall Test and Resilient Modulus Test. From the outcome, clearly shows that more course aggregate will get higher MR and more bitumen content will lessen the MR value. Hopefully this
outcome will contribute some valuable information in highway materials and continuations with other state factors are welcome from highway researchers outside to the new discovery of design pavement.
Keywords: Resilient modulus; Flexible pavement; State Factor; KenLayer Software; Bitumen
Content.
1. INTRODUCTION
The global increase in traffic volumes has raised the need for better performing pavements. Proper performance of bituminous pavement is guaranteed if all the pavement layers and the subgrade can appropriately support traffic loads under all service conditions. Nowadays, the introduction to elasticity or resilient modulus (MR) test provides an important input for
structural design of pavement systems by using multilayer elastic theory. The resilient modulus test is basically a repetitive load test using the stress distribution principle of indirect tensile test. The resilient modulus test simulates the conditions in pavement construction materials under a variety of state factor (i.e., moisture, density, gradation, bitumen content, temperature, etc.) and stress factor (i.e., stress magnitude, stress duration, stress frequency, etc.).
Stress-strain deformation relationships have been established in order to examine the effect of stress and/or strain level on the resilient modulus found by the indirect tensile test and to define an approximate linear viscoelastic zone for bituminous mixtures at different temperatures.
1
Lecterur of Department of Geotechnical and Transportation Engineering, KUiTTHO
2
The KenLayer computer program can be applied only to flexible pavements with no joints or rigid layers. The backbone of KenLayer is the solutions for an elastic multilayer system under a circular loaded area. The solutions are superimposed for multiple wheels, applied iteratively for nonlinear layers and collected at various times for under single, dual, tandem or dual-tridem wheels with each layer behaving differently, either single or multiple. The damage caused by fatigue cracking and permanent deformation in each period over all load groups is summed up to evaluate the design life.
2. OBJECTIVE
The objectives of this research are:-
(i) Determine the effect of state factor; bitumen content, grading and temperature On Resilient Modulus
(ii) Determine the Mixture lifetime by using KenLayer Software.
(iii) Determine whether the results of second objective proof the results of first objective.
3. MATERIALS AND TESTING
3.1 Aggregates
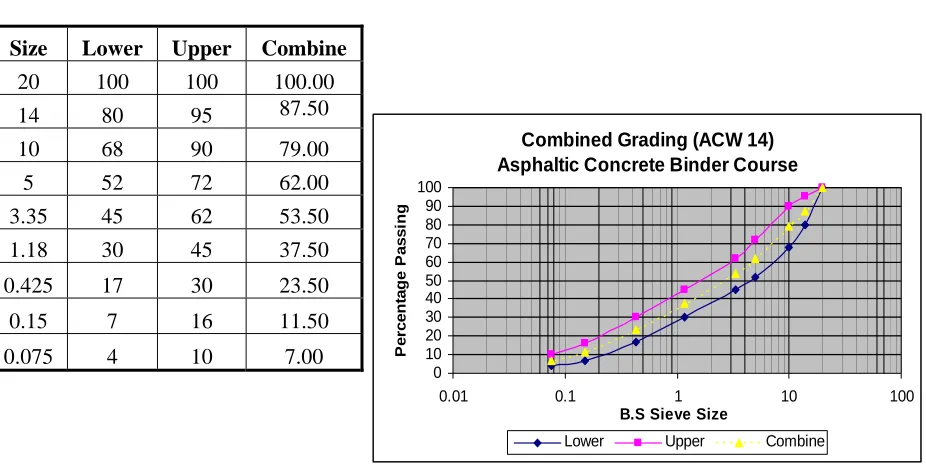
[image:2.595.99.562.497.734.2]Two commonly aggregate are prepared for the research, fine and coarse aggregate. All testing were based on ‘JKR Standard Specification for Road Works’. A sieve analysis is made of each range, and then a quantity of aggregate of the selected blend is prepared into several sizes ranges by sieving. FIGURE 1 was plotted based on results of Table 1. In this research, combine method was used in getting more uniform results and mixes. This method also encouraged by IKRAM.
TABLE 1 . Result of Sieve Analysis for ACW 14
Size Lower Upper Combine
20 100 100 100.00 14 80 95 87.50 10 68 90 79.00
5 52 72 62.00 3.35 45 62 53.50 1.18 30 45 37.50 0.425 17 30 23.50
0.15 7 16 11.50 0.075 4 10 7.00
Combined Grading (ACW 14) Asphaltic Concrete Binder Course
0 10 20 30 40 50 60 70 80 90 100
.01 1 0 100
.S Sieve Size
Pe
rc
e
n
ta
g
e
Pa
s
s
in
g
0 0. 1 1
B
Lower Upper Combine
3.2 Asphalt Binder
[image:3.595.206.418.475.572.2]The asphalt binder used for this research is ACW 14, ACW 20 and ACB 28. The mix design of bitumen content for each type of mix is shown in Table 2. Mixture design tests for bituminous pavement are carried out on samples mixed and compacted in the laboratory to determine the optimum bitumen content, and gradation required to produce a pavement that will meet given quality specifications. Mixes with various bitumen and aggregate contents and gradations are prepared, compacted to specified density, and tested. From the test results, determine optimum values.
TABLE 2. Design Bitumen Content for ACW 14, ACW 20 and ACB 28
Mix Type Design Bitumen Content (%)
ACW 14 – Wearing Course 5.0 – 7.0
ACW 20 – Wearing Course 4.5 – 6.5
ACB 28 – Binder Course 4.0 – 6.0
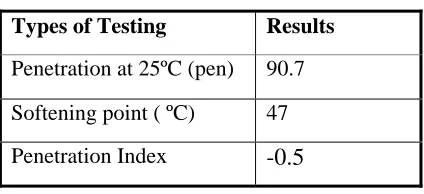
3.2.1 Properties of Bitumen
From the laboratory test, the tested bitumen are classified as semisolid with 90.7 pen. According to M.S 124, the value of penetration should be in a range of 80/100. The interception line C in Nomograph shows the bitumen type is -0.5. Telling that Conventional Paving Bitumen type and also in the range of -2 to +2. As a conclusion, the test value meets the requirement.
TABLE 3. Properties of Asphalt
Types of Testing Results
Penetration at 25ºC (pen) 90.7
Softening point ( ºC) 47
Penetration Index
-0.5
3.3 Marshall Testing
The objective of this test is to prepared standard specimens of bitumen content for measurement of stability and flow in the Marshall apparatus and to determine density, percentage air voids and percentage of aggregates voids filled with bitumen. The complete test reveals stability, flow, density, voids in total mix (VTM), voids in the mineral aggregate (VMA) and voids in filled with binder (VFB). These parameters plotted against bitumen content enable optimum to be obtained for specific applications of the asphalt concrete. See the procedure of the testing in next page.
• All specimens, prepared according to the JKR Standard, are immersed in a water bath for 40 minutes at 60 ± 1˚C
• The specimen is removed from the water bath, placed in the lower jaw and upper jaw of the Marshall apparatus. The complete assemble is then placed in the compression testing machine. The flow and load meter adjusted to zero.
• The maximum force and flow are read and recorded. The maximum time allowed between removal of specimens from water bath and maximum load is 30s.
• Repeat procedures with different specimens
3.4 Resilient Modulus Test
A 5-pulse Indirect Tensile Modulus is used in this test. The mean, standard deviation (SD) and coefficient of variance (CV %) are calculated for bitumen content and grading with different temperatures. Before test, all the specimen’s diameters and heights should be measured. The reading will be taken for two different positions of every sample. The procedure as below;
• Specimens should be consistent in size before loading into the indirect tensile jig.
• Jogging control buttons are used to locate the loading actuator at the approximate center of its travel.
• Loosely fit the specimen in the jig between the loading platens and locate the jig on the base of the loading frame.
• Measure the diameter and length of the specimen
• Raise the yoke support cross-arms by lifting then turning the support spacers so that each spacer sits up on its cam ledge.
• Place the displacement transducer yoke on the specimen and adjust the clamping screws so that the specimen sits centrally within the yoke. Tighten the knurled locking nuts on the clamps at one end of the specimen and slightly loosen the clamps at the other end.
• Place the specimen and yoke on the lower loading platen with the yoke supported by the cross arms. Locate the top loading platen on the jig and lower it onto the specimen.
• Lower the loading shaft to locate the ball end in the tapered hole of the platen.
• Position the yoke so that the specimen is laterally central and tighten the two loose clamps to firmly attach the yoke to the specimen.
• Lower the yoke support cross arms by rotating each spacer until it drops down from the cam ledge.
• Adjust the levels of the LVDTs on two sides to ensure that both are working within their calibrated range.
• Run the computer-aided test and record the final results computed
4. ANALYSIS OF RESULT
4.1 Resilient Modulus Test
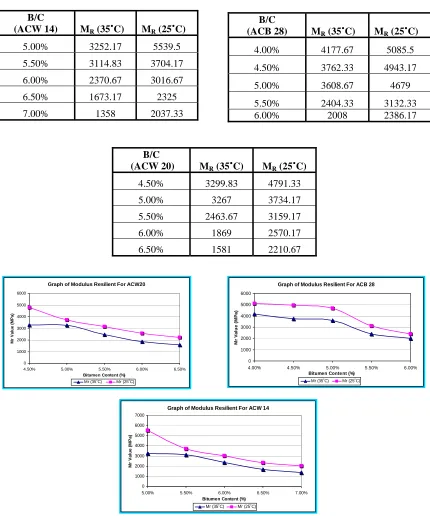
All data was obtained from the resilient modulus output. The average value of MR at 35˚C and
25 ˚C are listed in Table 4. The data is analyzed and graphs of MR value versus Bitumen
TABLE 4: The Average Value of Mixes (i) ACW 14 (ii) ACW 20 and (iii) ACB 28 within condition at 35˚C and 25 ˚C
B/C
(ACW 14) MR (35˚C) MR (25˚C)
5.00% 3252.17 5539.5 5.50% 3114.83 3704.17 6.00% 2370.67 3016.67 6.50% 1673.17 2325 7.00% 1358 2037.33
B/C
(ACB 28) MR (35˚C) MR (25˚C)
4.00% 4177.67 5085.5 4.50% 3762.33 4943.17 5.00% 3608.67 4679 5.50% 2404.33 3132.33 6.00% 2008 2386.17
B/C
(ACW 20) MR (35˚C) MR (25˚C)
4.50% 3299.83 4791.33 5.00% 3267 3734.17 5.50% 2463.67 3159.17 6.00% 1869 2570.17 6.50% 1581 2210.67
Graph of Modulus Resilient For ACB 28
0 1000 2000 3000 4000 5000 6000
4.00% 4.50% 5.00% 5.50% 6.00%
Bitumen Content (%)
Mr V a lu e ( M P a )
Mr (35˚C) Mr (25˚C)
Graph of Modulus Resilient For ACW20
0 1000 2000 3000 4000 5000 6000
4.50% 5.00% 5.50% 6.00% 6.50%
Bitumen Content (%)
M r Va lu e ( M Pa )
Mr (35˚C) Mr (25˚C)
Graph of Modulus Resilient For ACW 14
0 1000 2000 3000 4000 5000 6000 7000
5.00% 5.50% 6.00% 6.50% 7.00%
Bitumen Content (%)
M r Va lu e ( M P a )
Mr (35˚C) Mr (25˚C)
FIGURE 2. Graphs of MR Value versus Bitumen Content;
ACW 14, ACW 20 and ACB 28
Graph of Resilient Modulus for ACW 14, ACW 20 and ACB 28 in Figure 2 show that the values of MR rapidly decreases with increasing of bitumen content. If MR values are high, it
shows that the specimens stiffer. In this research, based on the graph, it is obviously shows that the strength reduced with the increases of bitumen content.
Besides that, the graphs also show the values of MR at two different temperatures; 25˚C and
25˚C. This is due to the softening of the asphalt binder as the temperature is decreased (Ziari Khabiri 2005).
Chart of Comparison Grading For odulus Resilient
CW 14 CW 20 CB 28
ix Type M 0 1000 2000 3000 4000 5000 6000
A A A
M Mr V a lu e (MP a )
Mr (25˚C) Mr (35˚C)
Mix Type
MR
(25˚C)
MR
(35˚C)
ACW 14 3704.17 3114.83
ACW 20 3734.17 3267.00
ACB 28 5085.50 4177.67
[image:6.595.91.499.428.732.2]
FIGURE 3. Chart of Comparison Grading for Modulus Resilient
Figure 3 shows the comparison grading result for Modulus Resilient. From the graph it is clearly shows that MR value increases with higher grading.
4.2 KenLayer Results
The value of design life time in year unit has been determined by using KenLayer software. MR
value for bitumen contents of ACW 14, ACW 20 and ACB 28 used in this software. Figure 4 shows the Graph of Design Life Versus Bitumen Content for ACW 14, ACW 20 and ACB 28.
Graph of Design Life Versus Bitumen Content For ACW 14 0 10 20 30 40 50 60 70 80 90
5.0 5.5 6.0 6.5 7.0
Bitum en Content (%)
D e s ign Li fe ( y r)
Design Life(yr) (25˚C) Design Life(yr) (35˚C)
B/C (%) Design Life(yr) Design Life(yr) (25˚C) (35˚C)
5.0 84.08 29.99 5.5 39.79 23.53 6.0 21.51 10.32 6.5 9.74 3.65 7.0 6.55 1.98
(i)
Graph of Design Life Versus Bitumen Content For ACW 20 0 10 20 30 40 50 60 70
4.5 5.0 5.5 6.0 6.5
Bitumen Content (%)
D e s ign Li fe ( y r)
Design Life(yr) (25˚C) Design Life(yr) (35˚C)
B/C (%) Design Life(yr) Design Life(yr) (25˚C) (35˚C)
(ii)
Graph of Design Life Versus Bitumen Content For ACB 28
0 20 40 60 80 100
4.0 4.5 5.0 5.5 6.0
Bitumen Content (%)
D
e
s
ign Li
fe
(
y
r)
Design Life(yr) (25˚C) Design Life(yr) (35˚C)
B/C (%)
Design Life(yr)
Design Life(yr)
(25˚C) (35˚C)
4.0 73.71 54.53 4.5 67.84 46.82 5.0 65.56 43.23 5.5 23.85 13.58 6.0 11.01 7.24
[image:7.595.93.496.120.283.2](iii )
FIGURE 4. Graphs of Design Life versus Bitumen Content for (i) ACW 14, (ii) ACW 20 (iii) ACB 28
FIGURE 4 shows the design life decreases with increases percentage of bitumen content. This occurs when decreases of aggregates content in the mixture. Besides, a temperature also gave an effect to the design life. The temperature at 25˚C gave the higher value to the design life compared at 35˚C. This scenario occurs due to softening of asphalt binder at higher temperature and caused the lower of pavement strength. Therefore, the design life at higher temperature is lower. In term of an angle of resilient modulus which is also called elastic modulus, it was obviously shows that more value of resilient modulus (MR) gave more value of
design life. This scenario occurred to all mixtures. The unit of resilient modulus from every mix had been converted from Mega Pascal (Mpa) to pounds per square inch (psi).
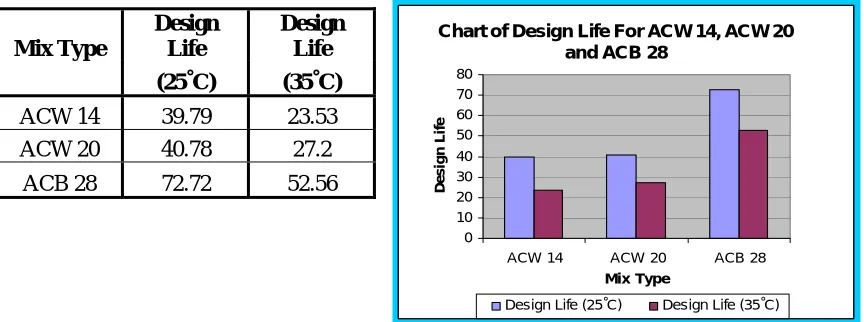
Chart of Design Life For ACW 14, ACW 20 and ACB 28
0 10 20 30 40 50 60 70 80
ACW 14 ACW 20 ACB 28
Mix Type
D
e
s
ign Li
fe
Design Life (25˚C) Design Life (35˚C)
Mix Type
Design Life
Design Life
(25˚C) (35˚C)
ACW 14 39.79 23.53
ACW 20 40.78 27.2
[image:7.595.101.533.485.646.2]ACB 28 72.72 52.56
FIGURE 5. Chart of Design Life for ACW 14, ACW 20 and ACB 28
The output run of KenLayer also shows that the design life was controlled by permanent deformation. The multiple axles were analyzed twice. The first determination was the primary damage ratio by considering all axles and then determined the additional damage ratio by placing the response point halfway between two axles.
5. CONCLUSION
Based on the research that has been carried out, it can be concluded that this research is successful. The effect of state factor which is bitumen content, grading and also temperature is finally identified.
The bitumen content increased when the MR value decreased which means the strength of the
specimens was reduced with the increasing of bitumen content. In an angle of grading, the conclusion is the bigger type of mix that has been used; hence the higher of MR value was
obtained.
Another factor that has been considered was temperature. The lower temperature gave higher value of MR. This is due to softening of asphalt binder in higher temperature.
Thus, it is proven that the increasing of resilient modulus in this research gave a higher value for design life. It also obtained proven in KenLayer software. It can happen also due to the grading processes of mix design. Higher grading gave the higher value of resilient modulus (MR) and further to design life which also gave the higher value in year’s unit.
6. RECOMMENDATION
As a recommendation, the mix of ACB28 gave highest strength compared to ACW 20 and ACW 14. Moreover, ACW 20 should be used in real and costly highway construction besides it is more economically and prepare stiffer pavement.
For further research, adding some waste material such as glass, polymer, rubber seed and others into ACB 28 is welcome to compare the effect of state factor on bituminous mixture of resilient modulus. If the mixes gives good result, it mean can be applied in our road construction. Besides, the Circly software also can be used to replace the KenLayer software which can be used to determine the lifetime of pavement, vertical displacements and others.
ACKNOWLEDGEMENT
The authors would like to thank the Kolej Universiti Teknologi Tun Hussein Onn, Batu Pahat, Johor for funding this work, especially facilities of Highway Engineering Laboratory, Jabatan Kerja Raya, and IKRAM, Kuala Lumpur for delivering some valuable information and knowledge.
REFERENCES
Fritz, H.W., Eustacchio, E. (1990). “Mechanical Test for Bituminous Mixes.” London: Chapman and Hall.
Herubin C.A, Marotta T.W. (1987). “Basic Construction Materials-Methods and Testing.” Upper Saddle River, New Jersey: Prentice Hall, Inc.
Derucher K.N., Korfiatis G.P., Ezeldin A.S. (1998). “Materials For Civil & Highway Engineers.” 4th ed. Upper Saddle River, New Jersey: Prentice Hall.
Young J.F., Mindess S., Gray R.J., Bentur A., (1998). “The Science and Technology of Civil Engineering Materials.” New Jersey: Prentice Hall.192
Jackson N., (1983). “Civil Engineering Materials”, 3rd. ed. London: The Macmillan Press Ltd.
ransportation Research Board, National Research Council. (1991). “Transportation Research Record No. 1317, Material & Construction; Asphalt Mixtures: Design, Testing and Evaluation”.
Huang Yang H., (1993). “Pavement Analysis and Design.” Englewood Cliffs, N.J.: Prentice Hall, Inc.
O’Flaherty C.A., (1974). “Highway Engineering.” 2nd. ed. Bedford Square, London: Edward Arnold (Publishers) Ltd.
Robert N.H., (1994). “Bituminous Mixtures In Road Construction.” London: Thomas Telford. Yoder E.J, Witczak M.W., (1975). “Principles of Pavement Design.” 2nd. ed. Canada: A
Wiley-Interscience Publication.
Freddy L.R, Prithvi S.K, Brown E.R, Lee D.Y, Thomas W.K.,(1991). “Hot Mix Asphalt Materials, Mixture Design and Construction.” 1st.ed. Napa Education Foundation Lanham, Maryland.
O’Flaherty C.A., (2002). “Highways: The Location, Design, Construction and Maintenance of Road Pavements.” 4th.ed. Butterworth-Heinemann.
Jamilah Ahmad (2002). “Pemanfaatan Sabut Kelapa Sawit Sebagai Bahan Tambah Dalam Campuran Berbitumen Jenis Poros Dan Stone Matrix Asphalt (SMA).” Kolej Universiti Teknologi Tun Hussein Onn.
Hasliza Hashim (2003). “Kajian Kesan Campuran Lateks Dan Carbon Black Ke Atas Ciri-ciri Bitumen Yang Digunakan Dalam Turapan.” Kolej Universiti Teknologi Tun Hussein Onn.
Chua M.E.,(2002). “Characteristics of Polymerized Bituminous Mixture and The Correlation with Stability and Flow of The Bituminous Mix.” Kolej Universiti Teknologi Tun Hussein Onn.
Mohammad, L.N., Puppala, A.J. and Kathavate, S. (1994) “Design and Reliability Assessment of a Data Acquisition System for Louisiana Accelerated Loading System.” Journal of the Transportation Research Board, National Academy of Science, Transportation Research Board, TRR No. 1435, Washington, D.C.
Mohammad, L.N., Puppala, A.J. and Alavilli, P. (1994). “Effect of Strain Measurements on Resilient Modulus of Sands.” Dynamic Geotechnical Testing: Second Volume, ASTM, STP 1213. Philadelphia.
Al-Abdul Wahhab Hamad I., Ibrahim M. Asi and Rezqallah H. Ramadhan. (2001). “Modeling Resilient Modulus and Temperature Correction for Saudi Roads.” Journal of Materials in Civil Engineering, Vol. 13, No. 4. pp. 298-305.
Mohammad, L.N., Huang, B., Puppala, A.J. and Allen, A.(1999) “Regression Model for Resilient Modulus of Subgrade Soil.” Journal of the Transportation Research Board, National Academy of Science, Transportation Research Board Record, TRR No. 1687,