Design and Development of Low Subsonic Wind Tunnel for Turning
Diffuser Application
Normayati Nordin
1,a, Zainal Ambri Abdul Karim
2,b, Safiah Othman
1,cand Vijay R. Raghavan
3,d 1Faculty of Mechanical and Manufacturing Engineering, Universiti Tun Hussein Onn Malaysia, 86400 Batu Pahat, Johor, Malaysia
2
Department of Mechanical Engineering, Universiti Teknologi PETRONAS, Bandar Seri Iskandar, 31750 Tronoh, Perak, Malaysia
3
OYL R&D Centre Sdn. Bhd., Taman Perindustrian Bukit Rahman Putra, 47000 Sungai Buloh, Selangor, Malaysia
a
[email protected], [email protected], [email protected], [email protected]
Keywords: low subsonic wind tunnel, settling chamber, screens, contraction cone, turning diffuser
Abstract. In practice, it is basically difficult even with controlled measurement environment to
acquire a steady, uniform and fully developed flow. The flow entering diffuser was severely distorted despite a sufficient hydrodynamic entrance length already introduced. This was mainly due to the imperfect joining of duct and the abrupt change of the inlet cross-section applied. In this study, several basic features of a low subsonic wind tunnel, i.e. a centrifugal blower with 3-phase inverter, a settling chamber, screens and a contraction cone, are designed and developed for a turning diffuser application in order to improve the flow quality. The flow profiles are examined using Pitot static probe at five measurement points within the range of inflow Reynolds number, Rein= 5.786E+04-1.775E+05. The steady, uniform and fully developed turbulent flow profiles with an average deviation with theory of about 3.5% are obtained. This proves that a good flow quality could be produced by means of incorporating some basic features of a low subsonic wind tunnel to the system.
Introduction
It is not easy to obtain a steady, uniform and fully developed flow in reality. Although by introducing a sufficient hydrodynamic entrance length of 4.4DhRe1/6<Lh,turb < 50Dh [1, 2], the flow has still been found severely distorted in the last reported works [3,4]. There was a large deviation of up to 34.1% recorded between the numerical and experimental results [4]. This was mainly due to the assumption made in the simulation that the inlet velocity was fully developed and uniform. However, in actual fact, the inlet velocity was considerably disrupted due to the abrupt change introduced to the diffuser inlet and the imperfect joining of duct [4]. This has to be improved otherwise the reliability and accuracy of the work shall be in doubt. In this study, several improvements to the existing test rig are proposed mainly by designing, developing and incorporating several basic features of a low subsonic wind tunnel such as a centrifugal blower, a settling chamber, screens and a contraction cone to the system. The flow that is expected to be more uniform and perfectly developed is then measured using Pitot static probe by traverse at five points and compared to the theories within the range of inflow Reynolds number, Rein=5.786E+04 - 1.775E+05.
Conceptual Design of Low Subsonic Wind Tunnel Features
Low subsonic wind tunnel is characterised as a tunnel with a test section cross-sectional area of less than about 0.5 m2 and freestream velocities of less than about 40 m/s [5]. It is expected that a good flow quality can be produced by incorporating well-designed wind tunnel features. Consisting of
Advanced Materials Research Vols. 614-615 (2013) pp 586-591
Online available since 2012/Dec/13 at www.scientific.net
© (2013) Trans Tech Publications, Switzerland doi:10.4028/www.scientific.net/AMR.614-615.586
several components such as a blower, a settling chamber, screens and a contraction cone, the wind tunnel shall be easily designed and developed by means of scaling the good existing wind tunnel to the required test section [6].
[image:2.595.93.497.435.549.2]Fig. 1. A geometric layout of turning turning diffuser with 90o angle of turn and inlet cross-sectional area of W1 cm x X1 cm= 13 cm x 5 cm
Fig. 2. Open loop low subsonic wind tunnel (OLWT) intalled in Aerodynamics Laboratory, Universiti Tun Hussein Onn Malaysia [6]
Fig. 3. Experimental rig adopted several features of low subsonic wind tunnel system
In this study, as shown in Fig. 1 the required test section is a turning diffuser with an inlet cross-sectional area of 13 cm x 5 cm operated at velocity of 5 m/s - 40 m/s. Basically, this is characterised as an internal aerodynamic problem where the flow in the turning diffuser is to be examined. As illustrated in Fig. 2, the good existing low subsonic wind tunnel, designed by Hartono [6] for Universiti Tun Hussein Onn Malaysia is chosen and scaled to the needs. Fig. 3 shows the schematic of the experimental rig that is designed to be incorporated with several features of a low subsonic wind tunnel.
Centrifugal Blower. A centrifugal blower is installed at the upstream end of the open-circuit tunnel
and controlled using 3-phase inverter. The inverter allows the flow to be steadily regulated by RPM to the required inlet velocity (m/s). The relationship of the blower’s RPM and inflow Reynolds number, Rein is calibrated as shown in Fig. 4. In this study, the flow is assumed to be incompressible, withair density, ρ=1.164 kg/m3, dynamic viscosity, μ= 1.872E-05 kg/ms and hydraulic diameter, Dh= 0.072 m. By solving the expression, Rein=7.520E+03*RPM-1.048E+04, the inlet velocity of 5 m/s – 40 m/s could be specified by means of regulating the blower to the RPM of 4.37 – 25.22.
Fig. 4. The calibration chart of blower’s RPM to inflow Reynolds number, Rein
Settling Chamber and Multiple Screens Arrangement. Settling chamber is a section in the wind
tunnel for conditioning the flow to be calm. The irregular flows due to swirl, low-frequency pulsation and turbulence can be suppressed in this space. Screens are usually installed in the settling chamber to further improve the mean flow uniformity and to reduce the intensity of the oncoming turbulence [7]. They are normally made of metal wires interwoven to form squares or rectangular meshes. According to Mehta and Bradshaw [8], screens with pressure coefficient of about 2 could remove almost all variation in the longitudinal mean velocity. If multiple screens are applied they should be spaced 30 times the mesh size or 500 times the wire diameter, whichever is larger [9]. In this study, 4 unit screens with different mesh sizes are installed in the settling chamber of 40 cm x 40 cm cross-section, with the screens placed 5 cm to each other.
Contraction Cone. Contraction cone is utilized to accelerate flow from the settling chamber to the
test section. The out-going flow from the contraction cone is expected to be steady, uniform, and free from separation. Contraction ratios, c of between 6- 10 are found to be adequate for most small, low speed wind tunnels [10]. Bell and Mehta [11] have developed a polynomial function that has been proven successful to design the contraction cone. In this study, the contraction cone of ratio, c = 6 is designed by means of fifth order polynomial [11], as depicted in Fig. 5.
h= [-10()3 + 15 ()4 - 6()5] [Hi – Ho] + Hi (1) where,
= normalizing length, X/L L= contraction cone length, 26 cm
Hi=height of the contraction wall from the axis symmetry of the inlet, 10 cm Ho= height of the contraction wall from the axis symmetry of the outlet, 6.5 cm
Fig. 5. Contraction cone is designed using fifth order polynomial principle recommended by Bell and Mehta [11]
[image:3.595.145.451.573.756.2]Rig Development and Installation
The development and installation of rig are conducted by phases as following:-
Fabrication (January 2012 – March 2012). The wind tunnel parts, i.e. upstream duct, settling
chamber, 4 unit screens and contraction cone, are fabricated using stainless steel with the thickness of 3.5 mm, whereas the test section, i.e. turning diffuser, is fabricated using acrylic with the thickness of 3 mm (see Fig. 6). Basically, each part is manufactured with care to the highest possible standard of accuracy.
Installation and Test-Run (April 2012). The blower is mounted on anti-vibration mountings and
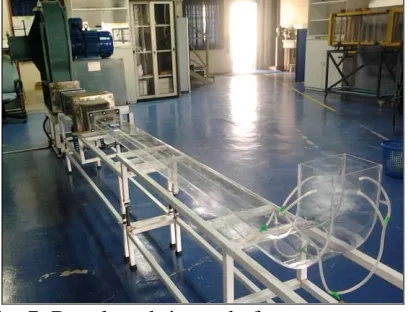
connected to the tunnel with a flexible coupling known as ‘bellow’ to reduce vibration.4 unit screens are installed in the settling chamber using flange and bolt for easy them to be removed and cleaned when necessary. The test section is installed at the downstream end, after the contraction cone. Several test-runs are conducted to trace and fix certain leakage and vibration on the system. Fig. 7 shows the rig that is ready for measurements.
(a) (b) (c) (d)
[image:4.595.62.538.298.400.2]Fig. 6. (a) Settling chamber (b) Contraction cone and (c) Screens are fabricated using stainless steel, whereas (d) Turning diffuser using acrylic
Fig. 7. Developed rig ready for measurements
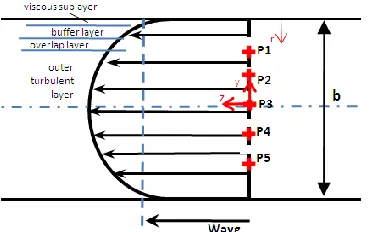
Verification of Rig Performance to Produce a Good Flow Quality (May 2012). The flow
produced by the rig incorporated with wind tunnel features is examined experimentally using Pitot static probe at five points and compared to the theory. As the range of Rein tested is 5.786E+04-1.775E+05, the flow is expected to be turbulent. As illustrated in Fig. 8, the velocity profile in fully developed turbulent flow is much fuller, with a sharp drop near the wall. Turbulent flow along the wall can be considered to consist of four regions, namely viscous sublayer, buffer layer, overlap layer and outer turbulent layer [12]. Each layer is characterised by the distance from the wall, , where u* is a friction velocity that can be calculated using = and r is
measurement point from the wall. Wall shear stress, can be determined using , with friction factor,
[image:4.595.196.401.449.605.2]Fig. 8. Velocity profile of fully developed turbulent flow
f that depends on Re and relative roughness, ε/Dh can be found from Moody chart, whereas in
approximately Wavg=0.9Umax.As all the measurement points, i.e. P1, P2, P3, P4 and P5, are located at r+>30, they are all within the outer turbulent layer. Therefore, the one-seventh power-law velocity profile can be applied as following [11]:
(2)
where,
WPn= local velocity (m/s)
Umax= velocity at the centre point, i.e. WP3 (m/s) y= measurement point from the centre (m)
R = Dh/2 (m)
Results and Analysis
[image:5.595.207.393.72.188.2]As shown in Table 1, velocities measured by Pitot static probe at five points are verified with the theory, where the minimal deviation recorded is of less than 5%. Besides, there is a significant improvement in terms of flow produced upon installation of the wind tunnel features to the system. As depicted in Fig. 9 the flow becomes more uniform, steady and perfectly developed.
Table 1. Deviation of velocity measured by pitot static probe with theories
Rein
Velocity at each measurement point (m/s)
WP1pt WP1theo
Dev.
(%) WP2pt WP2theo
Dev. (%)
WP3pt=Umax
(ref.) WP4pt WP4theo
Dev.
(%) WP5pt WP5theo
Dev. (%)
5.786E+ 04 13.11 13.11 0.0 13.81 13.97 1.1 14.36 13.99 13.97 0.1 13.11 12.93 1.4 6.382E+ 04 14.00 14.46 3.2 15.40 15.41 0.1 15.84 15.62 15.41 1.4 13.62 14.26 4.5 1.027E+ 05 22.55 23.26 3.0 25.15 24.80 1.4 25.48 25.35 24.80 2.2 22.70 22.94 1.0 1.397E+ 05 30.29 31.65 4.3 33.78 33.75 0.1 34.68 34.08 33.75 1.0 30.12 31.22 3.5 1.775E+ 05 38.22 40.22 5.0 43.32 42.88 1.0 44.06 42.88 42.88 0.0 38.97 39.67 1.8
Fig. 9. Inlet velocity profiles at different Rein that are perfectly developed, uniform and steady [image:5.595.60.539.489.585.2]
Conclusion and Future Directions
Overall, it is proven that a good flow quality could be produced by means of incorporating several basic features of a low subsonic wind tunnel to the system. Hence, the experimental setup is now ready for future works.
Acknowledgements
This work was financially supported by the Fundamental Research Grant Scheme (FRGS) of the Ministry of Higher Education, Malaysia. The experimental work was conducted in the Aerodynamics Laboratory, Universiti Tun Hussein Onn Malaysia (UTHM).
References
[1] D.F. Young, B.R. Munson, T.H. Okiishi and W.W. Huebsch, A Brief Introduction to Fluid Mechanics, John Wiley & Sons, New Jersey, 2007.
[2] S. Elyasi, Development of UV photo-reactor models for water treatment, Ph.D Thesis, Faculty of Graduate Studies (Chemical and Biological Eng.), Univ. of British Columbia, Vancouver (2009). [3] N. Nordin, V.R.Raghavan, S.Othman and Z.A.A Karim, Compatibility of 3-D turning diffusers by means of varying area ratios and outlet-inlet configurations, ARPN J. of Eng. And Applied Sciences Vol. 7 (2012) http://www.arpnjournals.com/jeas/archive.htm
[4] N. Nordin, V.R.Raghavan, S. Othman and Z.A. Abdul Karim, Numerical investigation of turning diffuser performance by varying geometric and operating parameters, Applied Mechanics and Materials Journal ISSN 1660-9336 (2012).
[5] J.H. Bell and R.D. Mehta, Boundary-layer predictions for small low speed contractions, American Institute of Aeronautics and Astronatics Journal Vol. 27 (1989) 372-374.
[6] F. Hartono, Wind tunnel OLWT-400; Aerodynamic experimental techniques, Aerospace Department, Bandung Institute of Technology, Bandung, Indonesia, 2003.
[7] R.D. Mehta, Turbulent boundary layer pertubed by a screen, American Institute of Aeronautics and Astronatics Journal Vol. 23 (1985).
[8] R.D. Mehta and P. Bradshaw, Design rules for small low speed wind tunnels, The Aeronautical Journal of the Royal Aeronautical Society (1979) 444-449.
[9] J.B. Barlow, W.H. Rae and A. Pope, Low-speed wind tunnel testing, John Wiley & Sons Inc., 1999.
[10] J.H. Bell and R.D. Mehta, Boundary-layer predictions for small low-speed contractions, American Institute of Aeronautics and Astronatics Journal Vol. 3 (1988).
[11] J.H. Bell and R.D. Mehta, Contraction design for low-speed wind tunnels, NASA 177488, Contract NAS2-NCC-2-294, 1988.
[12] Y.A. Cengel and J.M. Cimbala, Fluid Mechanics; Fundamentals and Applications, McGraw Hill Higher Education, New York, 2010.
Advances in Power and Electrical Engineering
10.4028/www.scientific.net/AMR.614-615
Design and Development of Low Subsonic Wind Tunnel for Turning Diffuser Application
![Fig. 2. Open loop low subsonic wind tunnel (OLWT) intalled in Aerodynamics Laboratory, Universiti Tun Hussein Onn Malaysia [6]](https://thumb-us.123doks.com/thumbv2/123dok_us/8774588.900702/2.595.93.497.435.549/subsonic-tunnel-intalled-aerodynamics-laboratory-universiti-hussein-malaysia.webp)