ReVIeW ARtIcle t
by Alison L. Van Eenennaam, Kristina L. Weber, Krista Cooprider and Daniel J. Drake
Data on the performance of in-dividual beef cattle from birth to processing can be used to improve herd management and genetic char-acteristics such as fertility, weaning weight and tenderness. Likewise, tracing the origins and whereabouts of cattle that may have been exposed to infectious disease agents is neces-sary to protect the health of the na-tional beef herd. Such information is rarely available, in part because cattle often change ownership during the beef production process. A system developed to support the lifetime tracking of individual cattle in the UC Davis beef herd seamlessly transfers information between the UC Sierra Foothill Research and Extension Center, UC Davis campus feedlot and a commercial beef-cattle processing plant, and provides a repository for performance data collected at all pro-duction stages. The system provides real-time data sharing, as well as integrated analysis and management evaluation options, and will be a valuable resource for beef-cattle re-search. UC livestock farm advisors are now implementing a similar system with cooperating commercial ranches.
T
he beef-cattle supply chain con-sists of several distinct sectors. An animal may change ownership several times during its life, and each transfer presents a major obstacle for the dis-semination of individual animalre-cords from one sector to the next. Often
animal health data and other important information are never shared among members of the supply chain.
The cycle typically starts in the cow-calf sector, where the animals are bred,
born and raised. Once animals reach a
certain age or weight, or their feed re-sources become limiting, they are sold, sometimes to a stocker operation for additional weight gain before they are sold again to a feedlot. At the feedlot,
animals are “finished” — often fed on a
grain-based diet until they reach market weight, at which time they are har-vested. Carcasses are then transferred to the packer where they are divided into wholesale cuts, then into retail cuts.
In the absence of an integrated
identification system, tracing a single
steak back to its carcass, let alone back to the cow-calf operation where the
animal originated, becomes extremely
complicated. Although steak may be the end-product, it is not the end of the chain. That position is reserved for the consumer, and it is ultimately the
con-sumer’s eating experience that should
be the driving force for selection and management decisions throughout the supply chain. However, because most cow-calf producers do not retain ownership of animals after they leave the ranch, they receive no information
on (1) animal performance at the feed-lot, (2) carcass quality attributes or (3) consumer satisfaction with products derived from the animals they bred and raised. Consequently, they receive no price premiums or discounts.
Industry fragmentation is also a major obstacle hindering the effective traceback of animal disease outbreaks. Animal diseases pose a major threat to livestock production in the United States, and the intentional or uninten-tional introduction of infectious dis-ease agents could have a catastrophic impact on cattle producers. A 2006 study estimated that the combined consumer and producer losses from a foot-and-mouth disease outbreak in
the United States would exceed $266
billion (Zhao et al. 2006).
Although approaches to enable traceback for investigation and re-sponse to disease incidents have been discussed nationwide, implementation has been slow. The U.S. Department of Agriculture (USDA) National Animal
Identification System (NAIS) has met
with considerable resistance for a va-riety of reasons, including uncertainty about proposed equipment and
sys-Integrated data-collection system tracks
beef cattle from conception to carcass
Center (SFREC). Vertical integration of the system provides opportunities for researchers to analyze commercial beef-cattle production from concep-tion to carcass. The overall objective of this project was to demonstrate that a functional, integrated data and trace-back system could be useful for cattle management, while simultaneously pro-viding biosecurity features. The project team included staff at SFREC, the UC Davis campus feedlot, employees of a commercial processing plant, UC farm advisors, and researchers from the UC Davis Department of Animal Science and School of Veterinary Medicine.
System design
Conceptually, the data management system now in place for the UC Davis cow-calf herd comprises several distinct
operations (fi g. 1). Since 2007, various
sectors (users) have been collecting data with commercially available software
designed for their specifi c needs.
SFREC. Data collected at SFREC
includes calving date, birth weight,
mother-of-calf identifi cation, weaning
weight and health records. All
(ap-proximately 250) calves are fi tted with
individually numbered ear tags at birth. The SFREC herd manager enters all records into Cow Sense herd manage-ment software (Midwest MicroSystems, Lincoln, NE). Subsequently, a computer running Cow Sense is used to collect data on location at the handling chute each time cattle are brought through. That information is then remotely
transferred to the main offi ce at SFREC
where it can be updated before being linked through the Internet to the UC Davis central computer and stored in a Microsoft Access database.
Feedlot. Data is available in real
time when calves are shipped to the UC Davis feedlot. This information is valuable to feedlot operators when
assigning calves to specifi c dietary, production or other experimental
groups. Calves are weighed upon
feedlot entry and exit, and at 30-day
intervals to determine the average daily rate of gain. Feedlot data is collected using the Measurement and Analysis Research System (MARS) (Midwest tems, and the absence of any direct
benefi t to the producers who must
pay for its implementation. Currently, participation in NAIS is voluntary and limited. However, other beef-producing countries — including Australia, the European Union, Japan, Brazil, Argentina and Canada — have already adopted such systems, usually in con-junction with government subsidies to encourage participation, and they are
enjoying the benefi ts of source- and age-verifi ed marketing opportunities.
The end result is that U.S. beef produc-ers are falling behind in technology adoption, and their responsiveness to biosecurity issues is limited. At the same time, the public may perceive that the beef industry is unresponsive to animal health and food safety issues.
To address these problems, a collab-orative research team developed a fully integrated, electronic, individual-animal tracking-system prototype for the UC Davis Department of Animal Science cow-calf herd, which is used for research and education and is located at the UC
Sierra Foothill Research and Extension
Round electronic ear tags, inset, were placed in the left ears of SFREC cattle and used as the key integrating identifi cation number for cattle records. Visual ear tags, electronic wands and various electronic devices were also used to collect data.
the UC cow-calf herd at SFREC. This collective information enhances the value of data from each individual researcher, and both the content and number of animals in the database will continue to grow over time.
Unique identification numbers
Data is collected from each calf crop from conception to carcass over a period spanning 2 to 3 years. At any point in time, three crops consisting of 100 to 250 calves are either being gestated, calved
and grown at SFREC, or finished at the
feedlot. It is easy for animal numbering systems to become confusing. Two ani-mals with the same number (e.g., no. 1)
might exist concurrently as a weanling
at SFREC and a steer being fattened at the feedlot. The key to keeping accurate
records is assigning a unique identifi -cation number to each animal. This is
done using a radio-frequency-identifi -cation (RFID) ear tag transmitting an embedded 15-digit number, which is assigned to each animal in the cow-calf herd at SFREC. The small, round button tags are placed in the left ear and read by hand-held or chute-side electronic readers as the animal moves through the production process. The tags pro-vide rapid and error-free recording and tracking of individual animals. The
identification number links information
about each animal, whether it concerns assigning the calf to DNA-based parent-age determinations, weaning weight, feedlot gain or the eventual quality MicroSystems), a computer program
that allows for repeated measurements of multiple variables.
Harvest. Cattle are harvested based
on weight and visual estimates of finish, and shipped in groups of approximately
20 head. Carcass data is collected from a commercial harvest facility in Los Banos, Calif., by a USDA grader using a
hand-held scanner (PSION Workabout
Pro) similar to those used by overnight
delivery services (fig. 1).
Database connections. Data is
de-livered to the UC Davis server via software called Beef STAR (Midwest MicroSystems), with databases from the three sectors connected using
Microsoft Access. Data also flows back
to the herd management software, Cow Sense, to provide the SFREC herd manager with information on calf per-formance in the feedlot and at harvest. This feedback allows for the develop-ment of on-ranch genetic evaluations for feedlot performance and carcass traits, not typically an option for com-mercial cow-calf producers.
UC researchers also have linked an-cillary databases of detailed research data to the central database. Alison Van Eenennaam developed a DNA database that contains SNP (single nucleotide polymorphism) genotypes for each
bull, cow and calf at SFREC. Other UC
researchers are beginning to tie into the system, including Bruce Hoar of the UC Davis School of Veterinary Medicine, who is the attending veterinarian for
grade of its carcass or size of the rib-eye steak it produced.
At harvest, when carcass data is
collected, reliable identification takes
on additional importance. The detec-tion of a contagious animal disease could potentially trigger an urgent need to determine the source and re-cent movements of the animal relating to a particular carcass. In the event of such a traceback, linkage to all previ-ous production records from birth to harvest would be critical for a timely response. Knowledge of each animal’s whereabouts and origin would facilitate a targeted health response, as opposed to a mass recall and potential depopu-lation of unaffected herds. This would increase response effectiveness and decrease the costs associated with an animal disease outbreak.
Some of the problems that we en-countered during the development of this integrated data-collection system included implementing electronic
identification technology in a practi
-cal manner for the field collection of
data, database sharing structure, data integrity and security, the education of collaborators and staff working on the project, and the timeliness of data availability for real-time use. The sys-tem was designed to be dual purpose:
first, to accomplish traceback in the case
of a disease outbreak, and second, to develop valuable information for cattle management, thereby rewarding data collection by all parties.
Breeding performance
We were able to apply data obtained though the integrated data-collection system in a study of cattle paternity and breeding success. Commercial beef-cattle herds using multiple-sire breeding pastures often have no way of identify-ing which bull fathered a calf, or which bull produced the best (or worst) cohort of calves. Inherited DNA markers can be used to assign paternity. Bulls pass on only one of the two copies of each gene or “marker allele” that they carry.
Paternity identifi cation involves
exam-ining each calf’s genotype at multiple
locations in the genome and excluding
as potential sires those bulls that do not share common alleles with the calf (Van Eenennaam, Weaber, et al. 2007). DNA
was extracted from tissue collected from
all bulls housed at SFREC before they were turned out with the cow herd for
the 2006, 2007 and 2008 breeding
sea-sons, and DNA was collected from all calves delivered during those 3 years. All DNA samples were genotyped using
a 99 SNP panel (Igenity, Duluth, GA),
and the results were used to match po-tential sires to their offspring.
Sire performance in terms of the number of offspring produced was
highly variable from year to year (fi g. 2). For example, bull 357 was a sire all three years, but in the fi rst year he sired
only one calf, during the second year
he improved slightly to sire six calves,
and in the third year he sired nine calves, for 16 calves total. In contrast, while in 2006 bull 115 was only present
for the fi rst year, he sired 25 calves. At fi rst glance, it would appear that bull
115 far outperformed bull 357; however, consideration must be given to the size of the breeding groups (or how many cows were available to be bred) and how many competing sires were in the group. Bull 357 was in a four-sire
breed-ing group for the fi rst two years (with
two older, and thus likely more domi-nant, bulls), and a three-sire breeding group (with two older bulls) in the third year. This means he had to compete with older bulls in every breeding sea-son. In contrast, bull 115 had only one
No. of calves
Calving group 60 50 40 30 20 10 0
1 2 3 4 5 6 7 8
362 357 208 205 213 221 461 241 351 579 358 115 359 111 354 176 452 390 454 60 50 40 30 20 10 0
1 2 3 4 5 6 7 8
205 208 357 362 351 454 461 552 241 359 452 390 467 529 550 221 354 465 213 358 560 460 35 30 25 20 15 10 5 0
1 2 3 4 5 6 7
357 465 529 362 390 461 467 560 354 358 454 508 465 452 359 503 550 552 A (2006) B (2007) C (2008)
KEY: Same color = same sire; white = bull present for one breeding period only
Cow Sense Herd management software Cow-calf MARS Measurement and Analysis Research System Feedlot Processor Beef STAR Processor Remote server data exchange and remote backup
Data stored in Microsoft Access database using unique RFID number of animal as linking field
Individual researcher databases UC Davis
central server DNA genotypes Ultrasound data Other data Sector-specific choice
of EID readers Researchers
young sire as competition the year that he was an active sire in this evaluation.
We have examined sire prolifi cacy
(breeding success) on a number of commercial cow-calf herds over the past few years, and have consistently seen this variability in calf output (Van
Eenennaam, Weaber, et al. 2007). Other
studies have reported similar variabil-ity in calf output among herd sires, and
further, found that prolifi cacy is
mod-erately repeatable if the composition of bull mating groups remains similar
(DeNise 1999; Holroyd et al. 2002). This
information is important from the standpoint of genetic improvement
be-cause prolifi c bulls will have a greater
impact on herd genetics. Reconciling DNA information on sires and calves is the only way to assign parentage in multiple-sire breeding pastures.
On-ranch genetic evaluations
Another area in which comprehen-sive animal tracking is invaluable is in improving cattle performance through selective breeding. Breeders can make
s Fig. 1. Overall design of the system. the three sources of cattle perform-ance data (producers, feedlot, processors) use activity-specifi c software to input records, which are conveyed to a central database. Appropriate data is available to cooperators in real time and across sectors for decision making.
s
EPDs for a set of 21 natural-service bulls
and six artificial-insemination bulls whose semen was used at SFREC (fig. 3). To show how bull EPDs influence
offspring performance in the absence of other effects and to contrast on-ranch and breed association EPDs, we pro-jected possible offspring averages by resetting the EPD baseline to the SFREC
herd average for weaning weight (540
pounds). If breed association EPDs were consistent with on-ranch progeny
per-formance, all EPDs would be expected
to fall on a diagonal line. However, this was not always the case. Some bulls with similar breed-association EPDs
had significantly disparate on-ranch
genetic evaluations, showing how on-ranch EPDs can help to distill actual genetic potential from the considerable variation associated with the low- accuracy EPDs typical of yearling bulls.
Because the EPDs of heavily used
artificial-insemination bulls already
include progeny-test information, on-ranch evaluations do not offer an opportunity to greatly improve EPD ac-curacy. However, on-ranch evaluations
can identify artificial-insemination sires
whose offspring may be particularly well-suited to a given ranch
environ-ment. Using the integrated identifica -tion and tracking system, we tracked steer progeny of two high-accuracy
artificial-insemination bulls from birth to harvest (fig. 4) (see box). Actual dif -ferences in performance average for birth weight, weaning weight and carcass weight were consistent with
expected differences based on
high-accuracy breed association EPDs for the same sires. In addition, this growth trend was consistent for two time points between weaning and harvest that are not typically included in breed-association genetic evaluations.
The use of integrated systems to de-velop high-accuracy EPDs for natural-service bulls could provide a powerful selection tool for commercial producers interested in improving their herds for feedlot and carcass traits. This will only occur if the market rewards produc-ers for considering these traits in their selection criteria. The adoption of
inte-grated identification systems depends
on whether marketing systems provide monetary incentives for this informa-tion. Many cow-calf producers sell their calves at weaning and derive their income solely from the number and weight of calves sold. Therefore they never receive feedback regarding feed-lot performance or information on how genetic progress by determining the
genetic potential of animals as parents. In the beef-cattle industry, an estimate of genetic potential or breeding value is
called an expected progeny difference (EPD) (see box).
It is particularly important to obtain accurate estimates of the genetic poten-tial of bulls, as bulls will produce more offspring than cows during their lives. Genetic evaluations of young natural-service bulls are often based on the aver-age genetic potential of the parents and observations of the bull itself, and these estimates cannot be further improved in the absence of progeny data. DNA mark-ers cannot only resolve the paternity of offspring produced in multiple-sire breeding pastures, they can also be used to better estimate the genetic worth of natural-service bulls through on-ranch progeny testing (Pollak 2005).
To illustrate these concepts, we com-pared on-ranch and breed-association
570
560
550
540
530
520
510
On-ranch weaning weight EPD
(pounds)
American Angus Assoc. (AAA) weaning weight EPD (pounds)
510 520 530 540 550 560 570 Herd bulls
[image:5.612.55.405.38.235.2]AI bulls High-accuracy AI bulls
Fig. 3. Breed association expected progeny difference (EPD) for weaning weight, with calculated on-ranch weaning weight EPDs adjusted to represent potential observed weaning weights for both natural service (herd) and artificial insemination (AI) bulls. Graduate student Gustavo Cruz records ultrasonograms at the feedlot as part of research
activities with the UC cattle herd.
Measuring bull performance
Expected progeny difference (EPD) is the difference between the average perfor -mance of a bull’s progeny and the average of those sired by another bull. Breed associations develop the most commonly available EPDs based on theirextensive
nationwide databases of pedigree and performance information. In the absence of other information, the genetic merit of an animal can be predicted based on the average breeding value of its parents. This generates a low-accuracy “pedigree estimate” that is typically associated with young animals prior to the collection of any information on their own performance. With only ancestor information, full siblings will have the same EPD. Their true value will vary, however, as a result of the random inheritance of parental genes.Incorporating progeny performance in-formation increases the accuracy of EPDs. This can be seen in beef-sire semen cata-logs, where very-high-accuracy EPDs are associated with bulls with many progeny
standardizing tenderness evaluations (Dikeman et al. 2005). It has three main components: (1) uniform handling and cooking of steaks, (2) core sampling steaks and (3) measuring the amount of force — equivalent to chewing — re-quired to tear the core samples.
While tenderness is undoubtedly an important trait to consumers, it is less clear how selection for tenderness can provide an economic return to the cow-calf producer, who makes decisions based on factors for which they are paid — typically the number of calves sold and the price received for those calves. In the absence of a more inte-grated beef supply chain, it is likely that market failure will prevent tenderness from being an important consideration in breeding decisions on most commer-cial cow-calf ranches. However, some producers, such as Northern California’s Prather Ranch, have developed verti-cally integrated niche markets for their beef, and are incorporating information from DNA tests for meat tenderness in their breeding decisions.
Whole-genome selection
Traditional genetic improvement of beef cattle relies on developing breed-ing values or EPDs for animals based on their performance and that of their
relatives. Over the past 50 years, the se -lection of animals with the best breeding values has doubled the amount of milk that the average dairy cow produces in well those animals suited consumer
preferences for tender, juicy meat. The
fact that there is no financial incen -tive for cow-calf producers to consider many of these “downstream” traits in selection decisions effectively precludes genetic improvement for a number of important traits.
Tenderness evaluation
Increased tenderness has been as-sociated with both consumer willing-ness to purchase and the price they are prepared to pay for beef (Platter et
al. 2005). It is difficult to select for in -creased tenderness, a trait that can only be measured after the animal has left
the herd. Traits that are difficult to mea -sure, or are measured late in life, are well-suited to a DNA-based approach to estimate genetic merit (Allan and Smith
2008). Researchers are using molecular
biology and quantitative genetics to
identify regions of DNA that influence
meat tenderness. DNA-marker tests developed to detect subtle sequence differences show whether a segment of an animal’s DNA is positively or nega-tively associated with tenderness (Casas et al. 2006; Schenkel et al. 2006).
The two most prevalent marker tests
for tenderness explain about 20% to 25%
of the genetic variation for tenderness,
and 12% to 18% of the overall varia -tion in this trait (Van Eenennaam, Li, et al. 2007). These tests can be used for marker-assisted selection, which is the process of using the results of
DNA-marker tests in a genetic-improvement program to assist in the selection of in-dividuals to become the parents of the
next generation.
As a field demonstration of the ef -fect of these markers on meat
tender-ness, 40 genotyped steers from the 2008 calf crop at SFREC were selected
and divided into two groups: one with the most tender genotypes, and the other with the least tender genotypes. Following harvest, meat samples will be collected from each carcassto take tenderness measurements. The Warner-Bratzler shear force (WBSF) protocol is the industry-accepted method of
1,400
1,200
1,000
800
600
400
200
0
Steer progeny average (pounds)
Birth wt. Wean wt. Feedlot in wt. Feedlot final wt. Carcass hot wt. (247 days) (329 days) (450 days) (484 days) AI bull A
AI bull B
AAA EPD −2.2 lbs. Steer avg.
−4.0 lbs.
AAA EPD +22 lbs. Steer avg.
+24 lbs.
AAA EPD +19 lbs. Steer avg.
+17 lbs.
72 76
630 606
709 683
1,258 1,235
724 707
+26 lbs
[image:6.612.33.375.41.258.2]+23 lbs
Fig. 4. American Angus Association (AAA) birth, weaning and carcass weight ePDs were similar to observed average values for steer progeny of two high-accuracy artificial insemination (AI) sires. Sire B’s calves outperformed those of sire A from weaning through processing.
References
Allan MF, Smith TPL. 2008. Present and future appli-cations of DNA technologies to improve beef produc-tion. Meat Sci 80:79–85.
Bovine HapMap Consortium. 2009. Genome-wide survey of SNP variation uncovers the genetic structure of cattle breeds. Science 324:528–32.
Casas E, White SN, Wheeler TL, et al. 2006. Effects of calpastatin and {micro}-calpain markers in beef cattle on tenderness traits. J Anim Sci 84:520–5. DeNise S. 1999. Using parentage analysis in commer-cial beef operations. In: Proc 31st Ann Res Symp Beef Improv Fed. Roanoke, VA. p 183–90.
Dikeman ME, Pollak EJ, Zhang Z, et al. 2005. Phe-notypic ranges and relationships among carcass and meat palatability traits for fourteen cattle breeds, and heritabilities and expected progeny differences for Warner-Bratzler shear force in three beef cattle breeds. J Anim Sci 83:2461–7.
Elsik CG, Tellam RL, Worley KC. 2009. The genome sequence of taurine cattle: A window to ruminant biology and evolution. Science 324:522–8. Holroyd RG, Doogan VJ, De Faveri J, et al. 2002. Bull selection and use in northern Australia. 4. Calf out-put and predictors of fertility of bulls in multiple-sire herds. Anim Reprod Sci 71:67–79.
a year, and halved the amount of feed needed to produce a pound of pork. However, selection has not been as
suc-cessful for traits that are difficult to mea -sure, such as disease resistance, or traits that are not evident until late in an ani-mal’s life, such as fertility or longevity.
Technology breakthroughs developed during the sequencing of the human genome brought DNA-sequencing costs down, which made it economically fea-sible to sequence the genomes of other species. The bovine genome has
re-cently been sequenced (Elsik et al. 2009),
which has led to the discovery of many thousands of naturally occurring DNA-sequence variations in the form of SNPs between individuals (Bovine HapMap
Consortium 2009). Researchers are now
working to determine which variations are associated with desirable character-istics, such as disease resistance, in both humans and livestock species.
Information on variation in DNA sequences between animals may im-prove the accuracy of breeding values,
that is, give breeders more confidence
that they are selecting the best animals. Because DNA is available from birth, it may be possible to predict the genetic potential of animals at a very young age, in the absence of progeny testing, and keep only the best animals for breeding purposes. This may pave the way for producers to select animals to
become parents of the next generation
based on breeding values calculated from DNA-marker data alone, a process called “genomic selection” (Meuwissen et al. 2001). This approach may open the way to develop genetic predictions on
difficult-to-measure traits, such as dis
-ease resistance and feed efficiency, that
are not routinely included in beef-cattle genetic evaluations. It may also allow for the selection of traits that have never been previously considered in genetic evaluations, such as the compositional makeup and nutritional value of meat for human consumption.
Genomic technologies also offer new opportunities to develop management systems to optimize an animal’s DNA
genotype to best fit the production en
-vironment. For example, the genotype
of some beef and dairy cattle may be better suited to grass-based produc-tion systems. It may also be possible to select animals that are able to grow to a given size using less feed, or that are more resistant to certain diseases. These technologies have great potential to en-able the production of safer, more nutri-tious animal products. They may also allow for the selection of animals with a decreased environmental footprint and improved animal welfare due to lower levels of disease.
A.L. Van Eenennaam is Cooperative Extension Specialist, K.L. Weber is Animal Biology Ph.D. Student, K. Cooprider is Animal Biology Masters Student, Department of Animal Science, UC Davis; and D.J. Drake is Cooperative Extension Farm Advisor, Siskiyou County. We acknowledge SFREC Herd Manager Daniel Myers, and Jim Lowe of MidWest MicroSystems, Lincoln, NE, who de-veloped the overall software system design. This project was supported in part by a Core Issues Grant from the UC Division of Agriculture and Natural Resources, and by National Research Ini-tiative Competitive Grant No. 2009-55205-05057 from the USDA National Institute of Food and Agriculture Animal Genome Program.
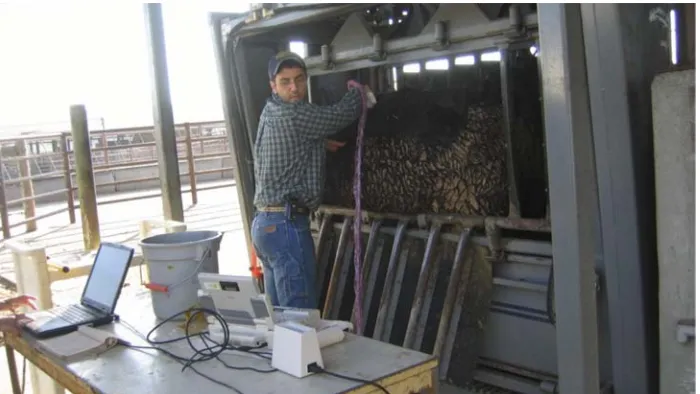
Farm advisor Dan Drake (right) and processing plant personnel examine the carcass of a UC steer. An electronic hand-held device loaded with appropriate software was used to capture the animal’s electronic identification tag number, associate it with carcass attributes, and deliver that information to a database on the UC Davis server, where it was linked with earlier cow-calf and feedlot data.
Meuwissen TH, Hayes BJ, Goddard ME. 2001. Predic-tion of total genetic value using genome-wide dense marker maps. Genetics 157:1819–29.
Platter WJ, Tatum JD, Belk KE, et al. 2005. Effects of marbling and shear force on consumers’ willingness to pay for beef strip loin steaks. J Anim Sci 83:890–9. Pollak EJ. 2005. Application and impact of new ge-netic technologies on beef cattle breeding: A “real world” perspective. Aust J Exp Agr 45:739–48. Schenkel FS, Miller SP, Jiang Z, et al. 2006. Associa-tion of a single nucleotide polymorphism in the cal-pastatin gene with carcass and meat quality traits of beef cattle. J Anim Sci 84:291–9.
Van Eenennaam AL, Li J, Thallman RM, et al. 2007. Validation of commercial DNA tests for quantitative beef quality traits. J Anim Sci 85:891–900. Van Eenennaam AL, Weaber RL, Drake DJ, et al. 2007. DNA-based paternity analysis and genetic evaluation in a large, commercial cattle ranch setting. J Anim Sci 85:3159–69.
Zhao Z, Wahl TI, Marsh TL. 2006. Invasive species management: Foot-and-mouth disease in the U.S. beef industry. Agr Resource Econ Rev 35:98–115.