www.jocpr.com
Available online
Journal of Chemical and Pharmaceutical Research, 2012, 4(7):3695-3702
Research Article
CODEN(USA) : JCPRC5
ISSN : 0975-7384
3695
A sensitive and extractive spectrophotometric method for determination of
trace amount of nitrite in environmental and biological samples
Seema Singh
1, Jeena Harjit
1*, H. C. Kataria
2and Sulbha Amlathe
31
T.I.E.I.T, Karond Gandhinagar Bhopal(M.P)-462038
2
Govt.Geetanjali Girls P.G College Bhopal (M.P)-462038
3
B.U.I.T , Hoshangabad Road Bhopal(M.P)-462026
______________________________________________________________________________
ABSTRACT
A rapid, simple, selective and sensitive method for the spectrophotometric determination of nitrite in water, soil and biological samples has been developed and optimum reaction conditions along with other analytical parameters have been evaluated. Nitrite reacts with N-phenyl-benzo-hydroxamic acid N-PBHA(I), N-p-chloro-phenyl-benzo-hydroxamic acid N-PClPBHA(II) and N-p-chloro-phenyl-cinnamo-N-p-chloro-phenyl-benzo-hydroxamic acid N-PClPCHA(III) in acidic medium to form pink color complex. The intensity of colour increases with substitution. At analytical wavelength the maximum absorption of the complexes were 522 nm, 517 nm and 506 nm, and beer’s law is obeyed over the concentration range of 0.0002664-0.002930 ppm, 0.0002664 – 0.003729 ppm and 0.002664 - 0.01864 ppm, for N-PBHA, N-PClPBHA and N-PClPCHA, respectively. The molar absorptivities were found to be 3.55x10⁵, 2.65x10⁵ and 5.62x10⁵ L mol-1 cm-1 and the relative standard deviation 1.19%, 1.84% and 1.28%, respectively with detection limit of 0.01998, 0.01998 and 0.1332 µg/25 ml of nitrite for N-PBHA, N-PClPBHA and N-PClPCHA, respectively. The optimum reaction conditions such as pH, time and solvent, etc for complete color reaction have been evaluated with all three hydroxamic acid complexes. The method has been successfully applied for determination of nitrite in water, soil and biological samples.
Key words: Spectrophotometric determination, N-PBHA, N-PClPBHA and N-PClPCHA.
_____________________________________________________________________________________________
INTRODUCTION
The forms of nitrogen like nitrate, nitrite, ammonia and organic nitrogen are in greatest interest in order to decrease oxidation state. All these forms of nitrogen, as well as nitrogen gas (N2) are biochemically interconvertible and are
components of the nitrogen cycle. They are of interest for many reasons.
Nitrite is the intermediate oxidation state of nitrogen, both in the oxidation of ammonia to nitrate and also in the reduction of nitrate. Such oxidation and reduction may occur in waste water treatment plants, water distribution systems and natural waters. Nitrite can enter a water supply system through its use as a corrosion inhibitor in industrial process water. Nitrite is actual biological agent of methemoglobinaemia. Nitrous acid, which is formed from nitrite in acidic solution, can react with secondary amines (RR’NH) to form nitrosamines (RR’N-NO), many of which are potentially carcinogenic. The toxicologic significance of nitrosation reaction in vivo and in the natural environment is the subject of much current concern and research.
The use of nitrite in food preservation, as fertilizers and detergent and also in the gas, coke, fertilizer, wood pulp, dye and synthetic fiber industries has caused serious pollution problems[1, 2]. Nitrite is regarded as hazardous compound[3].
Jeena Harjit
et al
______________________________________________________________________________
Numerous methods are reported for determination of nitrite such 12], chemiluminiscence[13-15], polarography
In the present investigation, nitrite is determined spectrophotometrically using PClPCHA. The method is based on the r
liberated iodine is reacted with the solution of hydroxamic acid complexes which gives maximum absorption
PClPCHA complexes, respectively.
The main advantage of the proposed method
higher the stability of complex formed. The method is also free from interference of many foreign species.
Instruments
“SHIMADZU SPECTROPHOTOMTER
quartz cells. A Hanna 8521 model pH meter was used for pH measurements.
Reagents
All the chemicals used were of AR grade. Double distil
Preparation of solutions
0.1g sodium nitrite was dissolved in 100 ml of double distilled water. One pellet of sodium hydroxide and 1 ml of
chloroform were added to prevent nitrite decomposition and bacterial prepared by diluting the stock solution.
EDTA solution which acts as masking agent
were prepared by dissolving 0.1g of respective hydroxamic 3.4g potassium phosphate was dissolved in 98 ml water
became 4.0. The solution was then diluted to the mark with distilled water.
Procedure
The calibration curve was obtained by the following method An aliquot of the sample solution containing
0.4662 µg/25 ml of nitrite was transferred to a series of was added as masking agent. In this
added. Liberation of iodine is indicated by the appearance of yellow colour. Then 1 solution were added and pH was maintained at 4.0
addition of buffer solution and contents immediately by the formation of NO nm, respectively against reagent blank.
J. Chem. Pharm. Res., 2012, 4(7):
______________________________________________________________________________
3696
are reported for determination of nitrite such as kinetic, spectrophotometry , polarography[16], chromatographic[17-18] and flow injection methods[
In the present investigation, nitrite is determined spectrophotometrically using N-PBHA, N The method is based on the reaction of nitrite with acidified potassium iodide to liberated iodine is reacted with the solution of hydroxamic acids in n- hexane to form stable pink
which gives maximum absorptions at 522 nm, 517 nm and 506 nm for N-PBHA, N
proposed method over the other methods is its higher sensitivity, short analysis time and ormed. The method is also free from interference of many foreign species.
EXPERIMENTAL SECTION
SPECTROPHOTOMTER 1700” was used for electronic spectral measurements with 10 mm matched A Hanna 8521 model pH meter was used for pH measurements.
All the chemicals used were of AR grade. Double distilled water was used throughout the experiment
0.1g sodium nitrite was dissolved in 100 ml of double distilled water. One pellet of sodium hydroxide and 1 ml of prevent nitrite decomposition and bacterial growth [21]. Working standard solution prepared by diluting the stock solution. 0.1% aqueous solution of potassium iodide (E.Merck)
EDTA solution which acts as masking agent [22] was also used. N-PBHA, N-PClPBHA and N
of respective hydroxamic acid in 100 ml n-hexane. For making buffer solution was dissolved in 98 ml water and 85% phosphoric acid was added
was then diluted to the mark with distilled water. 6M hydrochloric acid
by the following method:
An aliquot of the sample solution containing 0.00666 - 0.07326 µg/25 ml, 0.00666 - 0.0932 was transferred to a series of 25 ml calibrating flask. To this 1ml of
added as masking agent. In this solution, 1 ml of potassium iodide and 1 ml of 6M hydrochloric acid is indicated by the appearance of yellow colour. Then 1 ml of
H was maintained at 4.0 for N-PBHA, N-PClPBHA and N
addition of buffer solution and contents were diluted to 25ml by adding n- hexane. Pink colour was obtained immediately by the formation of NO2-ligand complex. The absorbance was measured at
reagent blank.
J. Chem. Pharm. Res., 2012, 4(7):3695-3702
______________________________________________________________________________
spectrophotometry[4-6], flouresence[7-flow injection methods[19, 20].
PBHA, PClPBHA and N-action of nitrite with acidified potassium iodide to liberate iodine. The
form stable pink to dark pink PBHA, PClPBHA and
N-its higher sensitivity, short analysis time and ormed. The method is also free from interference of many foreign species.
for electronic spectral measurements with 10 mm matched
led water was used throughout the experiments.
0.1g sodium nitrite was dissolved in 100 ml of double distilled water. One pellet of sodium hydroxide and 1 ml of . Working standard solutions were of potassium iodide (E.Merck) was used. 3% of PClPBHA and N-PClPCHA solutions For making buffer solution and 85% phosphoric acid was added drop wise until the pH hydrochloric acid solution was used.
Jeena Harjit
et al
______________________________________________________________________________
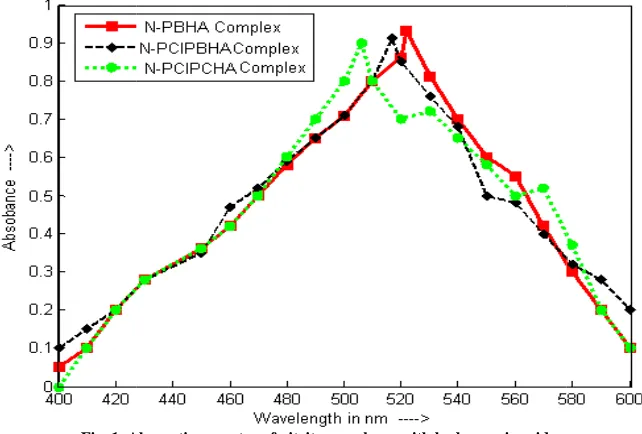
a) Absorption spectrum and calibration curve
After reaction, complex present in organic phase was scanned from (figure1). Maximum absorption values were
[image:3.595.147.468.277.494.2]PBHA, N-PClPBHA and N-PClPCHA PBHA, N-PClPBHA and N-PClPCHA
Fig. 1. Absorption spectra of nitrite complexes with hydroxamic acids
A calibration plot of absorbance against concentration of N
absorption maxima gave a linear and reproducible graph in the concentration range of 0.0002664 – 0.003729 and 0.002664
J. Chem. Pharm. Res., 2012, 4(7):
______________________________________________________________________________
3697
RESULTS AND DISCUSSION
and calibration curve
, complex present in organic phase was scanned from 400 nm to 600 nm against reagent blank Maximum absorption values were observed at 522 nm, 517 nm and 506 nm for nitrite complex with N
PClPCHA, respectively. Therefore, 522 nm, 517 nm and 506 nm
PClPCHA, respectively for the absorbance measurement throughout the experiments.
Absorption spectra of nitrite complexes with hydroxamic acids
A calibration plot of absorbance against concentration of N-PBHA, N-PClPBHA and N-PClPCHA complexes at the absorption maxima gave a linear and reproducible graph in the concentration range of
0.003729 and 0.002664 - 0.01864, respectively (figure3). The beer’s law is obeyed in this range.
J. Chem. Pharm. Res., 2012, 4(7):3695-3702
______________________________________________________________________________
00 nm to 600 nm against reagent blank and 506 nm for nitrite complex with
and 506 nm was selected with N-throughout the experiments.
PClPCHA complexes at the absorption maxima gave a linear and reproducible graph in the concentration range of 0.0002664-0.002930 ppm,
Jeena Harjit
et al
J. Chem. Pharm. Res., 2012, 4(7):3695-3702
______________________________________________________________________________
3698
Fig.2: Calibration plot for N-PBHA, N-PClPBHA and N-PClPCHA complexes
b) Effect of reagent concentration
Optimal concentration of hydroxamic acids were investigated by varying the amount of hydroxamic acids used as reagent.To a series of 1 ml of nitrite standard solution, varying concentration of hydroxamic acids solutions were added and mixed. It was observed that by increasing the concentration of hydroxamic acid absorbance increases and with 3 ml of 0.0001% hydroxamic acid solutions it reaches maximum absorption. Then it decreases rapidly. Therefore 3 ml of 0.0001% concentration of hydroxamic acid solution was selected for all experiments.
Fig.3: Effect of reagent concentration on absorbance of complexes
c) Effect of pH
In order to obtain the optimum condition for the determination of nitrite, absorbance was measured at the pH range 1.0 -10.0 (figure 2). It was observed that the absorbance increased upto 4.0 pH then it started decreasing. Therefore, pH 4.0 was used further for all experiments. The determination was done by using n-hexane as a medium.
Jeena Harjit
et al
J. Chem. Pharm. Res., 2012, 4(7):3695-3702
______________________________________________________________________________
[image:5.595.125.505.67.311.2]3699
Fig. 4: Effect of pH on absorbance of complex
d) Effect of different solvent
Different organic solvents like ethanol, n-butanol, diethyl ether ethyl, methyl ketone, ethyl acetate, chloroform, toluene, n- hexane and carbon tetrachloride were used for determination. n- hexane was found to be most suitable solvent as it gave better and quick phase separation. Therefore, n- hexane was selected.
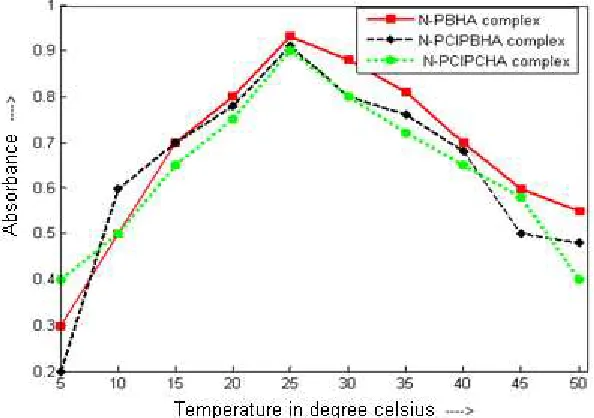
e) Effect of temperature and stability
The effect of temperature on colour stability and absorbance of the complex was studied over the temperature range of 100C – 500C. It was observed that at room temperature (250C) complex gives maximum and stable absorption. On increasing the temperature of reaction, stability and absorbance of the complex decreases. Therefore, all experiments were performed at the room temperature.
Fig. 5: Effect of temperature on absorbance of complex
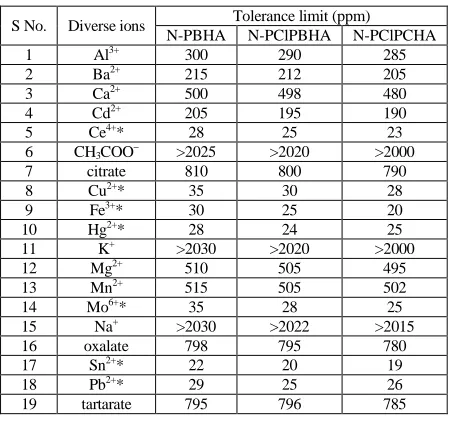
f) Effect of diverse ions
[image:5.595.159.456.449.658.2]Jeena Harjit
et al
J. Chem. Pharm. Res., 2012, 4(7):3695-3702
______________________________________________________________________________
3700
Applications
In order to evaluate the analytical applicability of the method, the procedure established was used for the determination of nitrite in water, soil and biological samples.
Analysis of water samples
[image:6.595.194.419.214.427.2]For analysis of real sample some pretreatment is necessary. All suspended particles should be removed by suitable procedures. For waste water sample, precentrifugation was used. For tap water analysis, chlorine was also removed to prevent oxidation of nitrite. The samples were transferred in 25 ml calibration flask and 0.5 ml of l mol L-1 NaOH and 1 ml of 3% EDTA solution was added and above procedure was applied. The results (Table 2) agreed well with those given by the standard method[31].
Table 1. Effect of diverse ions on the determination of nitrite using N-PBHA, N-PClPBHA and N-PClPCHA as reagents
S No. Diverse ions Tolerance limit (ppm)
N-PBHA N-PClPBHA N-PClPCHA
1 Al3+ 300 290 285
2 Ba2+ 215 212 205
3 Ca2+ 500 498 480
4 Cd2+ 205 195 190
5 Ce4+* 28 25 23
6 CH3COO− >2025 >2020 >2000
7 citrate 810 800 790
8 Cu2+* 35 30 28
9 Fe3+* 30 25 20
10 Hg2+* 28 24 25
11 K+ >2030 >2020 >2000
12 Mg2+ 510 505 495
13 Mn2+ 515 505 502
14 Mo6+* 35 28 25
15 Na+ >2030 >2022 >2015
16 oxalate 798 795 780
17 Sn2+* 22 20 19
18 Pb2+* 29 25 26
19 tartarate 795 796 785
* Masked by EDTA
Analysis of soil sample
Soil sample from manured garden was collected. 4 g of this soil was dried at 55OC in an oven for 12-16 hours. The dried sample was dissolved in water, shaken thoroughly and filtered. The filtrate was subjected to centrifugation for about 15 min. The supernatant liquid was taken and mentioned procedure was applied.
Analysis of biological sample
The proposed method was applied successfully for the determination of nitrite in urine sample. The recoveries are close to 100% which indicates that the proposed method is effective for the determination of nitrite in the sample. The results of above analyses are given in Table 2.
Table 2. Determination of nitrite in water, soil and biological samples
Samples Nitrite added (µg)
Nitrite found(µg) % of Recovery
Present method Reported method[31-32*] Present method Reported method[31-32*] Polluted water (2 ml)
0.00 1.20 1.09 --- ---
0.50 1.69 0.48 98.0 96.0
Tap water (1ml)
0.00 0.90 0.78 --- ---
0.80 1.69 0.79 99.4 98.8
Soil (4g) 0.00 0.85 0.80 --- ---
1.00 1.84 0.99 99.4 99.2
Urine
0.00 1.85 ± 0.05 1.78 ± 0.05* --- ---
0.22 2.04 ± 0.02 1.99 ± 0.03* 98.0 95.0
[image:6.595.98.547.581.702.2]Jeena Harjit
et al
J. Chem. Pharm. Res., 2012, 4(7):3695-3702
______________________________________________________________________________
[image:7.595.81.546.89.236.2]3701
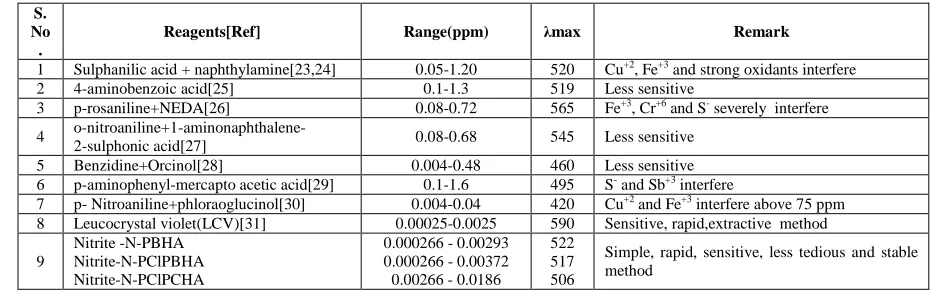
Table 3. Comparison of proposed method with other methods
S. No .
Reagents[Ref] Range(ppm) λmax Remark
1 Sulphanilic acid + naphthylamine[23,24] 0.05-1.20 520 Cu+2, Fe+3 and strong oxidants interfere
2 4-aminobenzoic acid[25] 0.1-1.3 519 Less sensitive
3 p-rosaniline+NEDA[26] 0.08-0.72 565 Fe+3, Cr+6 and S- severely interfere
4 o-nitroaniline+1-aminonaphthalene-
2-sulphonic acid[27] 0.08-0.68 545 Less sensitive
5 Benzidine+Orcinol[28] 0.004-0.48 460 Less sensitive
6 p-aminophenyl-mercapto acetic acid[29] 0.1-1.6 495 S- and Sb+3 interfere
7 p- Nitroaniline+phloraoglucinol[30] 0.004-0.04 420 Cu+2 and Fe+3 interfere above 75 ppm
8 Leucocrystal violet(LCV)[31] 0.00025-0.0025 590 Sensitive, rapid,extractive method
9
Nitrite -N-PBHA Nitrite-N-PClPBHA Nitrite-N-PClPCHA
0.000266 - 0.00293 0.000266 - 0.00372 0.00266 - 0.0186
522 517 506
Simple, rapid, sensitive, less tedious and stable method
CONCLUSION
A spectrophotometric method was developed for estimation of nitrite. All the hydroxamic acids were successfully used for quantitative determination of nitrite at pH 4.0. Since the reaction time is very less, the method is very quick. The colour developed is very stable. The method offers simple and rapid determination of nitrite in water, soil and biological samples.
The solution of reagent made in organic solvent is very stable and can be used for more than a year. The method has ben compaired with other previously reported method Table 3.The results show that with the increase in substitution in hydroxamic acid, the sensitivity of method decreases. Thus, the determination of nitrite with the parent hydroxamic acid, N-PBHA is most sensitive among the hydroxamic acids.
Acknowledgement
We would like to thank Director B.U.I.T Bhopal, Principal Govt.Geetanjali Girls P.G.College Bhopal, Director T.I.E.I.T Bhopal and Director T.I.P Bhopal for providing necessary facilities on time during our research activity.
REFERENCES
[1]D Tiskas , Free Rad. Res., 2005, 39,797-781.
[2]G Eliis; I Adatia; Y Pavah; M Makera, SK; Clin. Biochem., 1998, 31,195-220. [3]G Wu; Jr Morris SM, Biochem. J., 1998, 336, 1-17.
[4]H R Pouretedal ;B Nazari, Journal of the Chinese Chemical Society, 2004, 51, 1353-1356. [5]A Cerda; M. I. Oms; R. Forteza; V. Cerda, Analyst, 1996, 121, 13.
[6]Z Moldovan, Bull. Chem. Soc. Ethiop., 2012, 26(2), 159-169.
[7]KJ Huang; H Wang; YH Guo; RL Fan; HS Zhang, Talanta, 2006, 69(1) ,73-78. [8]Z T Jiang; Y X Guo; L Rong , Chem. Anal. , 2008 , 53, 571.
[9]F Yang Il ; O Hisayuki ; H Kazuo, Journal of Pharmacological and Toxicological Methods, 2009, 59(3) , 153– 155.
[10]X Zhang ; H Wang , Spectrochim Acta A Mol Biomol Spectrosc. 2003, 59(8),1667-72. [11]I Hornyak; L. Szekelyhidi, Microchimica Acta ,1983, 80(5,6) , 355-359.
[12]P Damiani; G. Burini, Talanta, 1986, 33(8), 649–652.
[13]E Nagababu; MR Joseph, Free Radic. Biol. Med., 2007, 42(8), 1146–1154.
[14]L Chao; Q Feng ; M L Jin ; M Yamada, Anal. Chim. Acta , 2002, 474(1,2) , 107–114. [15]M C Icardo ; J. V. G Mateo; J M Calatayud , Analyst, 2001,126(8) ,1423-1427. [16]L Qiong ; Z Tong; L Yong ., J. AOAC , 2002, 85(2), 456-459.
[17]L Merino ;U Edberg ; F Georg; A Per, J. AOAC , 2000, 83(2), 365-375. [18]S F Mou; T H Wang; Q J Sun, J. Chromatogr., 1993,640, 161.
[19]A Chaurasia; KK Verma, Talanta, 1994, 41, 1275.
[20]R Andrade; CO Viana; SG Guadagnin; FGR Reyes; S Rath, Food Chem., 2003, 80, 597. [21]K Veena; B Narayana, Indian J. of Chem. Tech.,2009, 16, 89-92.
[22]K Horita; G Wang; M Satake, Anal Chem. Acta, 1997, 350, 295-303. [23]E Sawicki; T Stanley; J Pfaff; AD Amico, Talanta, 1963, 10, 641. [24]E Sawicki; JL Noe, Anal. Chim. Acta., 1961, 25, 166.
Jeena Harjit
et al
J. Chem. Pharm. Res., 2012, 4(7):3695-3702
______________________________________________________________________________
3702
[27]R Kaveeshwar; VK Gupta, Analyst, 1991,116 ,667. [28]KV Raman, Microchem. J. ,1991, 44, 322.[29]DPS Rathod; PK Tarafdar, J.Indian Chem.Soc. 1989, 26, 185. [30]R Keshari; VK Gupta, J. Ind. Chem. Soc., 1998, 75(7) ,389.