Journal of Chemical and Pharmaceutical Research, 2012, 4(6): 3302-3308
Research Article
CODEN(USA) : JCPRC5
ISSN : 0975-7384
Comparative Biochemical Analysis of the Short Term Responses of
Cicer arietinum L. to Cd and Pb Toxicity
Prasann Kumar*
1and Pankaj Kumar Mishra
21
Department of Plant Physiology, Institute of Agricultural Sciences, Banaras Hindu University, Varanasi, India 2Department of Soil Science and Agricultural Chemistry, Institute of Agricultural Sciences, Banaras Hindu
University, Varanasi, India
_____________________________________________________________________________________________
ABSTRACT
Heavy metal stress is one of the major abiotic stresses that cause environmental pollution in recent decades. These metals unlike other organic pollutants are not degraded and converted into harmless compounds via biological processes. The study indicates that the treatment of Chickpea by cadmium and lead at different stage of growth resulted in decrease of all the biochemical parameters observed such as chlorophyll ‘a’ and ‘b’ content, nitrate reductase activity(E.C.1.6.6.1), proline content, SOD activity(E.C.1.15.1.1) and peroxidase activity(E.C.1.11.1.7).
Key words: Heavy metals, Nitrate reductase, Proline, Peroxidase, Superoxide dismutase.
_____________________________________________________________________________________________
INTRODUCTION
______________________________________________________________________________
dietary staple for less affluent people[7]. A comparison of amino acid content of various dietary proteins reveals that chickpea protein is comparable to beef or fish. It appears; therefore, when supplemented appropriately, it provides an excellent quality of dietary protein to overcome future food shortages.
EXPERIMENTAL SECTION
DESIGN
DETAILS OF LAYOUT
Experimental design: Completely Randomized design (Table:1) No. of treatments combination: Five
No. of replications: Five
BIOCHEMICAL PARAMETER
1. Chlorophyll content [1]
The total chlorophyll content was estimated as described by Arnon method [1949]. The leaves from the sample plants were selected and 0.1g weighed. The leaves were measured with 80% acetone in a mortar and pestle and the aliquot was transferred to the test tubes and centrifuged for 10 min. The supernatant was separated and final volume of the sample was made to 10 ml by 80% acetone. After making the volume to 10 ml the absorbance was recorded at 663nm and 645nm using spectrophotometer and 80% acetone was used a blank. From the absorbance value total chlorophyll content was determined by using the formula.
[mg chlorophyll ‘a’ per gm= [12.7(A663)- 2.64(A645)] x V/(1000 x W)]
2. Nitrate Reductase Activity [8]
For in vivo nitrate reductase activity measurement plant samples were incubated at 30 °C for 30 min in the dark and then 1 mL of supernatant was used for nitrite estimation by diazo coupling reaction and absorption of pink colour was read at 560nm in spectrophotometer [Elico, SL196]
3. Peroxidase Activity [6]
The homogenates (0.2% w/v) of the leaves were prepared in Tris HCI buffer (0.05M, pH 7.0 with I% B mercaptoethanol) and were centrifuged at 12,000 rpm (7000 Xg) for 20 minute at 4 °C. The supernatants obtained were used for enzyme assay. The assay mixture comprised 2 ml of phosphate buffer (0.1M, pH 7.0), 1.0 ml of pyrogallol (0.005M), 1.0 ml of H202 solution (0.05M) and 1 ml of supernatant. The mixture was incubated at 25°C
for 5 minute and the reaction was stopped by adding 0.5 ml of H2SO4 (5% v/v). The amount of purpurogallin formed
was determined by reading the optical density at 420 nm. Peroxidase specific activity was expressed as Units/rag protein where unit is [tmol purpurogallin formed/100 mg tissue/minute at 25 °C.
4. Superoxide dismutase activity [5]
Three ml of the reaction mixture containing 0.1 ml of 1.5 M sodium carbonate, 0.2 ml of 200 mM Methionine, 0.1 ml of 2.25 mM NBT, 0.1 ml of 3 ml MDTA, 1.5 ml of 100 mM Potasium phosphate buffer, 1 ml of distilled water and 0.1 ml of enzyme extract were taken in test tubes in duplicate from each enzyme sample. Two tubes without enzyme extract were taken in test tubes in duplicate from each enzyme sample. Two tubes without enzyme extract were taken as control. The reaction was started by adding 0.1 ml riboflavin (60µM) and placing the tubes below a light source of two 15W florescent lamps for 15 min. Reaction was stopped by switching off the light and covering the tubes by black cloth. Tubes without enzyme extract developed maximum colour. A non irradiated complete mixture that did not develop colour served as blank. Absorbance was recorded at 560nm in spectrophotometer [Elico, SL196].
Enzyme Unit (EU) = (Enzyme Light-(Enzyme light-Enzyme dark))/(Enzyme light/2)
5. Proline content [3]
______________________________________________________________________________
[image:3.595.204.386.155.336.2]and toluene fraction separated by separated funnel. The absorbance of toluene fraction was read at 520 nm with the help of spectrophotometer against toluene blank. Concentration of proline in the plant sample was estimated by estimated by referring to a standared curve of proline.
Table: 1. Details of the Treatment
T1 Control
T2 PbNO3 100 mg/kg
T3 PbNO3 200 mg/kg
T4 CdNO3 100 mg/kg
T5 CdNO3 200 mg/kg
Table: 2. Chlorophyll ‘a’ content
Treatments 30 DAS 45DAS Mean
T1 53.00 57.40 55.2
T2 37.78(28.7) 42.23(26.4) 40.01
T3 35.75(32.5) 41.48(27.7) 38.62
T4 30.43(42.5) 34.00(40.7) 32.22
T5 27.60(47.9) 30.03(47.6) 28.82
Mean 36.91 41.03
SEM± 2.01 2.09
[image:3.595.215.382.237.334.2]C.D. at 5% 6.04 6.27
[image:3.595.218.381.367.459.2]Figure in parentheses represent percentage decrease (-) over control. DAS: Days after sowing
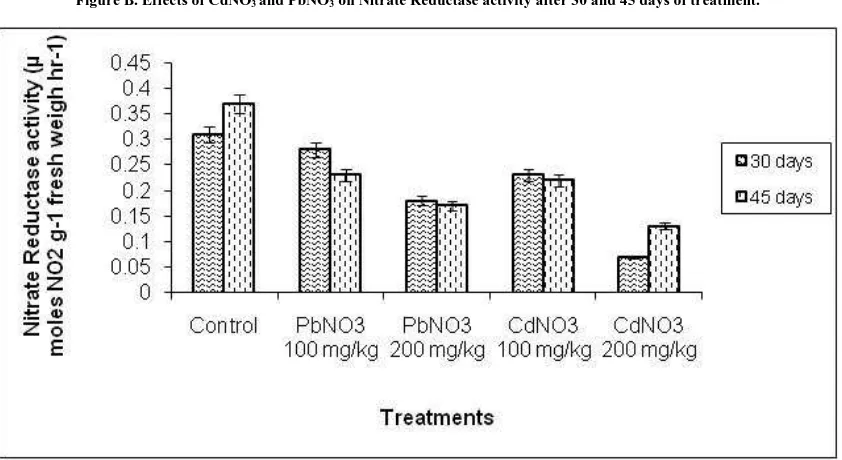
Table: 3. Effects of Cadmium and Lead on Nitrate Reductase activity (µ moles NO2 g-1 fresh weigh hr-1)
Treatment 30DAS 45DAS Mean
T1 0.31 0.37 0.34
T2 0.28(24.3) 0.23(25.8) 0.26
T3 0.18(51.3) 0.17(45.1) 0.18
T4 0.23(37.8) 0.22(29.0) 0.23
T5 0.07(54.0) 0.13(58.0) 0.10
Mean 0.214 0.224
SEM± 0.02 0.02
C.D. at 5% 0.05 0.05
[image:3.595.214.386.491.586.2]Figure in parentheses represent percentage decrease (-) over control. DAS: Days after sowing
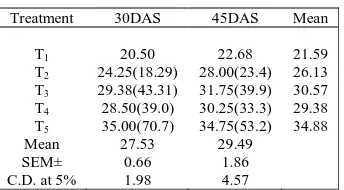
Table: 4. Effect of Cadmium and Lead on Proline content (µg g-1 fresh weight)
Treatment 30DAS 45DAS Mean
T1 20.50 22.68 21.59
T2 24.25(18.29) 28.00(23.4) 26.13
T3 29.38(43.31) 31.75(39.9) 30.57
T4 28.50(39.0) 30.25(33.3) 29.38
T5 35.00(70.7) 34.75(53.2) 34.88
Mean 27.53 29.49
SEM± 0.66 1.86
C.D. at 5% 1.98 4.57
[image:3.595.215.383.620.712.2]Figure in parentheses represent percentage Increases (+) over control. DAS: Days after sowing
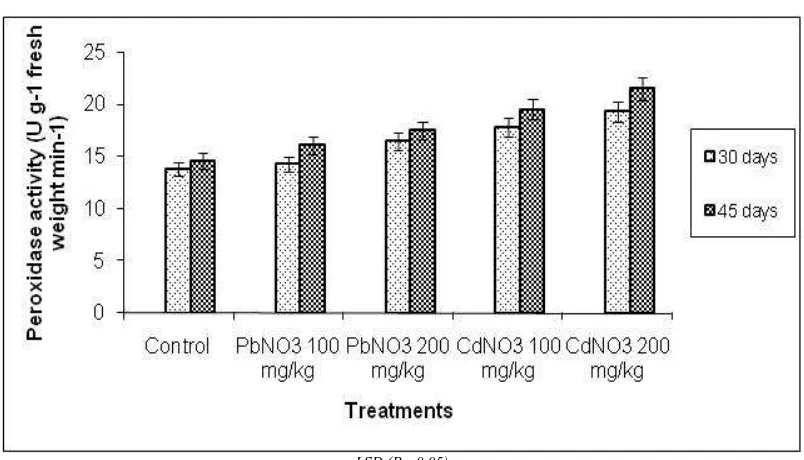
Table: 5. Effect of Cadmium and Lead on Peroxidase activity (U g-1 fresh weight min-1)
Treatment 30 DAS 45DAS Mean
T1 13.8 14.6 14.2
T2 14.3(3.6) 16.0(9.5) 15.2
T3 16.5(19.5) 17.5(19.8) 17.0
T4 17.8(28.90) 19.5(33.50) 18.7
T5 19.3(39.8) 21.5(47.2) 20.4
Mean 16.3 17.8
SEM 0.22 0.33
C.D. at 5% 0.67 1.15
______________________________________________________________________________
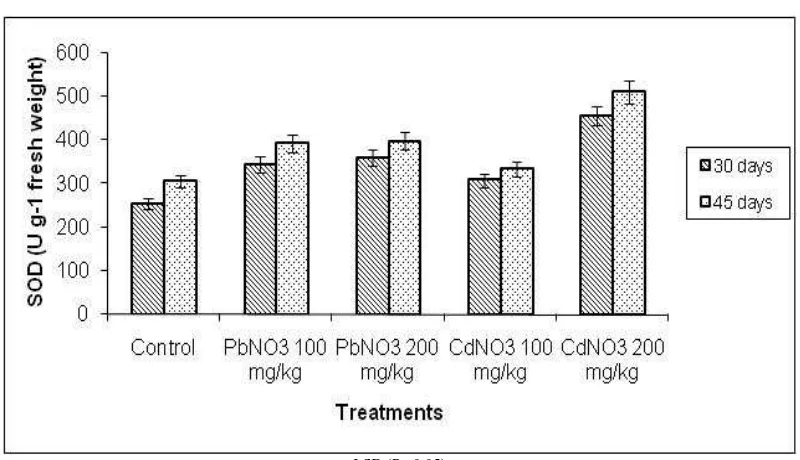
Table: 6. Effect of Cadmium and Lead on SOD (U g-1 fresh weight)
Treatment 30 DAS 45DAS Mean
T1 253.50 305.00 279.25
T2 343.75(35.6) 392.00(28.5) 367.88
T3 358.50(41.4) 396.75(30.0) 377.63
T4 307.50(21.3) 332.75(9.0) 320.13
T5 455.50(79.6) 509.75(67.1) 482.63
Mean 343.75 387.25
SEM± 15.25 20.89
C.D. at 5% 45.72 62.63
[image:4.595.111.484.245.442.2]Figure in parentheses represent percentage Increases (+) over control. DAS: Days after sowing
Figure A. Effects of CdNO3 and PbNO3 on amount of chlorophyll ‘a’ after 30 and 45 days of treatment.
[image:4.595.89.510.458.688.2]LSD (P= 0.05)
Figure B. Effects of CdNO3 and PbNO3 on Nitrate Reductase activity after 30 and 45 days of treatment.
______________________________________________________________________________
Figure C. Effects of CdNO3 and PbNO3 on Proline content after 30 and 45 days of treatment.
LSD (P= 0.05)
Figure D. Effects of CdNO3 and PbNO3 on Peroxidase activity after 30 and 45 days of treatment.
[image:5.595.97.499.377.607.2]______________________________________________________________________________
Figure E. Effects of CdNO3 and PbNO3 on SOD activity after 30 and 45 days of treatment.
LSD (P= 0.05)
RESULTS AND DISCUSSION
BIOCHEMICAL OBSERVATIONS
1. CHLOROPHYLL ‘a’ CONTENT (mg g-1 fresh weight)
The leaf chlorophyll ‘a’content decreased with the increase level of cadmium and lead [Table 2, Figure A]. There was significant reduction in chlorophyll ‘a’content at both the growth stage. Maximum reduction in chlorophyll ‘a’ reduction was observed in T5 at 30 DAS, whereas, least reduction was observed in T2 (5.6%) as compared to control.
Chlorophyll ‘b’ content showed similar trend as to chlorophyll ‘a’.
2. EFFECT OF CADMIUM AND LEAD ON NITRATE REDUCTASE ACTIVITY
Significant and greater reduction in Nitrate Reductase activity was observed at higher dosed of cadmium and lead [Table 3, Figure B]. Cadmium showed greater depression in Nitrate Reductase activity as compared to lead. Treatment T5 recorded the least Nitrate Reductase activity and significantly differed with all other treatments. The
presence of Cd and Pb significantly inhibited the activity of the enzyme Nitrate Reductase and the degree was dependent on the concentration of the metal used.
3. PROLINE CONTENT
Proline content increases from 30 DAS to 45 DAS in all the treatment except T5. Highest significant increase in
proline content was observed in T5 (70.7%) as compared to control [Table: 4, Figure C] Greater increase in proline
content was observed at 30 DAS as compared to 45 DAS. Lead and cadmium at higher doses resulted in higher production of proline in plant. The accumulation of free proline in response to heavy metal is widespread among plant. The accumulation of proline is a gene regulated process which is the consequence of the overexpression of the gene involved in its biosynthesis and depression of those involved in its degradation, in the plants under stress. The functional significance of proline accumulation under heavy metal stress might include water balance maintenance, scavenging of hydroxyl radical or metal chelates.
4. EFFECTS ON PEROXIDASE ACTIVITY
There was significant increase in peroxidase activity observed with increasing doses of cadmium and lead [Table: 5, Figure D]. Mean peroxidase activity recorded at both growing stages was least in control and highest in T5 among
______________________________________________________________________________
5. EFFECTS ON SUPEROXIDE DISMUTASE ACTIVITY
Changes in superoxide dismutase (SOD) activity are presented in table 5. SOD activity increased significantly with increasing doses of cadmium and lead at both growth stages. Cadmium greater increases in SOD activity as compared to lead [Table 6, Figure E]
CONCLUSION
The proline content, peroxidase and superoxide dismutase activity increase with increasing of heavy metal indicating the induction of antioxidant defence mechanism for self-defence, although they may not cope fully with the production of ROS during heavy metal stress. The highest concentration of Cd and Pb was found to be more injurious for plant.
REFERENCES
[1] Arnon DJ; Stout PR, Plant Physiol. ,1949 14: 371-375.
[2] Allowway BJ , Heavy Metals in soils, 2nd ed. Blackle Academy and Professional Publishers: London.
1995,P368.
[3] Bates LS; Waldren RP ;Teare ID, Plant and Soil ,1973.,39: 205-208. [4] Baker AJM., J. Plant Nutr. 1990 3:643-654.
[5] Dhindsa RS, Plumb-Dhindsa P and Thorpe TA J. Exper. Bot. 1981. 32: 93- 101. [6] Kar M and Mishra D Plant Physiol, 1976 ,57: 315-319.
[7] Roy RK; Sharma RP ; Singh KSP International Chickpea Newsletter ,2001, 18: 33-34. [8] Srivastava RC,;Mukherji D ; Mathur SN ,Ann. Bot. , 1980, 45: 717-718.