Study of laser induced plasma using two focusing techniques
11
0
0
Full text
(2) Journal of Science and Technology. 1 INTRODUCTION Study of laser induced plasma becomes an interesting field since it is important for both the basic understanding of laser-material interactions and many practical applications (Motz, 1979). Plasma is an ionized state (Yaffa and Eliezer, 1989). Treumann and Baumjohann (1997) defined plasma as a special class of gases that include a large number of electrons and ionized atoms and molecules. Therefore plasma can be defined as a hot (up to keV) electrons and ions. One of the major difficulties in understanding of the physical nature of plasma formation is the fact that plasma formation is a high-speed phenomenon (Noriah Bidin, 1995). As well as to capture the ultrafast plasma formation, a high-speed photography technique must be applied (Mohd. Kamarulzaki Mustafa, 2000). A high intensity light can create plasma. When a pulsed laser is focused into a medium and a certain pulse energy threshold is exceeded, a so-called breakdown is occurred (Ready, 1971). This phenomenon is characterized by the existence of bright luminous spark followed by an audible sound. The power density in this breakdown region is around 1010 – 1012 W/ cm2. Hence, the electric field strength E0 of a focused laser beam of power density Pd is given by (Horisawa et. el, 2002), 1/ 2 (1) E 0 = 2.74 × 10 3 Pd For a laser pulse with power density of Pd = 1010 – 1012 W/cm2, the corresponding electric field strength is 106 –10 7 V/cm. The important of this high power density is for generating breakdown which responsible to initiate plasma. At the focal region, for a start at least one atom is ionized resulting in a seed electron, which is accelerated by an inverse bremstrahlung in the high electric field of the laser pulse (Ahmad Hadi Ali, 2004). After gaining sufficient energy additional atoms are ionized by collisions, thus multiplying the number of electrons. Hence, the density of free charge carriers increasing in avalanche after a few consecutive iterations and plasma is created. In this present paper, a systematic study of the plasma formation in air produced by IR laser pulse was carried out. A single lens and combination lenses technique were employed to focus the laser beam. The results obtained could give a better understanding regarding the influence of plasma formation induced by laser. 2 EXPERIMENTAL SETUP A Nd:YAG laser series HY200 manufactured by Lumonics with 1.06 µm fundamental wavelength and 8 ns pulse duration (FWHM) was employed as a source of energy. An external trigger delay unit was utilized to synchronize 86.
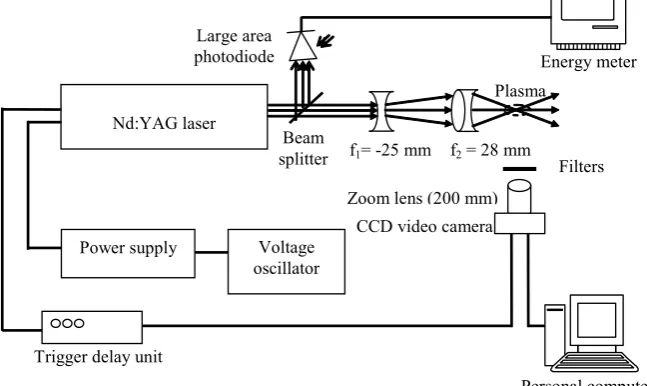
(3) Journal of Science and Technology. the signal of Nd:YAG laser and the recording media. The laser beam was focused using two techniques. The first technique utilized a single lens and the second techniques consume a combination of positive and negative lenses. The whole experimental set up is shown in Figure 1. The plasma formation was visualized and recorded using a Pulnix TM-6EX CCD video camera. The CCD video camera was interfaced via frame grabber to the personal computer. Matrox Inspector version 2.1 software was utilized for image processing and analysis purposes.. Large area photodiode. Energy meter Plasma. Nd:YAG laser. Beam splitter. f1= -25 mm. f2 = 28 mm. Filters. Zoom lens (200 mm) Power supply. CCD video camera. Voltage oscillator. Trigger delay unit Personal computer. Figure 1 Experimental setup to generate plasma using infrared laser.. Prior to any measurement, magnification factor was calibrated as discussed in other text (Ahmad Hadi Ali and Noriah Bidin, 2003). The plasma formation were studied at various peak powers by changing the voltage oscillator of the Nd:YAG laser. The generation of optical breakdown was identified by the appearance of electrical spark at the focal point. 3 RESULTS The activities generated at the focal point was visualized and recorded in conjunction with a high-speed photographic technique. The typical results obtained from a single lens technique are shown in Figure 2. These pictures were arranged in the increasing order of the laser peak power. The configuration of the plasma produced by focusing the laser using a single lens technique is in the ellipsoid form. The plasmas were captured 87.
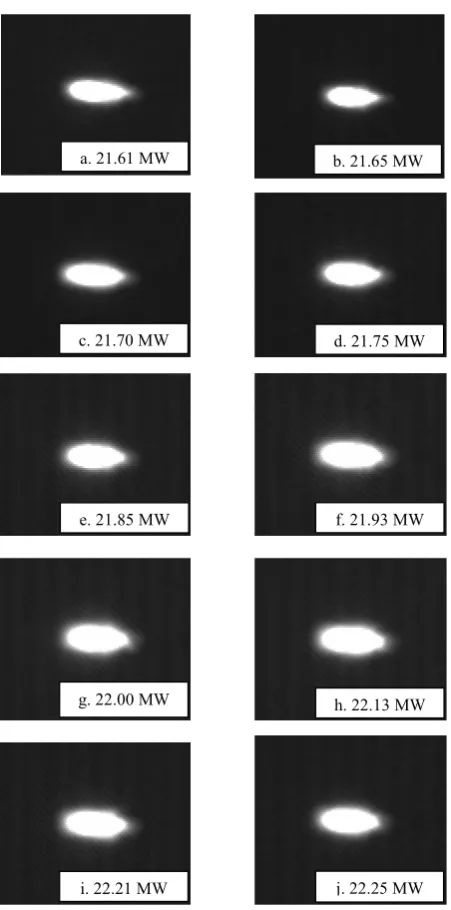
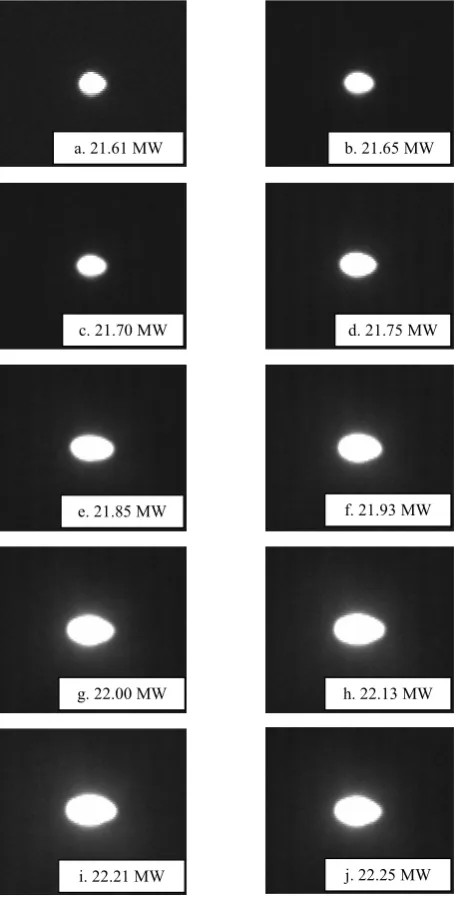
(4) Journal of Science and Technology. in the dark room. Consequently, the grabbed images consist of a bright area which is corresponds to the appearance of ellipsoidal plasma with a dark background. The brightness of the plasma gives more than enough light to CCD video camera, in fact a filter was employed to avoid over exposure. Thus a very clear image can be recorded. The ellipsoidal plasmas were observed expanded as the laser peak power delivered at the focal point was increasing in the range of 21.61 MW to 21.93 MW. However as the peak power gets higher within 22.00 MW to 22.25 MW, the size of the plasma unstably changed. In certain case, it reducing, expanding and reducing again within that region. In average, the plasma is comprised of two stages. One is the inner part in which the degree of brightness is illustrated as totally white. While the external part of the plasma comprised of a very blurred image. The existing of a blurring part creates a difficulty in measurement. The precise measurement of plasma becomes skeptical. This is lead to a large of uncertainty. The blurring part is observed getting thicker upon the peak power. The typical results obtained from combination lenses technique are shown in Figure 3. In the same manner as previous picture of Figure 2, the frames are arranged in the increasing order of the laser peak power. Focusing the laser beam using a combination lenses technique produced broadlyellipsoid plasma. This particular configuration becomes longer and wider unstably as the laser peak power increases within the range of 21.61 MW to 22.21 MW. The size of plasma was slightly dropped at the highest laser peak power of 22.25 MW. In average the size of plasma is relatively small. Obviously the blurred part of the plasma induced using combination technique is observed thinner than the previous Figure 2. This leads to a high accuracy of plasma size measurement. This kind of image is referring as significant plasma. The existing of plasma is very clear and concentrated. This quality of plasma promises a good mechanism for damaging and interaction with target material. Cutting edge for example will be smoother and explosion or implosion will take place in uniform distribution.. 88.
(5) Journal of Science and Technology. a. 21.61 MW. b. 21.65 MW. c. 21.70 MW. d. 21.75 MW. e. 21.85 MW. f. 21.93 MW. g. 22.00 MW. h. 22.13 MW. i. 22.21 MW. j. 22.25 MW. Figure 2 Plasma formation produced using a single lens technique consisting of 28 mm focal length lens. Magnification factor is 10x.. 89.
(6) Journal of Science and Technology. a. 21.61 MW. b. 21.65 MW. c. 21.70 MW. d. 21.75 MW. e. 21.85 MW. f. 21.93 MW. g. 22.00 MW. h. 22.13 MW. i. 22.21 MW. j. 22.25 MW. Figure 3 Plasma formation produced using a ombination lenses system. Magnification factor is 10x.. The characteristics of the plasma were determined based on the recorded images obtained in Figure 2 and Figure 3. They were described in terms of plasma length as well as plasma width. 90.
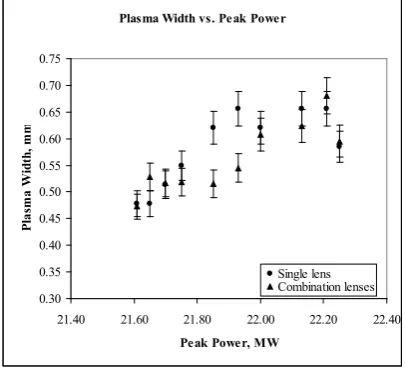
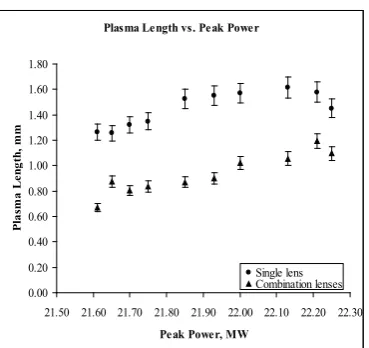
(7) Journal of Science and Technology. The graph of plasma width against laser peak power is shown in Figure 4. Two curves are drawn together on the same graph for comparison purposes. Generally the peak power which is in the range of 21.70 MW to 22.13 MW indicates that the plasma width obtained from a single lens technique is greater than the one by using a combination lenses technique. Both plasma width curves are increases nonlinearly upon the given laser peak power. However the changes of plasma width due to single lens technique is found drastically increases in compared with the plasma width from a combination lenses technique. At higher peak power, the plasma width curves produced from a single lens technique dropped and remained almost constant. In contrast, the plasma width curves produced from a combination lenses technique decreasing at highest peak power. Plasma Width vs. Peak Power 0.75 0.70 Plasma Width, mm. 0.65 0.60 0.55 0.50 0.45 0.40 0.35. Single lens Combination lenses. 0.30 21.40. 21.60. 21.80. 22.00. 22.20. 22.40. Peak Power, MW. Figure 4. Plasma width profile with respect to peak power of laser beam.. Figure 5 shows the graph of plasma length as a function of peak power. The length of plasma obtained from combination lenses technique obviously shorter than the single lens technique. Initially the curve for combination lenses technique is found nonlinearly increases. After achieving a maximum point of 22.21 MW, the plasma length is drop slightly and remains constant throughout the end. The results obtained from a single lens technique indicates that the plasma length is increasing to the given peak power of 22.13 MW. However, as the laser peak power gets higher, apparently the plasma length drop slightly and stay almost constant throughout the end of experiment. In general, the plasma length produced from a single lens technique was found much greater than the combination lenses technique. 91.
(8) Journal of Science and Technology Plasma Length vs. Peak Power 1.80 1.60 Plasma Length, mm. 1.40 1.20 1.00 0.80 0.60 0.40 0.20. Single lens Combination lenses. 0.00. 21.50 21.60 21.70 21.80 21.90 22.00 22.10 22.20 22.30 Peak Power, MW. Figure 5 Plasma length profile as a function of peak power.. 4 DISCUSSION It should be noted that the power delivered at the focal point also determined by the oscillator voltage. It is known that the voltage oscillator controls the output of the laser beam. The laser output was found unstable at higher voltage, hence influence the plasma formation. Consequently, the plasma formation in air is dependent on the laser output. If the laser output is fluctuated, the breakdown as well as the plasma formation is also affected. The size of the plasma depends on the focusing technique of the laser beam. As shown in Figure 6, when the laser is focused using a single lens technique, a long focal length was introduced. As a result, elongated plasma was produced. The experimental spot area or the width of plasma was found almost constant. This result is in a good agreement with the theory of Gaussian beam profile. When the elongated plasma was formed there is a possibility of multiple breakdowns to occur. This is subjected to the occurrence of gross explosion at the focal point. Normally the formation of plasma will associated with the generation of acoustic shock waves. If multiple breakdowns occur, a gross multiple shock waves also involved. The gross explosion will creates turbulence in the surrounding area. This is the possible reason why the capturing event at the focal point became blurred.. 92.
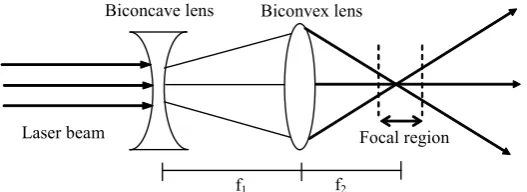
(9) Journal of Science and Technology. Lens. Focal region. Laser beam Focal length. Figure 6 Focused laser beam by using a single lens.. The optical geometry of the combination lenses technique is shown in Figure 7. When the laser is focused, a short plasma length is induced with a smaller beam waist. This experimental result is in good agreement with the theory of Gaussian beam. When the beam waist is small, meaning that the power density is large thus emitted brighter sparkling or huge breakdown. Under this circumstance more atoms were ionized and spreading through the focal region, thus generated stronger plasma. Apparently the width of plasma was found greater especially when the peak power is high. Biconcave lens. Biconvex lens. Laser beam. Focal region f1. f2. Figure 7 Combination of two lenses to focus the laser beam. The focal region is quite small, thus there is a small spot compared with single lens technique.. Another advantage offered with this combination lenses technique is that it produces a point source of breakdown. It indicates that only a single explosion is created at the focal point accompanied with a very energetic and symmetrical distribution of acoustic shock wave. Such mechanism offers a lot of advantages in application either in material processing or for fusion reaction. Hence this type of plasma became preferable in many applications such as in laser machining and laser fusion research. 93.
(10) Journal of Science and Technology. 5 CONCLUSION Plasma was successfully generated in air by focusing a Q-switched Nd:YAG laser. Two techniques were employed to focus the laser beam that is a single lens and combination lenses. The plasma formation was grabbed by using a high-speed photography technique and analyzed with the aid of image processing system. Ellipsoidal plasma was obtained from a single lens technique, whereas broadly-ellipsoidal plasma was obtained from combination lenses technique. The length of ellipsoidal plasma was found greater than the broadly-ellipsoidal one. However the plasma width from both techniques does not appeared so much different, in fact the width of plasma from a single lens was found bigger compared to the result from combination lenses technique at higher power. Overall, the combination lenses are preferable technique for producing more energetic plasma. 6 ACKNOWLEDGEMENTS The authors wish to express their thanks to the Universiti Tun Hussein Onn Malaysia and Universiti Teknologi Malaysia and the government of Malaysia for financial support (No. 71771). REFERENCES [1] Ahmad Hadi Ali. (2004). “Diagnostic of Laser Plasma Using Optical Techniques.” Master Thesis. Universiti Teknologi Malaysia. [2] Ahmad Hadi Ali and Noriah Bidin. (2003). “Diagnostic of Laser Plasma by Using High-speed Photographic Technique and Interfaced with Image Processing System.” Proc. of IMAGE 2003. Sarawak, Malaysia. [3] Horisawa H., H. Kuramoto, H. Emura, N. Uchida and I. Kimura. (2002). “Fundamental Study of a Relativistic Laser Plasma Thruster.” Proc. of ISTS. B-21:1-6. [4] Mohd. Kamarulzaki Mustafa. (2000). “Characterized Cavitations and Damage Studies Due To Shock Wave Mechanism.” Master Thesis: Universiti Teknologi Malaysia. [5] Motz, H. (1979). “The Physics of Laser Fusion”. London: Academic Press. [6] Noriah Bidin. (1995). “Studies on Laser Induced Cavitation Erosion and Mechanism of Cavitation Damage.” PhD Thesis: Universiti Teknologi Malaysia. [7] Ready J. F. (1971). “Effect of High-Power Laser Radiation.” Orlando: Academic Press. [8] Treumann R.A. and W. Baumjohann. (1997. “Advanced Space Plasma Physics.” London: Imperial College Press. 94.
(11) Journal of Science and Technology. [9]. Yaffa and S. Eliezer. (1989). “The Fourth State of Matter: An Introduction to the Physics of Plasma.” Bristol: Adam Hilger.. 95.
(12)
Figure
+3
Related documents
All of the participants were faculty members, currently working in a higher education setting, teaching adapted physical activity / education courses and, finally, were
The aim of this study was to evaluate the current vac- cination status of the HCWs in all of the Departments different from the Department for the Health of Women and Children of one
The hypothesis for the second research question stated that students who participate in restorative justice practices experience a difference in Active Accountability compared to
As with other rapidly reconfigurable devices, optically reconfigurable gate arrays (ORGAs) have been developed, which combine a holographic memory and an optically programmable
As consequence, this paper contains a study on the effect of the rotor bar number on the torque (average and quality) of five-phase induction machines under different supply
One of the tools of performance measurement that has been used in the past is performance appraisal that has been reintroduced in a new format and design and implementation within the
Furthermore, while symbolic execution systems often avoid reasoning precisely about symbolic memory accesses (e.g., access- ing a symbolic offset in an array), C OMMUTER ’s test
How Many Breeding Females are Needed to Produce 40 Male Homozygotes per Week Using a Heterozygous Female x Heterozygous Male Breeding Scheme With 15% Non-Productive Breeders.
