i
THE DEVELOPMENTAL COGNITIVE TRAJECTORY OF THE 22Q11.2 DELETION.
CLARE ELIZABETH HARVEY JACOBSON
A thesis submitted in partial fulfilment of the requirements of the School of Psychology, University of East London for the degree of Doctor of
Clinical Psychology.
iii ABSTRACT
Background: The 22q11.2 deletion (22qDS) is a microdeletion syndrome which commonly leads to an uneven profile of Learning difficulties (LD), with superior verbal compared to nonverbal intellectual and memory functions in children and adolescents. However, in adult samples these differences reduce. There are two accounts of the reduction in the verbal-nonverbal discrepancy with age. The dominant hypothesis is that normative measures of verbal intelligence decline and so approximate nonverbal intelligence. The other is that normative nonverbal intelligence increases while verbal intelligence remains stable. Few studies have investigated this longitudinally and none with a UK sample. Aim: The aim was to examine longitudinally the pattern of developmental cognitive changes in verbal and nonverbal intellectual and memory functions. Method: Twenty-four participants with 22qDS, who were previously cognitively assessed between 2004- 2008 were re-examined in 2011. Intellectual, memory and executive functions were assessed.
Results: Verbal and nonverbal intellectual functions were in the below average range and verbal was significantly superior to nonverbal intelligence at initial assessment. This discrepancy disappeared at follow-up as expected. Contrary to the dominant hypothesis, no cognitive scores declined with age. Nonverbal intellectual functioning improved to approximate the original level of verbal functioning, which remained stable. There were no verbal-nonverbal discrepancies in memory, but there were unexpected gender effects.
iv
CONTENTS PAGE
Title Page i
Abstract ii
List of Appendices x
List of Tables xi
List of Figures xii
Acknowledgements xiv
1.0 INTRODUCTION 1
1.1 Overview 1
1.2 Research position 1
1.3 22qDS 2
1.3.1 Definition, incidence and history 2
1.3.2 The general cognitive phenotype 3
1.3.3 Psychosocial impact 4
1.3.4 Mode of Inheritance 4
1.3.5 Nature of the Microdeletion 5
1.3.6 Genotype 5
1.3.7 Psychiatric diagnosis 6
1.3.7.1 Psychosis 6
1.3.8 Cardiac disease 7
1.3.9 Cleft palate and hearing impairment 7
1.4 Cognitive functions 8
1.4.1 Intelligence 8
1.4.1.1 Definition 8
1.4.1.2 Measurement 9
1.4.2 Memory 10
1.4.2.1 Measurement 10
v
1.4.3.1 Measurement 11
1.4.4 Cognitive Phenotype 11
1.5 Literature review 12
1.5.1 Literature search 12
1.5.2 Intelligence 13
1.5.2.1 Full scale IQ 13
1.5.3 Verbal and Nonverbal intellectual discrepancies in children with 22qds
18
1.5.3.1 Statistical significance 18
1.5.3.2 Clinical Significance of the VIQ>PIQ discrepancy
18
1.5.3.3 Base rates 18
1.5.3.4 Verbal and Nonverbal intellectual discrepancies in adults with 22qds
19
1.5.3.5 Theories about the nonverbal deficit and its causes
20
1.5.3.6 Changes in the cognitive profile with age 22qds
21
1.5.3.7 Cross-sectional Studies 22
1.5.3.8 Longitudinal studies 25
1.5.3.9 The differential nature of the developmental decline in VCI/VIQ versus PRI/PIQ
27
1.5.4 The importance of studying developmental trajectories
27
1.5.5 Memory in 22qDS 28
1.5.5.1 Verbal and visual memory 28 1.5.5.2 Verbal Rote Learning and complex verbal
memory
29
6
1.5.5.4 Memory development 30
1.5.6 Executive function and Working Memory 31
1.5.6.1 Initiation 31
1.5.6.2 Cognitive Flexibility and response inhibition 31
1.5.6.3 Working memory 32
1.5.6.4 Developmental considerations 33
1.5.6.5 Summary 33
1.5.7 Methodological challenges in previous research 33
1.5.7.1 Diagnostic method 33
1.5.7.2 Sample size 34
1.5.7.3 Ascertainment and selection bias 34
1.5.7.4 Control groups 34
1.5.7.5 Tests used across studies 35
1.6 Summary 35
1.7 Hypotheses 36
1.7.1 Intelligence 36
1.7.3 Memory 37
1.7.4 Executive function 38
1.7.5 Why is this important? 38
1.7.6 Present Study aims 39
2.0 METHODOLOGY 40
2.1.1 Different tests between times 1 and 2 40 2.1.2 Standard scores versus raw scores in developmental
trajectories
41
2.1.3 Different within-sample cognitive batteries at T2 42
2.1.4 Prorating method 42
2.1.5 Are the tests reliable enough to capture cognitive change? 43
3.0 METHOD 44
7
3.2 Ethical issues 44
3.2.1 Informed consent 44
3.2.2 Confidentiality and anonymity of the data 44
3.2.3 Feedback 45
3.2.4 Implications of psychiatric screens 45
3.2.5 Cost to participants 45
3.3 Research design 45
3.4 Original sample at T1 46
3.4.1 Selection bias 46
3.5 Inclusion/Exclusion criteria 47
3.6 Recruitment procedure 47
3.7 Testing sites 48
3.8 Neuropsychological assessment 48
3.9 Measures of Cognitive Function 49
3.9.1 Subtests comprising VCI: 49
3.9.1.1 Similarities: 49
3.9.1.2 Vocabulary: 49
3.9.2 Subtests comprising PRI: 50
3.9.2.1 Block design: 50
3.9.2.2 Matrix reasoning: 50
3.9.3 Subtests comprising PSI: 50
3.9.3.1 Symbol search 50
3.9.3.2 Coding 50
3.9.4 WM Subtest: Digit Span 50
3.9.6 Properties 52
3.9.7 Memory Measures 52
3.9.7.1 Memory subtests 52
3.9.7.1.1 Verbal Paired Associates (WMS-III)/Word pairs (CMS)
52
viii
3.9.7.1.4 Dot locations (CMS) 53
3.9.7.1.5 Visual reproduction (WMS-III) 54
3.9.7.1.6 Properties 54
3.9.8 Rationale for using different tests 54
3.9.9 Executive function 54
3.9.9.1 Phonemic fluency 55
3.9.9.2 Semantic fluency 55
3.9.9.3 Colour-word interference 55
3.9.10 Assessment of psychiatric pathology 56
3.9.10.1 Self-report measures 56
3.10 Data management 56
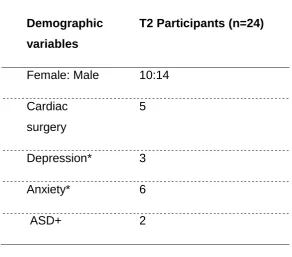
3.11 Participants at T2 56
3.12 Demographic information 57
4.0 RESULTS 59
4.1 Data analysis 59
4.2 Exploratory data analysis 59
4.3 Intellectual Functions 67
4.3.1 How the relationship between VCI and PRI at T2 compares with that at T1
67
4.3.2 Is the temporal interaction between VCI and PRI confounded by using different subtests?
69
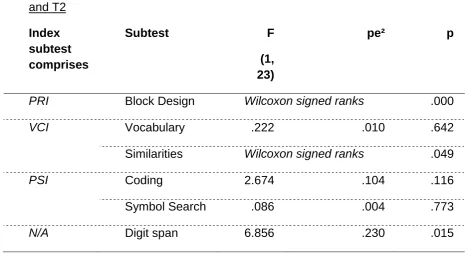
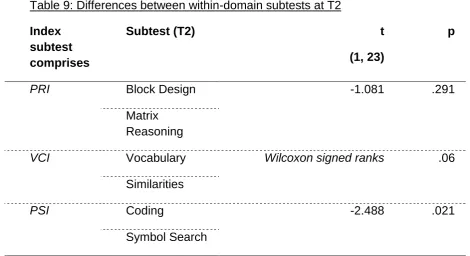
4.3.3 Changes in other subtests between T1 and T2 70 4.3.4 Within domain subtest differences 71
4.4 Memory 72
4.4.1 Immediate memory 72
4.4.2 Delayed memory 77
4.4.3 Rote Learning 80
4.5 Executive function 83
5.0 DISCUSSION 84
5.1 Overview 84
9
5.3 Intelligence 85
5.3.1 Hypothesis one 85
5.3.2 Hypothesis two 86
5.3.3 Possible causes of the results 88 5.3.3.1 Neurocognitive ‘Catch up’ 88
5.3.3.2 Genotype variation 89
5.3.3.3 Psychosocial interventions 89 5.3.3.4 Methodological artefact 89
5.4 Memory 91
5.4.1 Hypotheses three and four 91
5.4.2 Possible reasons why the patterns for intellectual functioning and memory differ
92
5.4.2.1 Sample size 92
5.4.2.2 Low FSIQ 93
5.4.2.3 Tests 93
5.4.3 Were components in the Visual Memory Index differentially affected?
94
5.4.4 Unexpected finding: A gender effect 95
5.4.5 Implications for memory 96
5.5 Current Cognitive Profile with Executive Functioning 97
5.5.1 Summary 98
5.6 General methodological issues 99
5.6.1 Psychiatric screening and diagnosis 99 5.6.2 Use of different tests of intelligence at T1 and T2 100
5.6.3 Construct validity 100
x
5.6.4 Appropriate Normative Samples 101
5.6.5 Limitations of standard scores 101
5.6.6 Statistical considerations 102
5.6.7 Puberty and non-linear developmental effects 102 5.6.8 The current sample’s representativeness of the
wider 22qDS population
102
5.6.8.1 Age range 103
5.6.8.2 Demographic data 104
5.6.8.3 Potential Confounding factors related to 22qDS
104
5.6.8.4 Cultural and health care differences 105
5.7 Critical reflection of the research 105
5.8 Strengths of the study 106
5.9 How to frame findings in 22qds 106
5.9.1 Impact of research 107
5.9.2 Psychosocial impact 107
5.10 Implications and Future 108
5.10.1 Clinical implications 108
5.10.1.1 Routine assessment 108
5.10.1.2 Reassessment 109
5.10.1.3 Educational strategies 109
5.10.1.4 Current information about 22qDS 110 5.10.1.5 Implications for Clinical Psychologists 110
5.10.2 Research implications 111
5.10.2.1 Evaluating the role of psychosocial intervention
111
5.10.2.2 Control groups 111
5.10.2.3 Multi-centre research 111
5.10.2.4 Tests 112
5.10.2.5 Longitudinal data from birth 112
5.11 Conclusions 112
xi List of Appendices
Appendices Page
Appendix 1: UEL Registration 143
Appendix 2: UEL Ethical Approval 144
Appendix 3: National Research Ethics Committee Approval 145 Appendix 4: Great Ormond Street Hospital NHS Foundation Trust
Research and Development Approval
146
Appendix 5: Cover Letter: Participant Version 147
Appendix 6: Cover Letter: Parent Version 148
Appendix 7: Information Sheet: Participant Version 149 Appendix 8: Information Sheet: Parent Version 152 Appendix 9: Consent Form: Participant Version 156
xii List of Tables
Table Page
Table 1: IQ Results from the present and other studies investigating 22q11
14
Table 2: Cross-sectional studies with an age-cognition correlation 24 Table 3 Longitudinal studies of cognitive development 26 Table 4: Subtests used in WISC-III (T1) and WISC-IV/WAIS-IV (T2) 51 Table 5a: Differences between T1 participants followed-up versus
dropped out
57
Table 5b: Demographic information 57
Table 6: Scores at T1 61
Table 7: Scores at T2 64
Table 8: Differences in mean WISC/WAIS subtest scaled scores between T1 and T2
71
xiii List of Figures
Figures Page
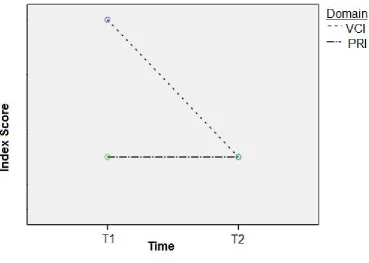
Figure 1: Hypotheses one and two 37
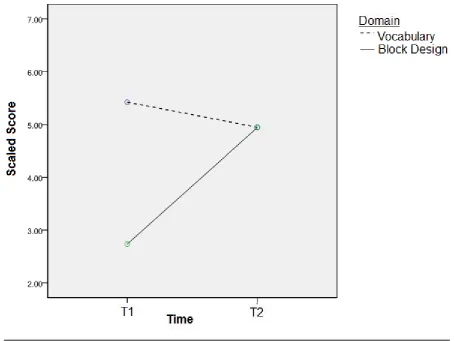
Figure 2: Interaction between VCI and PRI over time. 68 Figure 3: Interaction between time and subtest: Vocabulary and Block
Design
70
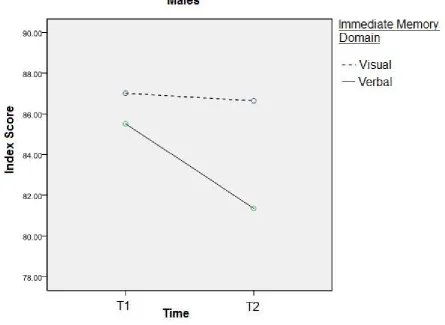
Figure 4: Interaction between time and immediate memory indexes (visual and verbal) for males
74
Figure 5: Interaction between time and immediate memory indexes (visual and verbal) for females
75
Figure 6: Each individual female’s visual immediate memory at T1 and T2 (n=10)
76
Figure 7: Each individual male participant’s performance at T1 and T2 visual immediate memory (n=14)
77
Figure 8: Immediate Memory: Males under 16 78
Figure 9: Immediate Memory: Males over 16 78
Figure 10: Immediate Memory: Females under 16 78
Figure 11: Immediate Memory: Females over 16 78
Figure 12: Delayed Memory: Males under 16 79
Figure 13: Delayed Memory: Males over 16 79
Figure 14: Delayed Memory: Females under 16 79
Figure 15: Delayed Memory: Females over 16 79
Figure 16: Performance on verbal and visual rote learning subtests at T1 and T2 for males
xiv
Figure 17: Performance on verbal and visual rote learning subtests at T1 and T2 for females
xv ACKNOWLEDGEMENTS
I have many more people to thank than this allotted space will allow. Let me initially express my sincerest thanks to everyone who offered their support and guidance in the completion of this thesis.
Firstly, I would like to express my deepest gratitude to all the families and
individuals who took the time to participate in this research, particularly to the 24 individual participants for their enthusiasm and commitment during the cognitive assessments! Thank you also to participants and their families for taking the time out to travel to the assessment base. Special thanks to Dr Joanna Shearer for putting me in touch with the wonderful families and individuals who took part in the study. Further thanks to Dr. Alex Habel for giving me the benefit of his insight and years of clinical experience.
There are a number of people without whom this thesis would not have been completed. I would like to express my sincerest thanks to my supervisors, Professor Derek Moore and Dr Matthew Jones Chester for their guidance
throughout the planning and writing phases of the thesis. I owe you both a huge debt of gratitude for educating me in the science and art of writing a thesis!
I am very grateful to all my friends who were never lacking in words of
encouragement and accepted my brief withdrawal from the social world. My deepest thanks to my parents for their never-ending support, love and
encouragement.
1 1.0 INTRODUCTION
1.1 OVERVIEW
The 22q11.2 deletion (22qDS) is a microdeletion syndrome which presents as a neurodevelopmental disorder with physical and learning difficulties (LD). A phenotypic cognitive profile of inferior nonverbal compared to verbal functions is widely reported in children with the syndrome but not in adults. This suggests differential atypical cognitive development, but there are very few exploratory studies. The key question on which this thesis focuses is what happens to the discrepancy between verbal and nonverbal cognitive functions as individuals with 22qDS grow up. Gender effects are also examined.
In this section I will describe the clinical profile of 22qDS and its main features. Cognitive functions are defined. The literature on the intellectual, memory and executive functions of children and adults with 22qDS is reviewed with a focus on development. Limitations of the evidence base and the rationale for the present study are discussed. First, I will consider the epistemological stance from which the research has been undertaken.
1.2 RESEARCH POSITION
This research has taken a critical realist position in relation to the constructs of ‘intelligence’, ‘memory’ and ‘psychiatric disorder’. Psychiatric disorder is herein referred to as ‘psychiatric diagnosis’ to recognise it as a social construction rather than merely a reflection of internal pathology. Previous research refers to IQ and non-/disabled IQ ranges. These terms are used below in a critical
2 1.3 22QDS
1.3.1 Definition, incidence and history
22qDS is a deletion on chromosome 22. Most affected individuals have the same large 3 megabases (3Mb) microdeletion in the region q11.2, while a few have a smaller ‘nested’ deletion (McDonald-McGinn & Zackai, 2008). 22qDS has only been detectable with virtually 100% accuracy since the introduction of the fluorescence in situ hybridisation (FISH) test in 1992. 22qDS is the most common genetic deletion syndrome (McDonald-McGinn, Kirschner &
Goldmuntz, 1999), with an estimated incidence of 1 in 4000-7000 live births (Botto et al., 2003; Driscoll et al., 1993). The pattern of inheritance is autosomal dominant (Shprintzen, 2008). 22qDS mainly presents de novo, but familial inheritance is reported in around 6-10% of cases (McDonald-McGinn et al., 2001).
22qDS has been described for about 40 years under different labels according either to the primary medical condition, for example ‘velo-cardio-facial
syndrome’ (VCFS) or ‘conotruncal anomalies face syndrome’, or eponomously, such as DiGeorge syndrome, Shprintzen syndrome, Cayler syndrome, Takio syndrome, Sedlackova syndrome and CATCH 22 (Antshel et al., 2005a). Since 22qDS became identifiable through FISH in 1992, there has been a 10-fold increase in published literature (Kates, 2008).
3
Attention deficit hyperactivity disorder (ADHD) and oppositional-defiant disorder (ODD) are frequently diagnosed in preschool years, affective and anxiety
disorders in adolescence, and by early adulthood up to 30% of affected persons receive a diagnosis of schizophrenia or schizophrenia-like psychosis (Feinstein, Eliez, Blasey & Reiss, 2002; Gothelf et al., 2004; 2007a; Green et al., 2009; Murphy, Jones & Owen, 1999).
1.3.2 The general cognitive phenotype
The concept of cognitive phenotype is discussed below (Section 1.4.4).
Despite the high prevalence of LD reported in 22qDS, few research groups had investigated cognition until the last 20 years (Majerus, Linden, Braissand & Eliez, 2007), partly due to affected individuals surviving into adulthood following advances in cardiac surgery.
There is substantial variability in the cognitive phenotype of individuals with 22qDS. One consistent finding is that general intellectual functioning is in the ‘low borderline’ range (Antshel, Fremont & Kates, 2008). The child/adolescent 22qDS literature suggests that spelling, word decoding and verbal rote learning are relative strengths. Common weaknesses are in visuo-spatial
reasoning/memory, maths attainment and executive functioning.
A nonverbal learning disability (NVLD) is widely reported in children and
adolescents with 22qDS (Goldberg, Mootzkin, Marion, Scrambler & Shprintzen, 1993; Golding-Kushner, Weller, & Shprintzen, 1985; Moss, Batshaw & Solot, 1999; Scherer, D’Antonio, & Kalbfleisch, 1999; Scherer, D’Antonio, & Rodgers, 2001; Swillen, Devriendt & Legius, 1997), but not in adult samples. This
4 1.3.3 Psychosocial impact
Cleft palate can cause speech difficulties, affecting early verbal interactions and potentially social confidence at school (Fraser, 2007). Phenotypic facial
differences, hearing, cardiac and speech difficulties could increase the likelihood of children with 22qDS experiencing marginalisation and exclusion (Fraser, 2007), potentially fostering low self-esteem, in turn impacting on individuals’ school work, and subsequent cognitive development. Karmiloff-Smith (2008) notes that the frequent differential treatment by parents of an infant with 22qDS compared to a typically developing infant is likely to affect cognitive development. For example, Mervis and Bertrand (1997) argue that overcorrection of early linguistic categorisations in children with 22qDS compared to their siblings can paradoxically adversely affect later semantic abilities. Thus the meaning of 22qDS to parents impacts on the child’s cognitive development.
Lepach and Petermann (2011) note how aspects of 22qDS, such as
characteristic small stature, unclear speech (cleft palate), lack of sporting skills (due to cardiac problems), and academic difficulties can increase the risk of psychiatric diagnosis and social withdrawal as well as shape attitudes to school and general psychosocial development. The psychosocial stress of coping with the disabling features of 22qDS was considered throughout data collection and interpretation and is discussed in the critical review.
1.3.4 Mode of Inheritance
There are many features of 22qDS that are likely to contribute to the cognitive profile, for example the mode of inheritance. Parents with 22qDS usually
display milder clinical impairments than their affected children or individuals with
5
Greater cognitive impairment is reported in familial compared to de novo cases with 22qDS (Gothelf et al., 2007b; Swillen et al., 1997). Swillen et al. (1997) attributed the familial/de novo difference to the lower educational and
socioeconomic status of parents with 22qDS and also their partners, suggesting assortative mating. However, De Smedt, Devriendt, Fryns, Vogels, Gewillig & Swillen (2007) found that parental educational level influenced intellectual functioning in children with both familial and de novo deletions. Genomic imprinting or an effect from the sex of the parent from whom 22qDS is inherited may also be important (Glaser et al., 2002).
1.3.5 Nature of the Microdeletion
The possibility that atypical deletions may account for the heterogeneity of the cognitive phenotype has been investigated. It is unclear if the nature of the microdeletion affects cognition in 22qDS, with negative studies from Bassett, Marshall, Lionel, Chow and Scherer (2008), Gerdes, Solot, Wang, McDonald-McGinn and Zackai (2001) and Green et al. (2009). However, all are limited by small sample size, especially for atypical deletions.
1.3.6 Genotype
6
Gothelf et al. (2007d) found that children with 22qDS and the COMT Met allele had greater decline in normative measures of verbal intelligence (VIQ) and language in adolescence with worse psychotic symptoms than those with the COMT Val allele. However, Bearden et al. (2004) found that children with the Met allele had better executive function than those hemizygous for the Val allele. While it is important to keep COMT status in mind when reviewing the literature on cognition in 22qDS, not all studies have founddifferences between Met and Val allele carriers in cognition (Glaser, Debbane & Hinard, 2006; Kates, Antshel & Abdulsabur, 2006; van Amelsvoort et al., 2008) or the risk of
schizophrenia diagnosis (Bassett, Caluseriu & Weksberg, 2007). Much of the research on genotypes does not consider psychosocial factors associated with psychiatric diagnoses or cognitive profiles.
1.3.7 Psychiatric Diagnosis
Psychiatric diagnoses of ASD and ADHD are common in children with 22qDS. Antshel et al. (2006) found that nearly half of their child/adolescent 22qDS sample met the DSM-IV criteria for ADHD. Antshel et al. (2010) diagnosed major depression and anxiety in one fifth and nearly half of participants respectively. These psychiatric diagnoses and their prescribed medications have associated neuropsychological deficits, which may complicate
interpretation of the pure cognitive profile in 22qDS.
1.3.7.1 Psychosis
7
with schizophrenia compared to the general population (Gothelf, Schaer & Eliez, 2008; Karayiorgou et al., 1995; Usiskin et al., 1999).
The high prevalence of schizophrenia has influenced the focus of research on cognition in 22qDS. A lack of longitudinal studies means that ‘risk factors’ such as decreased VIQ (Gothelf et al., 2007d) are often viewed as static, whereas the findings from adult studies reviewed below (Henry, van Amelsvoort, Morris, Owen, Murphy & Murphy, 2002) indicate that cognition, and therefore ‘risk factors’, may change with age. More longitudinal data on cognitive
development are needed.
1.3.8 Cardiac disease
Cardiac disease could affect cognition through episodes of hypoxia or cerebral emboli causing brain damage. Attallah et al. (2007) found that children with 22qDS who underwent neonatal cardiac surgery had a worse
neurodevelopmental outcome than those who did not. However, Moss et al. (1999) and Swillen et al. (1997) found no differences in mean FSIQ between children with 22qDS with and without congenital heart disease or palatal abnormalities. Gerdes et al. (2001) found no association between cardiac status and developmental scores in preschool children. But there is a wider literature on the adverse effects of congenital heart disease on
neurodevelopment in babies (Miller et al., 2007) and school entry age (Majnemer et al., 2006). The distinction between presence and absence of congenital heart disease may have been too crude to support the negative results of Swillen et al. (1997) and Gerdes et al. (2001). It should be
considered as a potential complicating factor when investigating cognition in 22qDS.
1.3.9 Cleft palate and hearing impairment
8
Glue ear and middle ear infections are common in children with cleft palate. Prolonged middle ear infections between the ages of 6- and 12-months have been found to put children at risk of cognitive delay at 3-years, but the effect is not strong and no longer detectable at 5-years (Johnson et al., 2000) or 9-years (Chalmers Stewart, Silva & Mulvena, 1989). The potential indirect impact of both factors should be considered when reviewing the cognitive profile reported in 22qDS.
1.4 COGNITIVE FUNCTIONS
Before reviewing the literature on cognitive development in persons with 22qDS, cognitive functions are described. Cognition tends to be divided into several main areas. Here, the following three are considered: Intelligence, memory and executive functioning.
Cognitive function is usually described in terms of index and scaled scores, which refer to an individual’s position along the normal distribution of scores for, usually, an age-matched sample. If a child of 5-years obtained a raw score of 8/10 on a spelling test, their score might place them in the top end of a normal distribution when compared to age-matched peers, but if a 20-year old achieved the same raw score on the same test, it could place them towards the lower end compared to an age-matched normative sample. Scaled and index scores therefore communicate more information about a person’s performance.
1.4.1 Intelligence 1.4.1.1 Definition
9
Over 90 definitions of intelligence existed in the early 1960s (Lezak, 1988). It is beyond the scope of this chapter to review the concept of intelligence, which is discussed elsewhere (Howe, 1990; Jensen, 1998; Sternberg, 1988). According to Sternberg (1985), intelligence is a person’s "mental activity directed toward purposive adaptation to, selection and shaping of, real-world environments relevant to one’s life".
Intelligence tests formerly yielded a unitary measure, ‘g’, but more recently are based on factor analysis and yield numerous measures, which purport to reflect different aspects, such as processing speed, ‘working memory’ (WM) and verbal and nonverbal intelligence.
1.4.1.2 Measurement
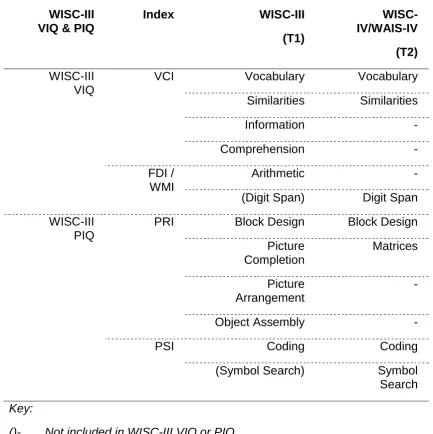
The concept of intelligence is operationalised through tests. The Wechsler series of intelligence tests is the most widely used. It comprises a set of subtests purporting to measure different cognitive functions. It yields a scaled score for performance on each subtest and overall index scores: Verbal
Comprehension Index (VCI), Perceptual Reasoning Index (PRI), Processing Speed Index (PSI) and Working Memory Index (WMI), which was previously called the Freedom from Distractibility Index (FDI). When reviewing the
previous literature, the FDI and WMI are used interchangeably. These indices combine to produce one global measure of intellectual functioning: Full Scale Intelligence Quotient (FSIQ). The VCI score represents verbal intellectual functioning, and the PRI, nonverbal intellectual functioning. Different age appropriate versions of the Wechsler intelligence scales exist for children (6-16 years) and adults (17+ years). The subtests in each version are similar, but items differ in age appropriateness.
10
The Wechsler tests are updated with newer versions. Currently the Wechsler Intelligence Scale for Children –Fourth Edition (WISC-IV, Wechsler, 2004) and adult version, Wechsler Adult Intelligence Scales-Fourth Edition (WAIS-IV, Lichtenberger & Kaufman, 2009), are in use. Previously the third edition, WISC-III (Wechsler, 1991) and WAIS-WISC-III (Wechsler, 1997), were used. In addition to the index scores listed above, the WISC-III and WAIS-III also yield an overall estimate of verbal and nonverbal intellectual functioning, VIQ and PIQ
respectively. The fourth edition no longer uses VIQ and PIQ, now considered outmoded, because they are confounded by other measures, such as WM and processing speed, respectively. The VCI and PRI are arguably purer measures of verbal and nonverbal functioning than VIQ and PIQ.
1.4.2 Memory
Memory is the ability to retain information and use it adaptively (Fuster, 1995). There are various classifications based on dual systems (Baddeley, 2002; Squire & Knowlton, 2000), broadly including storage (short-versus long-term), content (non-/declarative or implicit/explicit, semantic versus episodic, verbal versus visual), and retrieval (recall versus recognition). Memory can be broken down into three stages: encoding (information is registered), storage
(information is consolidated) and retrieval (information is accessed).
1.4.2.1 Measurement
Batteries of memory tests are used to examine the components of memory. The Wechsler Memory Scale-third edition (WMS-III, Psych Corp, 1997) and Children’s Memory Scale (CMS, Cohen, 1997) are the most widely used. They include subtests that yield individual scaled scores and overall index scores, which represent immediate and delayed recall and recognition memory for both verbal and visual material. The updated WMS-IV is available but, at the time of writing, the corresponding child version has not yet been published.
11 1.4.3 Executive Functioning
The term executive function refers to interrelated ‘higher order’ cognitive functions involved in planning, organisation, rule following, shifting focus between tasks, inhibition, initiation and WM (Stuss & Alexander, 2000). It is classically a frontal lobe function (Fuster, 2008; Goldman-Rakic, 1987).
1.4.3.1 Measurement
These concepts are operationalised through numerous tests, including concept formation, sorting, problem-solving, estimation, fluency, division and rapid switching of attention, and inhibition (Lezak et al., 2004). A review of all the tests is beyond the scope of this chapter but specific tests used in 22qDS research are discussed below.
1.4.4 Cognitive Phenotype
There are two contrasting definitions of cognitive phenotype. Flint and Yule (1994) propose that “a behavioural phenotype should consist of a distinctive behaviour that occurs in almost every case of a genetic or chromosomal
disorder, and rarely (if at all) in other conditions”. Secondly, “this behaviour has a direct and specific relationship to the genetic or chromosomal anomaly that gives rise to the physical manifestations of the syndrome”. In contrast, Dykens (1995) proposes a less stringent definition, namely that a behavioural
phenotype involves “the heightened probability or likelihood that people with a given syndrome will exhibit certain behavioural and developmental sequelae, relative to those without the syndrome”.
The common ground between the definitions is that most behaviours
12
Secondly, the former definition demands uniqueness, whereas the latter allows for “shared” outcomes between disorders. The methodology of examining behavioural or cognitive phenotypes has been reviewed by Flint (1996), Hodapp and Dykens (2005), and Skuse (2000).
The concept of cognitive phenotype is important. It has clinical value for the parents of a child suffering from a genetic disorder whose disturbed cognition differs from that of its siblings. Framing cognitive deficits in the context of their diagnosis can provide parents with reassurance that cognitive weaknesses are neither their fault nor caused intentionally by the child. The concept of cognitive phenotypes can guide educational advice. Additionally, it aims to clarify the biological and genetic bases of cognition as well as environmental contributions.
The perspective taken here is that of Dykens (1995). Studies in 22qDS document a variable cognitive profile, partly related to variability in intellectual functioning (Jacobson et al., 2010). Research, reviewed below, has raised the possibility that the ‘cognitive phenotype’ in childhood may differ from that in adulthood.
1.5 LITERATURE REVIEW 1.5.1 Literature Search
13
22qDS. The names of delegates listed in attendance at the most recent biennial international 22qDS conference were also entered into the above databases to find any publications that could have been missed. Most articles were quantitative in method, but a few qualitative papers were also included.
1.5.2 Intelligence
Research into the intellectual functioning of school-aged children with 22qDS has typically used standardized IQ batteries, most commonly the WISC-III (Wechsler, 1991). Although the WISC-III and WAIS-III yield VCI and PRI, studies have tended to report the VIQ and PIQ. This means that much of the literature below examined the relationship between verbal and nonverbal intellectual functions using measures which are confounded by other factors.
1.5.2.1 Full Scale IQ
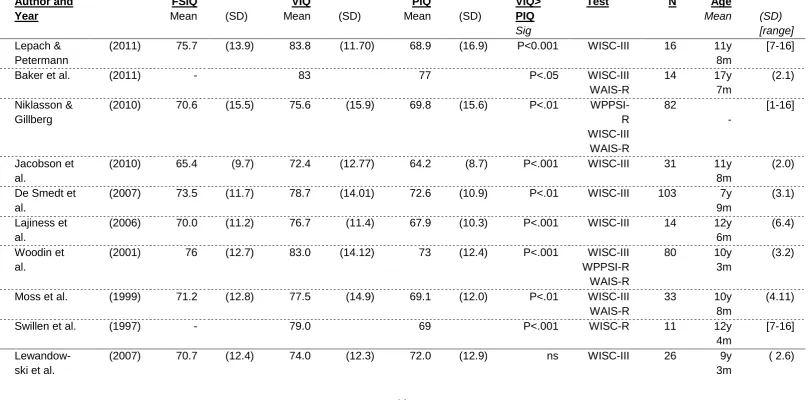
Table 1 reports all studies of IQ in this population and shows, where reported, discrepancies between VIQ and PIQ. The majority of child/adolescent samples’ mean FSIQ scores falls in the ‘borderline range’, while 40-52% fall in the Mild LD range (De Smedt et al., 2007; Moss et al., 1999; Swillen et al., 1997). Moderate (FSIQ: 35-55) or severe LD (FSIQ: 20-35) are rarely described (Swillen et al., 1997; Zinkstok & van Amelsvoort, 2005).
Most studies find little effect of gender on FSIQ, though many are
14 Table 1: IQ Results from the present and other studies investigating 22q11
Author and Year
FSIQ
Mean (SD)
VIQ
Mean (SD)
PIQ
Mean (SD)
VIQ> PIQ
Sig
Test N Age
Mean (SD) [range]
Lepach & Petermann
(2011) 75.7 (13.9) 83.8 (11.70) 68.9 (16.9) P<0.001 WISC-III 16 11y 8m
[7-16]
Baker et al. (2011) - 83 77 P<.05 WISC-III
WAIS-R
14 17y
7m
(2.1) Niklasson &
Gillberg
(2010) 70.6 (15.5) 75.6 (15.9) 69.8 (15.6) P<.01 WPPSI-R WISC-III WAIS-R 82 - [1-16] Jacobson et al.
(2010) 65.4 (9.7) 72.4 (12.77) 64.2 (8.7) P<.001 WISC-III 31 11y 8m
(2.0) De Smedt et
al.
(2007) 73.5 (11.7) 78.7 (14.01) 72.6 (10.9) P<.01 WISC-III 103 7y 9m
(3.1) Lajiness et
al.
(2006) 70.0 (11.2) 76.7 (11.4) 67.9 (10.3) P<.001 WISC-III 14 12y 6m
(6.4) Woodin et
al.
(2001) 76 (12.7) 83.0 (14.12) 73 (12.4) P<.001 WISC-III WPPSI-R WAIS-R
80 10y
3m
(3.2)
Moss et al. (1999) 71.2 (12.8) 77.5 (14.9) 69.1 (12.0) P<.01 WISC-III WAIS-R
33 10y
8m
(4.11)
Swillen et al. (1997) - 79.0 69 P<.001 WISC-R 11 12y
4m
[7-16]
Lewandow-ski et al.
(2007) 70.7 (12.4) 74.0 (12.3) 72.0 (12.9) ns WISC-III 26 9y
3m
15 Author and
Year
FSIQ
Mean (SD)
VIQ
Mean (SD)
PIQ
Mean (SD)
VIQ> PIQ
Sig
Test N Age
Mean (SD) [range]
Oskarsdot-tir et al.
(median):
(2005)
74.0 82.0 69.0
ns WPPSI
WISC-III WAIS-R
26 7y 6m
[6-19]
van
Amelsvoort et al.
(2004) 74.9 (10.7) 75.9 (7.51) 77.2 (16.9) ns WAIS-R 15 32y
5m
(10.71)
Henry et al. (2002) 74 (11.5) 74.2 (7.59) 77.8 (17.7) ns WAIS-R 19 35y
1m
(11.42) Antshel et
al.
(2010) - 74.8 (14.90) 70.5 (14.7) - WISC-III
WAIS-III
70 15y
0m
(2.1)
Azuma et al. (2009) 67 (8.0) 71.0 (15) 67 (7) - WISC-III 8 12y
0m
(2.0)
Green et al. (2009) 72.6 11.9 76.3 13.9 73.6 (11.8) - WISC-III 50
-
[12-17]
Green et al. (2009) 67.3 10.3 70.2 (10.5) 68.5 (11.8) - WAIS-III 27
-
[18-23] Debbane´ et
al.
(2008) 68.0 11.9 71.2 14.68 70.2 (12.1) - WISC-III 33 17y
2m
(7.43) Majerus et
al.
(2007) 65 [44–
82]
72.0 [46– 94]
64 [48–
76]
- WISC-III WAIS-III
14 15y
8m
[ 7– 31] Gothelf et al.
Original
(2007d)
74.5
(15.1) 80.1 (14.3) - - WISC-III
WAIS-III
19 13y
1m
(4.0)
Gothelf et al.
Follow-up
(2007d) - 75.5 (15.4) - - 17y
9m
16 Author and
Year
FSIQ
Mean (SD)
VIQ
Mean (SD)
PIQ
Mean (SD)
VIQ> PIQ
Sig
Test N Age
Mean (SD) [range]
Antshel et al.
(2007) 78.3 (10.9) - - - WISC-III 67 10y
8m
(2.7) Chow et al.
Schizophren ia subgroup
(2006) 71.6 (8.0) - WAIS-R 29 30y
6m
(7.7)
Z-scores: -1.94 (0.54) -1.54 (0.5)
Chow et al.
22qDS Controls
(2006) 74.8 (6.1) 25y
0m
(9.0)
Z-scores: -1.54 (0.62) -1.32 (0.6)
Gothelf et al. (2005) 75.8 (13.8) 79.1 (13.9) - - WISC-III
WAIS-III
24 13y
3m
(3.7) Antshel et
al. Females
(2005) 76.3 (11.7) 79.2 (13.4) 77.2 (10.2) - WISC-III 40 10y
8m
(2.5)
Antshel et al.
Males
(2005) 68.9 (12.8) 73.8 (14.4) 68.9 (11.0) - WISC-III 50 11y
1m
(2.7)
Lajiness et al.
(2005) 70.0 (11.2) 76.6 (11.4) 67.9 (10.3) - WISC-III 9 12y
6m
(6.4) Bearden et
al.
(2001) 75.6 (12.6) - - - WISC-III 29 10y
3m
17 Key:
VIQ>PIQ sig; VIQ>PIQ discrepancy significance for the sample
*SDs and ranges were not available for all studies.
-: Not reported
WPPSC: Wechsler Primary and Preschool Scale for Children – Revised (Wechsler, 1989) WAIS-R: Wechsler Adult Intelligence Scale – Revised (Wechsler 1981)
WISC-III: Wechsler Intelligence Scale for Children, 3rd edition (Wechsler 1991)
SBI-IV: Stanford-Binet Intelligence Scale, 4th Ed. (S-B; Thorndike et al., 1987)
T1=Time 1; T2=Time 2.
Con=controls
18
1.5.3 Verbal and Nonverbal intellectual discrepancies in children with 22qDS
1.5.3.1 Statistical significance
Studies investigating the cognitive profile of children with 22qDS typically yield statistically significantly higher mean VIQ than PIQ for groups. While the reported VIQ>PIQ discrepancy suggests an NVLD, the opposite profile
(PIQ>VIQ)is also reported in a small proportion. Campbell and Swillen (2005) reviewed four studies and found a mean VIQ>PIQ discrepancy of 8-10 IQ-points. However, Antshel et al. (2008) reviewed the same four studies with an additional three and found a mean VIQ>PIQ discrepancy of only 4-5 points; although still statistically significant in most studies, the effect sizes were
smaller. The degree of VIQ>PIQ discrepancy presents mixed findings. Table 1 is grouped into three sections: studies that found a statistically significant
VIQ>PIQ discrepancy, those that did not, and those that do not report it.
Moss et al. (1999) found a significant and greater discrepancy between mean VCI (79.2) and PRI (68.0) than between mean VIQ (77.5) and PIQ (69.1). As mathematics is a common weakness in children with 22qDS (Moss et al., 1999), performance on the arithmetic subtest, comprising VIQ, may have lowered the VIQ, reducing the verbal>nonverbal discrepancy; the VCI is a purer measure.
1.5.3.2 Clinical Significance of the VIQ>PIQ discrepancy
Most studies not only yield a statistically significant mean VIQ>PIQ discrepancy in child/adolescent 22qDS samples, but also a ‘clinically significant’ VIQ>PIQ discrepancy, which is defined in the WISC-III as a discrepancy of at least 11.3 points (Wechsler, 1997), although this figure varies for different ages. This level of discrepancy is termed ‘clinically significant’ because, according to the
normative reference groups, it is unusual to have a discrepancy that large.
1.5.3.3 Base Rates
19
Lezak et al., 2004) and in adults using the WAIS-R (Matarazzo & Herman, 1984; 1985; Matarazzo et al., 1988). The standardized US population norms for the WISC-III reveal that 40.5% of the 6-16 year old population have a VIQ-PIQ discrepancy of 11.3 points in either direction, and about half this figure in one direction (Wechsler, 1989; 1991). A VIQ>PIQ discrepancy of more than 12 points was found in only 10% of those with FSIQ<79 and 16% of those with FSIQ 80-89, (Kaufman, 1976). Similar results have been reported with the WAIS-R in healthy adults (Matarazzo & Herman, 1984) and psychiatric
inpatients (Iverson et al., 2001). Although not formally examined, the positive correlation of degree of VIQ-PIQ discrepancy with FSIQ on the WISC-R probably applies to successive versions of the child and adult Wechsler intelligence scales.
The VIQ>PIQ trend has been widely replicated and reaches clinical significance in about 17.5%-38% of children with 22qDS (De Smedt et al., 2007; Goldberg et al., 1993; Golding-Kushner et al., 1985; Lajiness-O’Neill et al., 2005; 2006; Murphy et al., 2004;Niklasson, Rasmussen, Óskarsdóttir & Gillberg, 2001; Scherer et al., 1999; 2001; Swillen et al., 1997; Wang et al., 2000). Moss et al. (1999) and Jacobson et al. (2010) found that 13/33 and 15/31
children/adolescents with 22qDS respectively had a clinically significant VIQ>PIQ discrepancy, thus nearly four- and five-fold the expected rate in the general population with similar FSIQ.
1.5.3.4 Verbal and Nonverbal intellectual discrepancies in adults with 22qDS Due to the high rates of diagnosis of schizophrenia in adults with 22qDS, the research focus in adults has centred on schizophrenia and its associated
20
The same research group investigatedthe cognitive profile of 28 adults with 22qDS, of whom 13 had a diagnosis of schizophrenia, including participants from the Henry et al. (2002) study (van Amelsvoort et al., 2004). Differences between the mean VIQ and PIQ were negligible, suggesting the VIQ>PIQ discrepancy reported in childhood may disappear by adulthood.
In the only study reporting on an entirely separate adult 22qDS sample, Chow et al. (2006) did not analyse the discrepancy between two verbal and nonverbal subtests. However, overall performance appeared worse for verbal than nonverbal functioning, unlike the general pattern found in childhood.
IQ scores are expected to remain relatively stable throughout life (Sigelman & Rider, 2006; Weinert & Hany, 2003). The lack of VIQ>PIQ discrepancy in these adult samples suggests atypical development from childhood to adulthood. Antshel et al. (2008) note that the lack of VIQ>PIQ discrepancy reported in adults by Henry et al. (2002) may reflect psychosis and/or a decline in
normative verbal skills with age (Gothelf et al., 2005; Gothelf et al., 2007d). The results of the Henry et al, 2002, study are difficult to interpret because of
confounding psychosis diagnosis, pharmacological treatment in eight participants and no separate subgroup analysis.
1.5.3.5 Theories about the nonverbal deficit and its causes
21
NVLD was conceptualised by Rourke (1987; 1989; 1995) as selective difficulties discriminating and recognising visual information and patterns, and deficits in problem solving, based on right hemisphere white matter abnormalities.
The performance of children with 22qDS suggests selective rather than global cognitive impairment. Swillen et al. (1999) and Moss et al. (1999) suggest that the combination of VIQ>PIQ discrepancy and higher scores in reading and spelling than in mathematics is consistent with NVLD (Rourke, 1995). This view has been challenged by the presence of specific language problems (Campbell & Swillen, 2005), which typically persist into adult life (Solot et al., 2001) and are unexpected in a pure NVLD profile. Nonetheless, deficits are generally greater in visuo-spatial perception, reasoning and processing (Simon et al., 2002).
As the VIQ>PIQ discrepancy is also observed in children with 22qDS without LD (FSIQ>70), Moss et al. (1999) suggest that it may characterise the
syndrome per se rather than general LD. But the NVLD-like profile is not unique to 22qDS; it is also reported in Turner Syndrome and Williams syndrome
(Martens, Wilson & Reutens, 2008; Swillen et al., 1993). Most children with 22qDS appear to have an NVLD profile with specific language deficits, but few studies have explored how the NVLD profile develops.
1.5.3.6 Changes in the cognitive profile with age
Cross-sectional studies suggest that the VIQ>PIQ discrepancy evident in childhood disappears by adulthood. The hypothesised underlying cognitive pattern could be increasing PIQ/PRI or decreasing VIQ/VCI. Preliminary conclusions may be drawn from cross-sectional designs, which report
22 1.5.3.7 Cross-sectional Studies
Table 2 summarises the cross-sectional studies which have examined correlations of age with cognition, usually IQ. The value of the correlation coefficient is greater if there is more rather than less variability among the observations (Goodwin & Leach, 2006). The age range has usually been narrow (except in Green et al., 2009), risking underestimation of an age or developmental effect on IQ; or it has encompassed children either side of puberty or during adolescence, periods of major and non-linear change in the brain and cognition (Blakemore & Choudhury, 2006). Two studies had small sample sizes, so may be statistically underpowered to detect change.
Campbell, Stevens and Morris (2002) attributed a negative correlation of FSIQ with age to PIQ, with no such decline evident in healthy sibling controls. Green et al. (2009) found that FSIQ, VIQ and PIQ were all negatively correlated with age, including participants with and without a diagnosis of schizophrenia. The negative correlations between VIQ subtests and age were stronger than between PIQ subtests and age. Green et al. (2009) split their sample (n=172) into 4 age ranges. They yielded a mean VIQ>PIQ discrepancy of 4 points in the youngest age group (<12 years), which declined to 3 points in the next group (12-18 years), then 2 points in the next (18-24 years) and reached equivalence in the oldest age group (>24 years). This was due to a steeper decline in VIQ compared to PIQ. The authors do not report the statistical significance (if any) of the various discrepancies.
In their sample aged 6-15 years, Antshel et al. (2005b) yielded negative correlations of VIQ and PIQ with age in females (n=40) but not males (n=50). Niklasson and Gillberg (2010) yielded a VCI>PRI discrepancy in their entire sample ranging in age from 1 to 35. In both sexes they found a negative
23
In another sample with a wide age range, Green et al. (2009) used different versions of the Wechsler intelligence scales to ensure that tests and normative samples were age-appropriate. Some of the subtests comprising VIQ and PIQ differ slightly between versions. The same methodological issue applies to the longitudinal studies reviewed below. Different test stimuli used with participants in various age brackets purport to measure the same cognitive function, but between-subgroup and sample differences could be an artefact of different test stimuli. Therefore when examining correlations between age and test
performance, it is important to analyse the subtests that most similar among the different adult and child versions of the Wechsler tests. These subtests are: Vocabulary (VIQ/VCI subtest) and Block Design (PIQ/PRI subtest).
Green et al, 2009, yielded a negative correlation of Vocabulary with age but Block Design was considered stable. The decline of PIQ with age could have reflected other nonverbal functions. Block Design is arguably a purer measure of visuo-spatial reasoning than other WISC-III PIQ subtests, which require understanding of social rules and interactions or measure processing speed. Although some studies report declining PIQ with age, the lack of decline in Block Design performance is potentially more important than overall index scores when considering visuo-perceptual reasoning, particularly as the above finding for Block Design supports data from longitudinal studies that have not found deterioration in PRI with age (Antshel et al., 2010; Gothelf et al., 2007d).
24 Table 2: Cross-sectional studies with an age-cognition correlation
Author Year N Gender
Fe:male
Age range (years)
Finding Tests
Jacobson et al. (2010) 31 14:17 7-14 No correlation of VCI, PRI, FDI or PSI with age.
WISC-III
Niklasson & Gillberg
(2010) 100 58:42 1-35 PSI & FSIQ decline with age (not VCI or PRI).
WIPSI-R, WISC-III & WAIS-R Green et al. (2009) 172 82:90 5-54 Declining VIQ, PIQ with age. WISC-III,WAIS-III Antshel et al. (2005b) 90 40:50 6-15 Declining VCI & PRI in females not
males.
WISC-III,WIAT-II, Vineland Sobin et al. (2005) 40 23:17 5-12 Quantitative skills decline with age. Stanford-Binet, NEPSY Campbell et al. (2002) 26 - 6-16 PIQ and FSIQ decrease with age, but
VIQ stable.
25 1.5.3.8 Longitudinal studies
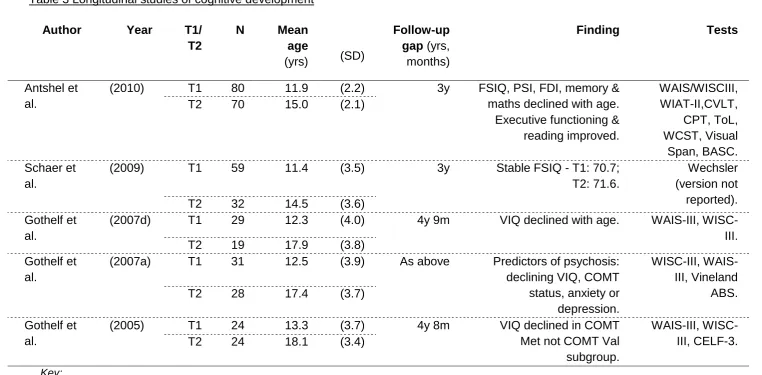
Two principal sets of investigators have published controlled follow-up studies (Table 3), with conflicting findings on whether or not verbal functions decline with age. The Gothelf et al. (2005; 2007d) studies report a fall in VIQ with age, which is affected by COMT genetic status and particularly evident in those diagnosed with psychosis. Decline in VIQ correlated (r= 0.59) with reduction of left cortical grey matter volume. Antshel et al. (2010) did not report the degree of VCI-PRI discrepancy. They yielded no reduction in VCI (z-score: .06) or PRI (z-score: .00) over time. The FSIQ in both samples declined with age,
attributable to declining PSI and FDI in the Antshel et al. (2010) study, and to VIQ in the Gothelf et al. (2005; 2007d) studies. Antshel et al. (2010) also found that cognitive function declined more in females than males.
Participants were selected based on parental report of developmental delay in the Gothelf studies or to study risk factors for psychosis (Antshel et al., 2010). High rates of psychiatric diagnosis, especially psychosis, and use of
psychotropic medication are likely to have lowered cognitive scores. Selection bias, psychiatric diagnosis and pharmacological intervention may contribute to inconsistencies in the results. Attrition, although modest, included those with lower FSIQ in the Gothelf et al. (2007d) study. Lack of an IQ-matched control group makes it difficult to determine the specificity of the cognitive
26 Table 3 Longitudinal studies of cognitive development
Author Year T1/
T2
N Mean
age
(yrs) (SD)
Follow-up gap (yrs, months)
Finding Tests
Antshel et al.
(2010) T1 80 11.9 (2.2) 3y FSIQ, PSI, FDI, memory & maths declined with age.
Executive functioning & reading improved. WAIS/WISCIII, WIAT-II,CVLT, CPT, ToL, WCST, Visual Span, BASC. T2 70 15.0 (2.1)
Schaer et al.
(2009) T1 59 11.4 (3.5) 3y Stable FSIQ - T1: 70.7;
T2: 71.6.
Wechsler (version not reported). T2 32 14.5 (3.6)
Gothelf et al.
(2007d) T1 29 12.3 (4.0) 4y 9m VIQ declined with age. WAIS-III, WISC-III. T2 19 17.9 (3.8)
Gothelf et al.
(2007a) T1 31 12.5 (3.9) As above Predictors of psychosis: declining VIQ, COMT status, anxiety or depression.
WISC-III, WAIS-III, Vineland
ABS.
T2 28 17.4 (3.7)
Gothelf et al.
(2005) T1 24 13.3 (3.7) 4y 8m VIQ declined in COMT Met not COMT Val subgroup.
WAIS-III, WISC-III, CELF-3. T2 24 18.1 (3.4)
Key:
27
1.5.3.9 The differential nature of the developmental decline in VCI/VIQ versus PRI/PIQ
The absence of a consistent VIQ>PIQ profile in the Henry et al. (2002) adult sample, if replicated in a large and longitudinal study, could suggest differential atypical development during adolescence.
Cambell and Swillen (2005) suggest visuo-perceptual functions and abstract reasoning may develop at a slower rate than verbal functions, resulting in lower normative scores for PIQ than VIQ during childhood. Findings from several cross-sectional studies (above) show declining PIQ with age, but not a decline in raw scores (Campbell et al., 2002; Golding-Kushner et al., 1985; Shprintzen, 2000; Sobin et al., 2005). This could indicate that visuo-perceptual functions do not deteriorate with age, but progress more slowly than in the general
population, and result in lower normative scores during early development. Visuo-spatial functions may take longer to develop but may catch up with verbal functions by adulthood, reducing the VIQ>PIQ discrepancy. Schaer et al. (2009) hypothesise that improvement visuo-perceptual functions with age may reflect progress in the delayed maturation of cortical thickness.
Longitudinal studies, with their stronger design, suggest competing hypotheses for a fall in FSIQ: Gothelf et al. (2005; 2007d) suggest declining VIQ, whereas Antshel et al. (2010) implicate declining PSI and FDI.
1.5.4 The importance of studying developmental trajectories
28
cognitive and cerebral maturation of individuals with 22qDS, including not only genotype and gender (Antshel et al., 2008; 2010; Gothelf et al., 2007d; Kates et al., 2011; Simon et al., 2008), but also education and social factors.
1.5.5 Memory in 22qDS
Lepach and Petermann (2011) note that the NVLD-like profile is
well-established in children/adolescents with 22qDS for intellectual functions and academic attainment and accepted as a cognitive phenotype of the condition, but that “memory and learning aspects have hardly been investigated.”
Research tends to focus on the fractionation of memory rather than suggestions that memory may be relatively preserved compared to IQ in 22qDS (Jacobson et al., 2010; Lajiness-O’Neill et al., 2006; Óskarsdóttir et al., 2005). The
superiority of memory scores over FSIQ is typical at lower IQ levels in the adult general population (Hawkins & Tulsky, 2001). The most frequently reported finding is that the child/adolescent NVLD-like intellectual profile is also reflected in memory with a significant verbal>visual episodic memory discrepancy. Published studies are limited by small sample size and sometimes by lack of age- and IQ-matched control groups.
1.5.5.1 Verbal and visual memory
29
Verbal memory is usually in the low-average to below-average range (Majerus et al., 2007), but average scores are also yielded (Lajiness-O’Neill et al., 2006; Óskarsdóttir et al., 2005), illustrating the heterogeneity of the profile.
Less is known about the developmental trajectory of memory compared to intellectual functions as there are even fewer longitudinal or cross-sectional adult studies. Although Debbane et al. (2008) researched memory in a wide age range (10-36 years), the effect of age was not explored.
1.5.5.2 Verbal Rote Learning and complex verbal memory
Several studies suggest that verbal rote learning is remarkably preserved in children with 22qDS, while other aspects of verbal memory are impaired. Swillen et al. (1999) reported normal group performance in memory for rote learned verbal information in nine children using the ‘15 words of Rey’ task (Lezak, 1995). Similar findings are reported by others (Bearden et al., 2001; Lajiness-O’Neill et al., 2005; Sobin et al., 2005; Wang et al., 2000; Woodin et al., 2001).
30 1.5.5.3 Memory for faces
Children with 22qDS are reported to have a deficit in the perception and memory of faces. Anderson, Anderson, Jacobs and Smith (2008) found impaired visual categorization for faces but not objects (houses), suggesting specific facial perceptual deficits. Lajiness-O’Neill et al. (2005) found inferior performance in a Facial Memory task in children with 22qDS compared to siblings and controls, but similar to that of children with autism. Campbell et al. (2011) found performance of children with 22qDS inferior to that of healthy controls and a developmentally matched group with Williams Syndrome (Campbell et al., 2009) for tasks of facial processing involving identity,
emotional expression and gaze direction. Retention for faces was also inferior to that for dots using the CMS (Campbell et al., 2010). McCabe, Rich,
Loughland, Schall and Campbell (2011) found atypical visual scan path patterns for both face and non-face images compared to controls. Those with 22qDS were less able to appropriately adapt their information processing strategy when the visual task changed from weather scenes to faces. The authors propose cognitive inflexibility rather than a face specific deficit, implicating an executive deficit.
In summary, the research consistently reports poor memory and processing of faces in child/adolescent 22qDS samples compared to controls, but the
evidence for a face specific deficit is mixed. McCabe et al. (2011) suggest that cognitive inflexibility may underlie facial perceptual deficits. No gender effects have been observed in memory.
1.5.5.4 Memory Development
31
reported, so speculation cannot be made about whether their relationship changes with age.
Antshel et al. (2010) are the only authors to have investigated memory in 22qDS longitudinally. They found no group change over time for visual
memory span, but performance in the final verbal learning trial (CVLT) declined with age. Declining verbal memory with age might be expected given the finding of declining VIQ with age by Gothelf et al. (2007d).
1.5.6 Executive function and Working Memory
Executive function has been reported as an area of relative weakness
(compared to IQ) in 22qDS (Woodin et al., 2001). The four executive functions most frequently studied in 22qDS are initiation, cognitive flexibility, response inhibition and WM (verbal and nonverbal).
1.5.6.1 Initiation
Niklasson and Gilberg (2010) suggest that weak initiation affects performance on some nonverbal intellectual subtests, such as Block Design, because of time features (bonus points for faster solutions). The authors report that it is less of an issue when individuals are shown what to do and helped to “get started”, e.g. with processing speed subtests in the WISC-IV/WAIS-IV. The issue is not speed per se, but ‘initiating’ activities. Parental reports of children with 22qDS suggest lower initiation (Kiley-Brabeck & Sobin, 2006).
1.5.6.2 Cognitive Flexibility and response inhibition
32
2007; Rockers et al., 2009). By contrast, van Amelsvoort et al. (2004) found no evidence of lower cognitive flexibility on the Weigl task (Goldstein & Scheerer, 1941) in adults with 22qDS, consistent with possible developmental change.
One measure of inhibition is pre-potent inhibition, a phenomenon in which a weaker initial stimulus inhibits a second, stronger stimulus. Common tests include the Delis-Kaplan Colour-Word Interference Task (Delis, Kaplan & Kramer, 2001) and the Stroop (Stroop, 1935). Deficits have been found on the Stroop in child/adolescent 22qDS samples by Sobin et al. (2005) and in adults without diagnosis of schizophrenia (Chow et al., 2006). But using different tests, Lajiness-O’Neill et al. (2006) found no difference between children with 22qDS and unaffected siblings on impulsive errors. A similar negative result was reported by Gothelf, Hoeft and Hinard (2007e).
1.5.6.3 Working Memory
WM refers to a hypothesized memory structure and process used for
temporarily storing and manipulating information (Baddeley & Hitch, 1974). WM deficits, especially nonverbal, that are disproportionate to general intellectual functioning in 22qDS have been reported (Bearden, 2001; Lajiness-O’Neill et al., 2005; Lewandowski et al., 2007; Majerus et al., 2006; Moss et al., 1999; Sobin et al., 2005; Wang et al., 2000; Woodin et al.2001).
Different assessment methods are used to measure WM in the 22qDS
33
found evidence for reduced WM in 19/26 children using the Arithmetic subtest, but only 12/26 when using the Digit Span subtest. WM scores derived from the WISC-III FDI should be treated cautiously.
1.5.6.4 Developmental considerations
Green et al. (2009) found a negative correlation between age and the Digit Span subtest. Antshel et al. (2010) found that FDI performance significantly declined from original assessment (T1) to follow-up (T2). Gothelf et al. (2007d) do not report the FDI changes.
1.5.6.5 Summary
A range of different tests has been used in the literature to measure executive function. Different results could reflect different assessment methods as well as heterogeneity within 22qDS and between-sample differences. The most
common findings appear to be weaknesses, independent of IQ, in cognitive flexibility, inhibition, initiation and WM. These may contribute to wider cognitive deficits (McCabe et al., 2011).
1.5.7 Methodological challenges in previous research
There is considerable heterogeneity in the cognitive phenotype of 22qDS. This probably partly reflects methodological problems and confounders, which may interact with genetic and developmental factors.
1.5.7.1 Diagnostic Method
34
Although not all studies reviewed above used FISH to accurately diagnose 22qDS, Shprintzen (2008) found no evidence of statistically significant differences in neuropsychological findings between those studies with and without FISH confirmation of 22qDS. The FISH test has a false negative rate of 5-7%. The recently developed multiplex ligation dependent probe amplification test (MLPA) is more sensitive (Stachon et al., 2007).
1.5.7.2 Sample size
The sample size across studies has ranged from under ten (Lajiness-O’Neill et al., 2005) to 172 (Green et al., 2009). The larger sample sizes have all been from cross-sectional studies. Sampling methods are not always described. Small sample size limits statistical power (increasing the risk of type II errors).
1.5.7.3 Ascertainment and selection bias
Shprintzen (2008) estimates that at least one third of 22qDS cases remain undetected, unless brought to medical attention, primarily by severe congenital heart disease. Cardiac lesions may be silent, and are absent in 30%. The absence of characteristic facial features in individuals from some ethnic groups could result in lower detection rates in those populations (McDonald-McGinn et al., 2005). Children with 22qDS may not attract educational attention if
cognitively typical. Parents of children with familial 22qDS are often undiagnosed until their child presents medically (McDonald-McGinn et al., 2008). Most studies therefore demonstrate ascertainment bias and may not represent the full range of 22qDS. Hospital samples usually include more severe cases. There is strong selection bias in published studies, limiting the generalisability of the findings.
1.5.7.4 Control groups
The performance of children with 22qDS is often compared to typically
35
controls for the effects of low intelligence on specific tests of cognitive functioning. This allows assessment of specific deficits directly related to 22qDS but may complicate interpretation (Karmiloff-Smith, 2009). To examine the specificity of a cognitive phenotype, a control group should have the same range of cognitive ability. Finding suitable control groups in 22qDS research is difficult. Controls with idiopathic LD have aetiological heterogeneity, which could confound interpretation. The cognitive phenotypes of Turner Syndrome and Williams Syndrome are comparable to that of 22qDS and enable
investigation of gene-specific as well as more general influences on 22qDS phenotype (Campbell et al., 2009; Murphy et al., 2006).
1.5.7.5 Tests used across studies
Although most studies use the Wechsler intelligence scales, a wide range of assessment tools, including experimental tasks, is reported. Test variation between studies could obscure the 22qDS cognitive phenotype. However, the validity of a result is increased if it is consistent across different tests.
Reasonable consistency has, in fact, been found across most studies.
1.6 SUMMARY
Recent research on the cognitive profile of children and adolescents with 22qDS has yielded several consistent findings. Verbal is frequently superior to
nonverbal intellectual and memory function.
Henry et al. (2002) report absence of an expected group verbal>nonverbal discrepancy in their small sample of non-psychotic and psychotic adults with 22qDS, with a clinically significant reverse discrepancy found in one third, indicating that cognitive strengths and weaknesses may change with
36 discrepancies, they are negligible.
Cross-sectional studies report declining FSIQ with age. Longitudinal studies report conflicting findings. Gothelf et al. (2005; 2007d)found a reduction in mean FSIQ and of the degree of verbal>nonverbal discrepancy with age, secondary to declining VIQ, whereas Antshel et al. (2010) found no increase or decline in verbal or nonverbal intellectual functions with age. A substantial proportion of participants in both samples was receiving psychotropic medication.
1.7 HYPOTHESES 1.7.1 Intelligence
37 Figure 1: Hypotheses one and two
1.7.3 Memory
The evidence base for memory development with age is even smaller and suggests superior verbal compared to visual memory functioning in
childhood/adolescence. In the only longitudinal study investigating memory, Antshel et al. (2010) found no discrepancy between verbal and visual memory but that verbal memory declined with age.
The third hypothesis for the present study would have been that memory would follow the same pattern as intelligence in that the discrepancy between
38
hypotheses for memory were tentative and analysis was fundamentally exploratory.
1.7.4 Executive Function
The literature reports deficits in WM and executive function in 22qDS. It was expected that performance on tasks of inhibition, set shifting and initiation would be lower than average compared to the general population. No hypothesis was made about executive function. Instead, data were collected to help
contextualise the findings in the memory and intellectual domains of cognition.
1.7.5 Why is this important?
Establishment of the cognitive pattern underlying the hypothesised change in verbal>nonverbal discrepancy could inform the clinical and educational
interventions that are offered at particular ages to those with 22qDS to optimise their cognitive development.
Gothelf et al. (2007d) propose that declining VIQ, amongst other factors, is a potential risk factor for later psychosis. The implications are that routine screening for “high risk predictive symptoms”, e.g. declining VIQ, should be carried out and “subthreshold psychotic symptoms” should be treated with ‘anti-psychotic’ medication to improve the prognosis of the (predicted) later emerging psychotic disorder. This has also influenced the focus of other research groups, for example, the Antshel et al. (2010) study published three years later focuses on cognitive factors to identify ‘prodromal psychotic symptoms’ in a sample free from a psychotic diagnosis.
39
explored further and understood within different frameworks. It is also important that research findings are presented in the context of social understandings of LD as well as within genetic frameworks. This will increase the availability of alternative perspectives on 22qDS for researchers and clinical professionals.
1.7.6 Present Study aims
40 2.0 METHODOLOGY
This section explains the rationale for particular methodological decisions and outlines some of the methodological challenges.
2.1.1 Different tests between T1 and T2
Use of the same test at two time points helps ensure the same cognitive functions are assessed and the same normative reference group is used to interpret scores. However, to monitor change in a clinically meaningful way that enables comparison across studies, standard not raw scores are typically used. Raw scores place individuals at particular points in the normal distribution of scores to relate their functioning to that of peers. To obtain standard scores, age stratified normative samples must be used to interpret the scores, and therefore age-appropriate tests must be administered. The child version of the Wechsler intelligence scales used at T1 w