IJPSR (2014), Volume 5, Issue 11 (Research Article)
Received on 16 April 2014; received in revised form, 02 July 2014; accepted, 31 July 2014; published 01 November 2014
VOLTAMMETRIC DETERMINATION OF RUPATADINE AT GRAPHENE MODIFIED GLASSY CARBON ELECTRODE
H. Devnani *, P. Singh, S. Saxena and S. P. Satsangee
University Science Instrumentation Centre, Dayalbagh Educational Institute, Dayalbagh, Agra - 282005, Uttar Pradesh, India.
ABSTRACT: Electrochemical behavior of rupatadine, an anti-allergic drug was studied at graphene modified glassy carbon electrode in Britton-Robinson buffer (pH 6.5) by square wave voltammetry (frequency, 50 Hz; amplitude, 0.02 V; step potential, 0.005 V) and cyclic voltammetry (scan rates, 20-100 mV/s) techniques. Cyclic voltammetry revealed the oxidation of rupatadine corresponding to N-dealkylation which is the major metabolic pathway of rupatadine in the human body. Atomic force microscopy, scanning electron microscopy and electrochemical impedance spectroscopy was used to study the surface characteristics of the fabricated sensor. The electrode dynamic parameters were investigated and the oxidation mechanism was proposed. The lower limit of detection and quantification were achieved with the modified sensor as compared to the bare sensor due to enhancement in electron transfer process at the surface of modified sensor owing to greater electroactive surface area. The limit of detection was found to be 56.78 ng/ml and limit of quantification, 172.06 ng/ml at graphene modified glassy carbon electrode.
INTRODUCTION: The need for clinical and pharmacokinetic studies of pharmaceutical compounds drives the development of the simple, fast, accurate and sensitive analytical method. Drug monitoring plays an important role in drug quality control so it is important to determine their active ingredient 1-4.Rupatadine (RTD) is 8 chloro 6, 11 dihydro 11-[1-(5-methyl-3-pyridinyl) methyl -4-piperidinyllidene] -5 H- benzo [5, 6] cyclohepta [1, 2-b] pyridine Scheme 1.
QUICK RESPONSE CODE
DOI:
10.13040/IJPSR.0975-8232.5(11).4792-99
This article can be accessed online on
www.ijpsr.com
DOI link: http://dx.doi.org/10.13040/IJPSR.0975-8232.5(11).4792-99
SCHEME 1: STRUCTURE OF RTD
It acts as a long-acting, non sedative antagonist at histaminergic H1-receptors and also antagonizes the platelet-activating factor (PAF) 5. RTD is a novel compound that shows both antihistamine and anti-PAF effects through its interaction with specific receptors and not due to physiological antagonism 6. RTD also has potentially beneficial effects such as inhibition of mast cell degranulation, neutrophil and eosinophil migration, and cytokine release 7.
Keywords:
Rupatadine, Graphene, Voltammetry, Electrochemical
impedance Correspondence to Author: H. Devnani
University Science Instrumentation Centre, Dayalbagh Educational Institute, Dayalbagh, Agra - 282005, Uttar Pradesh, India.
In a literature survey HPLC methods, 8-12 HPTLC method, 13 spectrophotometric methods 14 and titrimetric method 15 were reported.
The electrochemical techniques have been used for investigation of the redox mechanism of drugs as their active ingredient is most of the times active in contrast to the excipients. The analyte can be identified by the voltammetric peak potential and thus the technique is selective. The analysis is completed in relatively short time as compared to other techniques 16, 17. In the field of clinical and pharmaceutical analysis, use of various electrodes
viz. mercury, solid and modified electrodes for electroanalytical measurements has increased in recent years because of their applicability to the determination of active compounds that undergo redox reactions 18.
The electrochemical behavior of the analytes can be greatly enhanced by modifying the working electrode surface. Thus different kinds of modified electrodes have been fabricated to enhance the electrode reaction rate and thereby analytical performance 19-21.
Graphene (GRP), a 2D, honeycomb sp2 bonded carbon atom has proved to be very promising and potential nanomaterial. It has an excellent electrical conductivity (200,000 cm2/Vs) 22, large surface area (theoretical value is 2630m2/g) 23, high thermal
conductivity (5000W/mK) 24 and strong
mechanical strength 25 which makes it an outstanding material to exhibit plethora of applications such as electronics 26, supercapacitors
27
, Lithium-ion batteries 23, 28, fuel cells 29, solar cells 30, 31, electrochemical sensors 32, 33 and biosciences/biotechnologies 34etc.
The present work reports an electrochemical method for the study of RTD by square wave voltammetry (SWV) and cyclic voltammetry (CV) at graphene modified glassy carbon electrode (GRP/GCE), using Britton-Robinson (B-R) buffer (pH 6.5) as a supporting electrolyte. Atomic force
microscopy (AFM) and scanning electron
microscopy (SEM) helped in exploring the surface topology and morphology of the modified sensor. Electrochemical impedance spectroscopy (EIS) detailed lowering in charge transfer resistance and catalytic activity of the fabricated sensor
(GRP/GCE) as compared to the bare electrode (GCE).
EXPERIMENTAL:
Instrumentation: All electrochemical studies were carried out using AUTO LAB PGSTAT 302N (Eco-Chemie B.V., Utrecht, The Netherlands) potentiostat-galvanostat with IME663 and software NOVA 1.8. EIS was carried out using FRA 2 module. A standard three-electrode electrochemical assembly was used which consisted of GCE and GRP/GCE as working electrode, platinum wire as counter and Ag│AgCl (3M KCl) as reference electrode. These were fitted in one compartment cell connected with electrochemical workstation
through Metrohm 663VA stand. All pH
measurements were made on a Mettler Toledo pH meter fitted with a gel electrode and Ag│AgCl electrode as reference. All measurements were carried out at room temperature. AFM study was carried out at Nanosurf Easyscan (Switzerland) with software Nanosurf 1.8. SEM was performed at Japanese Electro-optics Ltd. (JSM-5800LV) involving the INCA software from Oxford (U.K.).
Materials and Reagents: Graphene (12 nm) was procured from Graphene Laboratories, USA. RTD standard (≥99%) was obtained from the Sigma Aldrich. Ultrapure water (Milli-Q water with resistivity 18 MΩ.cm) was obtained from ELGA purification system (U.K). Standard solution of RTD (2mg/mL) was prepared by dissolving pure compound in methanol and was further diluted with B-R buffer to get the concentration in the working range. For real sample analysis, RTD was determined in Rupanex tablet. Solutions at all the stages of the study were prepared by using analytical grade reagents and were used without further purification.
This work was carried out at University Science Instrumentation Centre, Dayalbagh Educational Institute, Dayalbagh, Agra in the year 2013.
For modification, a suspension of grapheme (GRP) was prepared by dispersing 1 mg of GRP in 1 mL of dimethylformamide (DMF). The obtained suspension was vortexed for 15 min followed by ultrasonication for 2 h. 1 µL of the modifier was withdrawn and drop casted onto the working surface of GCE. The modified electrode surface was dried at room temperature. An increase in the baseline current was observed at higher concentration of GRP, so 1 µL of GRP suspension in DMF (1 mg/mL) was optimized for the modification of GCE.
Analytical Procedure: The stock solution of RTD (2mg/mL) was prepared in methanol. Working solutions were prepared by further dilution with the supporting electrolyte to get the desired concentration. A range of B-R buffer (2-12 pH) was prepared in ultrapure water and used as supporting electrolyte. About 10 mL of electrolyte solution containing an appropriate amount of standard RTD or sample was added to the electrolytic cell. Prior to all the electrochemical measurements, all the solutions were purged with nitrogen gas to remove interference due to oxygen. SWV and CV were recorded in potential range 0 to 1.4 V. The surface of GCE was renewed prior to the modification by abrading it smoothly against the alumina slurry spread over the Buehler cloth. Electrochemical impedance measurements were performed in 5 mM K3Fe (CN) 6 prepared with 0.1
M KCl by applying the AC voltage with 5 mV amplitude in a frequency range from 1 Hz to 100 kHz. Nyquist plots were studied for the analysis.
RESULTS AND DISCUSSIONS:
Characterization of the GRP/GCE and bare GCE: Surface characterization of the GRP/GCE
was carried out by SEM and AFM. For this, the suspension of modifier was drop casted over the surface of ITO. SEM image Fig. 1A explains the formation and morphology of the GRP film. It illustrates the flake-like shape of GRP, which is intended to improve the properties of the sensor leading to increase in the interaction of the analyte with the modified surface. AFM helped to interpret the surface profile (topology) of the electrode surface. The roughness parameters are tabulated in Table 1, which imply that the GRP layer is well-coated onto the surface of GCE. Further, it indicates that the graphene nanoparticles were not removed from the surface of GCE by several flushings with deionized water Fig. 1B.
The electroactive surface area of the GRP/GCE and the GCE were obtained by the CV using 1 mM K3
Fe(CN)6 as a redox indicator at different scan rate.
The peak current Ip can be calculated by the Randles-Sevcik equation at 25 ºC as follows: 35
Ip = (2.69 × 10⁵) n3/2 A C0 D1/2 Ʋ ½ ...1
For K3Fe (CN) 6, n=1 and D= 7.6 × 10⁻⁶ cm2/s.
From the slope of Ip (µA) vs. Ʋ 1/2, the electroactive surface area was determined to be 0.028 cm2 for GCE and 0.043 cm2 for GRP/GCE. Thus there is enhancement in surface area on modification of the electrode.
TABLE 1: AFM PARAMETERS FOR GRP/ITO
Roughness parameter GRP/ITO
Area (nm) 2.496
Roughness average (nm) 50.647
Route mean square (nm) 106.67
Peak-valley height (nm) 1995.6
Peak height (nm) 1607.2
Valley depth (nm) -388.39
Mean value (pm) 229.74
FIG. 1: SCANNING ELECTRON MICROSCOPIC IMAGE OF GRP/ITO (A) AND 3D ATOMIC FORCE MICROSCOPIC IMAGE OF GRP/ITO (B)
[image:3.612.54.565.466.733.2]Electrochemical Behavior of RTD at GRP/GCE and GCE: Electrochemical behavior of RTD at GCE and GRP/GCE was investigated by CV and SWV techniques. Fig. 2 represents the SWV of RTD (4000 ng/mL) at the bare GCE (b) and GRP/GCE (c) whereas the Fig. 3 represents the CV of RTD (4000 ng/mL) at bare GCE (b) and GRP/GCE (c). At each of the electrodes, a well-defined oxidation peak for RTD was obtained.
FIG. 2: SQUARE WAVE VOLTAMMOGRAMS OF RTD (4000 ng/mL, AMPLITUDE: 20 mV, FREQUENCY: 25 Hz, STEP POTENTIAL: 5 mV, SCAN RATE: 125 mV/s)) AT GCE (curve b), at GRP/GCE (curve c), AND BLANK (curve a)
FIG. 3: CYCLIC VOLTAMMOGRAMS OF RTD (4000ng/mL at 50mV/s) AT GCE (curve b), AT GRP/GCE (curve c), AND BLANK (curve a)
The response characteristics of SWV exhibits that the anodic peak current intensity was enhanced by 64.6% at GRP/GCE compared to the bare GCE whereas the response characteristics of CV represented an enhancement in the peak current intensity by 52.4% at GRP/GCE as compared to GCE. Therefore the electroanalytical performance of GRP/GCE was advantageous over that observed at GCE. No peaks were observed in the reverse scan of CV corresponding to the anodic voltammetric peaks. This indicates that the oxidation reaction is irreversible.
[image:4.612.313.565.176.393.2]Electrochemical Impedance Spectroscopy: The increase in the electron transfer at the modified electrode was investigated using the EIS technique. For this AC amplitude of 5 mV at a frequency of 1 Hz-100 kHz was applied. The higher electro-catalytic behavior of GRP/GCE was confirmed by the reduction in the charge transfer resistance Fig. 4A.
FIG. 4: NYQUIST PLOTS OF 5 mM K3Fe(CN)6 AT GCE (A, a), GRP/GCE (A, b), AND CORRESPONDING EQUIVALENT CIRCUIT (B)
The values observed for the charge transfer resistance, RCT, fitting an appropriate equivalent
circuit, were determined and found to be 17.7 kΩ at GCE and 9.2 kΩ at GRP/GCE Fig. 4B. The decrease in charge transfer resistance can be related to the electrode coverage and are given by the following equation:
(1- Ø)=R°CT/RCT ...2
Where Ø is the apparent electrode coverage and R°CT and RCT is the charge transfer resistance
measured at bare and modified carbon electrode.36 The electrical equivalent circuit compatible with the Nyquist plots comprises of RS the solution
resistance, Qdl the double layer capacitance, RCT the
charge transfer resistance and W the Warburg
impedance. The Warburg type impedance
[image:4.612.48.302.190.338.2] [image:4.612.48.300.397.546.2]Effect of Scan Rates: To study the effect of scan rate on the oxidation peak of RTD, voltammograms were recorded for different scan rates ranging from 20-100 mV/s at a fix concentration (4000 ng/mL) of RTD. The information involving electrochemical mechanism can be obtained from the investigation of the response characteristics of CV on the electro-oxidation process of RTD Fig. 5.
A linear relationship was obtained between the peak current intensity (Ip) and the square root of scan rate (Ʋ)1/2
, suggesting the diffusion-controlled process at the electrode surface. The linear relationship between Ip and (Ʋ)1/2
follows Ip(µA)=0.314(Ʋ)1/2
-0.013, R2=0.999. Since the oxidation peak was not accompanied by the reduction peak, therefore, the electro-oxidation process of RTD was proved to be an irreversible diffusion-controlled process.
FIG. 5: CYCLIC VOLTAMMOGRAMS OF RTD (4000 ng/mL IN B-R BUFFER 6.5 pH) AT SCAN RATES 20-100 mV/s (20, 40, 60, 80 AND 20-100 mV/s, CURVES a – e RESPECTIVELY) AND INSET FIGURE REPRESENTS PLOT OF (Ʋ) 1/2 vs Ip
Determination of Electrode Dynamics Parameters (α and n) and Proposed Mechanism of RTD: For an irreversible anodic reaction, the relationship between Ep and Ʋ can be described as
38
Ep = E’ + RT/αnα F [0.780 + ln (D1/2/ks) + ln (αnαF Ʋ/RT) 1/2
] ... 3
Eº is the formal redox potential, R and F values are 8.314 J/K.mol and 96480 C/mol respectively, ks is
the standard heterogeneous rate constant, and D is the diffusion coefficient.
According to the slope of the straight line of Ep against ln Ʋ, α n = 0.89. The electron participating in the electrode reaction process can be calculated to be 2e-, assuming α is 0.5. Assuming nα = n, the
value of α is 0.44.
Thus the voltammetric technique can be utilized to elucidate the electroactivity and possible surface activity of various compounds, as seen in the case of RTD. CV and SWV of RTD exhibited well defined anodic voltammetric peak which is attributed to the N dealkylation of the piperidine nitrogen Scheme 2.
SCHEME 2: PROPOSED MECHANISM FOR RTD
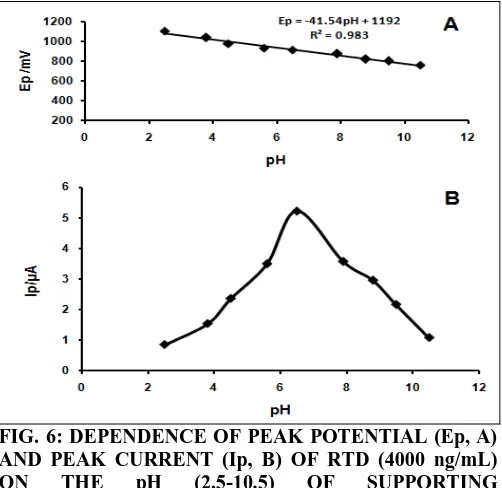
Effect of Supporting Electrolyte and its pH: The influence of various supporting electrolytes such as KCl, phosphate buffer, acetate buffer and B-R buffer on the electrooxidation of RTD (4000 ng/mL) was investigated. B-R buffer was found to be the best supporting electrolyte with well defined current responses, the stability of the solution system and prominent peak shape. The anodic peak current of RTD was found to be sensitive towards the pH of the solution and was analyzed in the range 2.5 to 12. A sequential shift of the anodic peak potential with the change in solution pH was observed implying that the protons had participated in the electrode reaction process of RTD 39, 40. The best result with respect to sensitivity was obtained at 6.5 pH Fig. 6B. Therefore, pH 6.5 was selected and used throughout the analysis. Fig. 6A explains the shifting of peak potential with increase in pH values following the linear equation Ep (mV) =1192-41.54 pH, R2=0.983. According to Nernst equation: 41
Ep = E’- 2.303RTmpH/ (1-α) nF ...4
[image:5.612.315.565.241.365.2]FIG. 6: DEPENDENCE OF PEAK POTENTIAL (Ep, A) AND PEAK CURRENT (Ip, B) OF RTD (4000 ng/mL)
ON THE pH (2.5-10.5) OF SUPPORTING
ELECTROLYTE (B-R BUFFER)
Calibration Curve and Detection Limit: SWV recorded with the increasing amounts of RTD under the optimized conditions exhibited that the peak currents increased linearly with the increasing concentration Fig. 7. A linear relationship between the peak current and the RTD concentration was observed in the range of 400 ng/mL to 1400 ng/mL The calibration plot of Ip (µA) vs. concentration (ng/mL) followed the linear equation, Ip(µA) = 0.018 (ng/mL) + 0.920, R2 = 0.998 for GRP/GCE.
Limit of detection (LOD) and limit of quantification (LOQ) (estimated as 3 S/m and 10 S/m, respectively, ‘S’ being the standard deviation and ‘m’ being the slope of the calibration curve) were obtained as 56.78ng/mL and 172.06ng/mL for GRP/GCE. Various statistical parameters for the linear regression equation have been evaluated and reported in Table 2.
TABLE 2: SQUARE-WAVE VOLTAMMETRIC
METHOD VALIDATION PARAMETERS FOR
STANDARD LINEARITY
Linearity parameters Results
Slope 0.0043
Standard deviation 0.0001
Intercept 0.7812
Standard deviation 0.0742
Correlation coefficient 0.9991 Standard error of estimation 0.560 Sum of squares of regression 11.0035
Sum of squares of residuals 0.0094 Limit of detection (ng mL-1) 56.78 Limit of quantification (ng mL-1) 172.06
FIG. 7: SQUARE WAVE VOLTAMMOGRAMS OF RTD AT DIFFERENT CONCENTRATION LEVELS, (400ng/mL-1400ng/mL, a- e), BLANK (curve a) AND
INSET FIGURE REPRESENTS PLOT OF
CONCENTRATION vs. CURRENT Ip (400, 600, 800, 1000, 1200 AND 1400 ng/mL)
Determination of RTD in Pharmaceutical Formulation (Rupanex): The modified sensor, GRP/GCE was successfully applied for the determination of RTD in Rupanex (Mfd. by Dr. Reddy’s). No sample pre-treatment and time-consuming extraction process were required prior to analysis. Tablets were crushed and powdered using a mortar and pestle. A weighed amount was then added to a specific volume of the suitable solvent. In this case, 20 mg of drug was added to 10 ml methanol. To achieve maximum solubility of drug, sonication was carried out for 5 min and then centrifuged at 3200 rpm for about 5-10 min. The clear supernatant was used for the analysis. It was diluted with pH 6.5 BR buffer to get final concentration in working range. SWV was run under optimized conditions as described in the text. The concentration of RTD was then determined using the standard addition method by the following equation: 42
Cu =Ip1 CsVs / [Ip2 (Vu+Vs)] - Ip1Vu ...5
After getting the voltammogram of the supporting electrolyte, known volume (Vu) of unknown
concentration (Cu) of the investigated drug was
added and the resulting voltammogram was recorded and its peak current (Ip1) measured. The
known volume (Vs) of known concentration (Cs) of
current (Ip2) measured. The concentration
calculated by the proposed method is compared with that claimed in tablet (Rupanex) in Table 3. TABLE 3: ANALYTICAL RESULTS FOR RTD IN
RUPANEX TABLET Standard added (ng/mL) Standard found* (ng/mL)
Accuracy a (%) RSD (%) 500 700 900 1100 493.9 695.2 906.7 1089.5 98.78 99.3 100.7 99.05 0.23 0.17 0.21 0.19 a
[standard found/standard added] × 100
*Amount found represents the average of six observations (n = 6)
CONCLUSION: GRP/GCE proved to be effective for the selective and sensitive determination of RTD in B-R buffer at pH 6.5 without any major interference. The modified electrode offered higher electrocatalytic activity towards RTD which can be attributed to the increase in the surface area and interaction of the graphene with the solution system thereby enhancing the analyte response. The oxidation mechanism and the electron transfer process was analyzed and discussed in the present communication. The electrode reaction process dynamics parameters were also investigated and CV with the variation of scan rate study showed that the sensor follows the irreversible diffusion-controlled process. Calibration plot revealed linearity within the range of 400-1400ng/mL with correlation coefficient of 0.998. LOD and LOQ were found to be 56.78ng/mL and 172.06ng/mL respectively.
ACKNOWLEDGEMENT: Financial support from the Ministry of Human Resource and Development, India under NMEICT project is gratefully acknowledged. The authors are also thankful to Prof. M. Shyama Prasad and Mr. Areef A. Sardar for providing SEM lab facility at National Institute of Oceanography, Goa, India.
CONFLICT OF INTEREST: Nil REFERENCES:
1. Kang X, Wang J, Wu H, Liu J, Aksay IA and Lin Y: A graphene-based electrochemical sensor for sensitive detection of paracetamol. Talanta 2010; 81: 754-59.
2. Jain R, Gupta VK, Jadon N and Radhapyari K:
Voltammetric determination of cefixime in
pharmaceuticals and biological fluids. Analytical Biochemistry 2010; 407: 79-88.
3. Jain R, Gupta VK, Jadon N and Radhapyari K: Adsorptive stripping voltammetric determination of pyridostigmine bromide in bulk, pharmaceutical formulations and biological fluid. Journal of Electroanalytical Chemistry 2010; 648: 20-27.
4. Gupta VK, Jain R, Jadon N and Radhapyari K: Adsorption of pyrantel pamoate on mercury from aqueous solution: studies by stripping voltammetry. Journal of Colloid and Interface Science 2010; 350: 330-35.
5. Rele RV and Patil SS: Simple spectrophotometric determination of rupatadine as rupatadine fumarate from the pharmaceutical formulation. Der Pharma Chemica 2012; 4: 2278-82.
6. Katiyar S and Prakash S: Pharmacological profile, efficacy and safety of rupatadine in allergic rhinitis. Primary Care Respiratory Journal 2008; 17: XXX-XXX.
7. Curto-Barredo L, Silvestre JF and Gimenez-Arnau AM: Update on the treatment of chronic urticaria. Actas Dermosifiliogr 2014; 105: 469-82.
8. Nogueria DR, Felipe D’A, Clarice R and Sergo LD: Development and validation of a stability-indicating LC method for the determination of rupatadine in pharmaceutical formulations. Chromatographia 2007; 66: 915-19.
9. Tain Y, Zhang J, Lin H, Lang J, Zhang Z and Chen Y: High performance liquid chromatography – tadem mass spectrometric determination of rupatadine in human
plasma and its pharmacokinetics. Journal of
Pharmaceutical and Biomedical Analysis 2008; 47: 899-06.
10. Noqueria DR, Da Silva LM, Todeschini V and Dalmora SL: Determination of rupatadine in pharmaceutical formulations by a validated stability-indicating MEKC method. Journal of Separation Science 2008; 31: 3098-05. 11. Kumar N, Malaviya J, Jat RK, Singh R and Patel KG: RP-HPLC method development and its validation for assay of rupatadine fumarate in tablet dosage form. Inventi Journal 2012; 3.
12. Choudekar RL, Mahajan MP and Sawant SD: Validated RP-HPLC Method for the Estimation of Rupatadine fumarate in Bulk and Tablet Dosage Form. Der Pharma Chemica 2012; 4: 1047-53.
13. Shirkhendar AA, Thorve RR, Fursule RA and Surana SJ: Development and validation of stability-indicating HPTLC method for analysis of rupatadine fumarate in bulk and tablets form. Acta Chromatographica 2008; 20: 423-37. 14. Goyal A, Sharma CS and Singh G: Development of UV
and visible spectrophotometric methods for estimation of rupatadine fumarate from tablet formulation. International 15. Journal of Pharmaceutical Research and Development
2010; 2(4): 14.
16. Rele RV, Mahimkar SA and Sawant SA: A validated simple titrimetric method for the quantitative determination of rupatadine as rupatadine fumarate from pharmaceutical dosages. Analytical Chemistry 2009; 8: 561-64.
17. Atta NF, Galal A and Ahmed RA: Direct and Simple Electrochemical Determination of Morphine at PEDOT Modified Pt Electrode. Electroanalysis 2011; 23: 737-46.
18. Atta NF, Galal A and Ahmed RA: Simultaneous
Determination of Catecholamines and Serotonin on Poly(3,4-ethylene dioxythiophene) Modified Pt Electrode in Presence of Sodium Dodecyl Sulfate. Journal of Electrochemical Society 2011; 158: F52-60.
presence of surface active agents. International Journal of Electrochemical Science 2012; 7: 10365-379.
20. Zhao RJ, Jiang Q, Sun W and Jiao KJ:
Electropolymerization of methylene blue on carbon ionic liquid electrode and its electrocatalysis to 3,4-dihydroxybenzoic acid. Chinese Chemical Society 2009; 56: 158-63.
21. Ding KQ: Cyclic Voltammetrically Prepared
MnO2-Polyaniline Composite and Its Electrocatalysis for Oxygen Reduction Reaction (ORR). Journal of the Chinese Chemical Society 2009; 56: 891-97.
22. Majidi MR, Asadpour-Zeynali K, Shahmoradi K and Shivaeefar Y: Electrochemical characteristics of a copper hexacyanoferrate (CuHCNF) modified composite carbon electrode and its application toward sulfite oxidation. Journal of the Chinese Chemical Society 2010; 57: 391-98. 23. Nolotin KI, Sikes KJ, Jiang Z, Klima M, Fudenberg G and Hone J, Kim P, Stormer HL: Ultrahigh electron mobility in suspended grapheme. Solid State Communication 2008; 146: 351-55.
24. Stoller MD, Park S, Zhu Y, An J and Ruoff RS: Graphene-Based Ultracapacitors. Nano Letters 2008; 8: 3498-02. 25. Balandin AA, Ghosh S, Bao W, Calizo I, Teweldebrhan D
and Miao F: Superior thermal conductivity of single-layer graphene. Nano Letters 2008; 8: 902-07.
26. Lee C, Wei X, Kysar JW and Hone J: Measurement of the elastic properties and intrinsic strength of monolayer graphene. Science 2008; 321: 385-88.
27. Hass J, Heer WA and Conrad EH: The growth and morphology of epitaxial multilayer graphene. Journal of Physics: Condensed Matter 2008; 20: 323202-229.
28. Yoo E, Kim J, Hosono E, Zhou H, Kudo T and Honma I:
Large reversible Li storage of graphene nanosheet families for use in rechargeable lithium ion batteries. Nano Letters 2008; 8: 2277-82.
29. Li X, Geng D, Zhang Y, Meng X, Li R and Sun X: Superior cycle stability of nitrogen-doped graphene nanosheets as anode for lithium ion batteries. Electrochemical Communication 2011; 13: 822-25. 30. Geng D, Chen Y, Chen Y, Li Y, Li R, Sun X, Ye S and
Knights S: High oxygen-reduction activity and durability of nitrogen-doped graphene. Energy and Environment Science 2011; 4: 760-64.
31. Wang X, Zhi LJ, Tsao N, Tomovic Z, Li JL and Mullen K: Transparent carbon films as electrodes in organic solar cells. Angewandte Chemie International Edition 2008; 47: 2990-92.
32. Wu J, Becerril HA, Bao Z, Liu Z, Chen Y and Peumans P: Organic solar cells with solution-processed graphene
transparent electrodes. Applied Physics Letters 2008; 92: 263302-303.
33. Srivastava R, Sharma R, Satsangee SP and Jain R: Graphene based electrochemical sensor and its application for detection and quantification of antifibrinolytic drug tranexamic acid. Journal of Electrochemical Society 2012; 159: B795-B800.
34. Jain R, Sharma R, Yadav RK and Srivastava R: Graphene based electrochemical sensor for detection and quantification of dopaminergic agonist drug pramipexole: an electrochemical impedance spectroscopy and atomic force microscopy study. Journal of Electrochemical Society 2013; 160: H179-H184.
35. Liu Z, Robinson JT, Sun X and Dai H: PEGylated nanographene oxide for delivery of water-insoluble cancer drugs. Journal of American Chemical Society 2008; 130: 10876-77.
36. Rezaei B and Damiri S: Multiwalled carbon nanotubes modified electrode as a sensor for adsorptive stripping voltammetric determination of hydrochlorothiazide. IEEE Sensors Journal 2008; 8: 1523-29.
37. Yang W, Ratinac KR, Ringer SP, Thordarson P, Gooding JJ and Braet F: Carbon nanomaterials in biosensors: should you use nanotubes or graphene? Angewandte Chemie International Edition 2010; 49: 2114-38.
38. Tabeshnia M, Heli H, Jabbari A and Movahedi AAM: Electro-oxidation of some non-steroidal anti-inflammatory drugs on an alumina nanoparticle-modified glassy carbon electrode. Turkish Journal of Chemistry 2010; 34: 35-46. 39. Laviron EJ: General expression of the linear potential
sweep voltammogram in the case of diffusionless electrochemical systems. Journal of Electrianalytical Chemistry 1979, 101: 18-28.
40. Yang S, Yang R, Li G, Li J and Qu L: Voltammetric determination of theophylline at a Nafion/multi-wall carbon nanotubes composite film-modified glassy carbon electrode. Journal of Chemical Sciences 2010; 122: 919-26.
41. Dar RA, Brahman PK, Tiwari S and Pitre KS: Adsorptive stripping voltammetric determination of podophyllotoxin, an antitumour herbal drug, at multi-walled carbon
nanotube paste electrode. Journal of Applied
Electrochemistry 2011; 41: 1311-21.
42. Erk N: Voltammetric behaviour and determination of moxifloxacin in pharmaceutical products and human plasma. Analytical Bioanalytical Chemistry 2004; 378: 1351-56.
43. Ewing GW: Instrumental methods of chemical analysis. Lippincott- Raven: Philadelphia, Fifth Edition 1995.
All © 2013 are reserved by International Journal of Pharmaceutical Sciences and Research. This Journal licensed under a Creative Commons Attribution-NonCommercial-ShareAlike 3.0 Unported License.
This article can be downloaded to ANDROID OS based mobile. Scan QR Code using Code/Bar Scanner from your mobile. (Scanners are available on Google Playstore)
How to cite this article: