ORIGINAL RESEARCH ARTICLE
STRUCTURAL MODEL OF SCHOOL BASED MANAGEMENT (SBM)
POLICY IMPLEMENTATION IN MAKASSAR
*Mardhiah
Faculty of Teacher education (Tarbiyah) of Alauddin State Islamic University (UIN) of Makassar
ARTICLE INFO ABSTRACT
This study aims to analyze the relationship SBM policy clarity, organizational environment, and the capacity of implementing organizations in supporting the successful implementation of SBM policies at elementary schools in Makassar. To achieve these objectives selected types of research study with policy implementation of quantitative analysis methods causal model (confirmation of hypothesis testing). Research design is a Structural Equation Modeling (SEM) which is multivariate. Population and sample of this research is elementary school teacher (SD) in Makassar City. The research design is a multivariate Structural Equation Modeling (SEM). The results showed that approximately 80.4% of total variance that can be given by each of the clarity of a policy variable (X1), variable environmental conditions of the organization (X2), the variable capacity of the implementing organization (Y1) to the successful implementation of SBM policies (Y2) together. There are positive and significant influence policy clarity SBM (X1) through implementing the organization's capacity (Y1) to the successful implementation of SBM policies (Y2) with an estimated 2111 = 0045, positive = 0.029<0.05. There is a positive influence and organization's significant environmental conditions (X2) through the capacity of the implementing organization (Y1) to the successful implementation of SBM policies (Y2) with an estimated 2112 = 0078, positive = 0.003<0.05. Total effect (direct and indirect) that occurs is positive and significant at the SBM policy clarity (X1) to the successful implementation of SBM policies (Y2) with the estimated 21+2111 = 0.345, positive = 0.016 <0.05. The total effect is
happening is positive and significant at the organization's environmental conditions (X2) to the successful implementation of SBM policies (Y2) with the estimated 22+2112 = 0.811, positive =
0.003<0.05 at the 0.05 level.
*Corresponding author:
Copyright ©2017,Mardhiah. Thisis an open access article distributed under the Creative Commons Attribution License, which permits unrestricted use, distribution, and reproduction in any medium, provided the original work is properly cited.
INTRODUCTION
School Based Management (SBM) is part of the policy to improve the quality of education that needs to be implemented. The SBM model, which in principle provides widespread authority for schools to develop themselves according to the carrying capacity of the community, shows that schools have been restored to their own environment / habitat. By returning to the environment itself, the school will have self-confidence and be able to do much (Bafadal, Ibrahim, 2003). Hartoyo (2002) in his research found that the quality of education after the pilot project of School Based Management is mostly at a
high level of 88.9%. The influence of organizational and principal management variables on the implementation of
SBM policy according to the results of the analysis is largely 65.3% at an adequate level. While the indicator of successful implementation of SBM policy is the learning process based on the data analysis results are in the category large enough 88.9%. Hartoyo's (2002) study on implementation and barriers to the implementation of SBM in primary school found some key findings: firstly decentralization and school autonomy policies have been formally designed, however, it must be acknowledged that the headroom and understanding of school principals on SBM programs are not yet Develops with maximum. Second, obstacles that hamper the principal in implementing the SBM program, in addition to the concern that every change of material always change the policy, also because the principals are still halfhearted in implementing it. Third, there are still many shortcomings and obstacles facing
ISSN: 2230-9926
International Journal of Development Research
Vol. 07, Issue, 09, pp.15513-15518, September,2017
Article History:
Received 19th June, 2017
Received in revised form 11th July, 2017
Accepted 27th August, 2017
Published online 30th September, 2017
ORGINAL RESEARCH ARTICLE OPEN ACCESS
Key words:
Management, School, Environment, Organization, Policy.
schools to implement SBM programs. Fourth, to implement the SBM program, in addition to mastering the material taught in depth, the teachers difficult to teach well, because of the limitations of school learning props. Fifth, the attitude of teachers who tend to no longer asymmetric, and even have a lot of opportunities for students to dialogue. The results of the above research inform that; (1) the successful implementation of SBM policy is influenced by the school principal's understanding of the content of the policy itself and the effectiveness of its delivery, and the work culture within the school organization (2) successful implementation of SBM policies can be observed in indicators of learning processes, facilities and infrastructure. Seeing the importance of this SBM program, many countries are now implementing this program as an educational reform effort that refers to improving school performance. SBM is directed to improve the quality of schools, which are schools that have effective performance. Several provinces in Indonesia have implemented SBM programs that are expected to realize effective schools as described above, one of which is the South Sulawesi Province. The objective of this research is to analyze the applicable structural model of successful implementation of SBM policy which can be revealed in elementary school in Makassar City related to clarity of SBM policy, organizational environment condition and organizational capacity.
LITERATURE REVIEW
The first person to describe the idea of public policy can be studied systematically is John Dewey (in Said Zainal Abidin, 2004) paying attention to the nature of the experiment from the way policy is measured. It is also illustrated how the plan of action should be chosen from alternative alternatives and how to observe the consequences that can be used as an appropriate trial (Akib, Haedar, 2008). Dewey's mind was later taken over by Harold Lasswell (in Nugroho, Riant, 2006), an experimentalist of political science who first sharpened the idea of policy science as an uninteresting discipline of other disciplinary disciplines. Just as the state administration as a field of study will always ask for appropriate assistance from other fields of study. The science of policy is the study of the decision-making process or the process of selecting and evaluating available and messy information to solve certain problem problems. Science like this is focusing on five intellectual tasks in solving problems. The five intellectual tasks include: the explanation of purpose, the decomposition of trends, the analysis of circumstances, the projection of future development, and the research, evaluation and selection of alternatives. Meanwhile, Keban (2004) states that: "Public policy in general can be seen as government action in the face of problems by directing attention to who gets what, when, and how".
Furthermore, Agustino Leo (2006) states that: public policy study is a complex study because the implementation of a public policy must go through a number of stages: (1) identification and formulation of public problems; (2) formulation of a policy; Analyzing a policy, (5) implementing and monitoring policies, (6) evaluating a policy whether it has achieved results as its design, and (7) assessing the impact and effectiveness of the implementation of a policy. In line with the above opinion, Tayibnapis and Farida Yusuf (2000) modeled the suitability of policy or program implementation using the learning process approach. This model interprets the fit between the three elements that exist in the implementation
of the program, the program itself, the implementation of the program and the target group of the program. School-based management (SBM) is a new alternative in education management that places more emphasis on school self-reliance and creativity. The indicator of SBM success that should be measured and felt by education stakeholders is the improvement of education quality in schools. SBM is principally based on schools and communities and away from centralized bureaucracy. SBM has the potential to increase community participation, equity, and school-based management. Schools in this case become independent institutions in setting policy, but has a network with various parties that can improve the quality of management performance (Fattah, N, 2000).
Jalal and Supriadi (2001) state that; In school models applying the SBM approach to management, teachers and other staff can be more effective because of their participation in decision making. That way, the sense of ownership of the school becomes higher and the use of educational resources is more optimal so as to obtain better results. Furthermore, principals will have greater control over school performance, and the workload of headquarters and local government can be reduced to concentrate only on their role in serving and monitoring school activities. As a benchmark of the successful implementation of SBM, Amiruddian, Siahaan, et al (2006) determined 16 indicators of success, which include: (1) The effectiveness of the learning process; (2) strong school leadership; (3) Effective management of educational personnel; (4) Schools have a culture of quality; (5) Schools have independence, (7) school and community participation, (8) School has transparency, (9) School has a willingness to change, (11) Schools have accountability, (13) Schools have sustainability, (14) The school has sustainability, (14) The school has sustainability, (14) The school has sustainability;) The emphasis of drop out rate, and (16) Satisfaction of staff in accordance with the duties and authorities.
MATERIALS AND METHODS
the questionnaire of the latent construct. The CFA procedure for the final model is to build the measurement model, conduct the initial CFA on the model, modify the index if the model is not fit, and so on until the appropriate overal fit index is called the final stage model (Hamdan Said, Badrullah Bakri Badru and Shahid. Arbuckle, 2010; Meihan and Chung, 2011; James, et al., 2006).
Figure 1. An antecedent model of successful implementation of SBM Policy (Initial Stage)
Figure 2. An antecedent model of successful implementation of SBM policy (Final Stage)
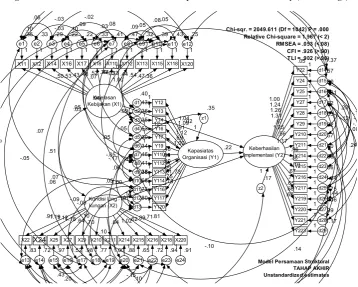
Kebijakan (X1) X11 .35 e1 .50 1 X12 .33 e2 .53 1 X14 .29 e3 .43 1 X16 .22 e4 .48 1 X17 .22 e5 .52 1 Kondisi Ling kungan (X2) X29 .98 e17 X27 1.52 e16 X25 .97 e15 X24 .72 e14 X22 .83 e13 .64 1 1.18 1 1.12 1 1.19 1 .91 1 .51 X18 X210 e18 .70 .10 .43 .20 -.02 .06 .10.09 -.03 -.03 .03 .06 -.09 -.05 .10 -.09 .07 .07 -.09 .04 .05 .07
construct. The CFA procedure for the final model is to build the measurement model, conduct the initial CFA on the model, modify the index if the model is not fit, and so on until the appropriate overal fit index is called id, Badrullah Bakri Badru and Shahid. Arbuckle, 2010; Meihan and Chung, 2011; James,
RESULTS
Based on the final CFA each construct constructed a complete model of structural equations. This model is called
Stage Model. The overall fit index for the initial stage is the p value = 0.000 <0.05, 1 <2
[image:3.595.122.481.494.781.2]RMSEA = 0.031 <0.08, the value of CFI = 0.647, and the value TLI = 0.629. This shows an overall fit index that is less suited to the circumstances, due to less chi
Figure 1. An antecedent model of successful implementation of SBM Policy (Initial Stage)
An antecedent model of successful implementation of SBM policy (Final Stage)
Chi-sqr. = 2049.611 (Df = 1042) P = .000 Relative Chi-square = 1.967 (< 2) RMSEA = .053 (<.08) CFI = .926 (>.90) TLI = .902 (>.90)
Keberhasilan Implementasi (Y2) Y22 1.00 Y24 1.24 Y25 1.26 Y27 1.31 .17 z2 Y28 .67 Y29 1.25
Model Persamaan Struktural TAHAP AKHIR Unstandardized estimates 1 Kapasiatas Organisasi (Y1) Y19 .29 d6 Y17 .53 d5 Y16 .35 d4 Y14 .36 d3 .35 z1 Y13 .43 d2 Y12 .40 d1 1.00 1 .69 1 1.12 1 .91 1 1.09 1 1.04 1 1 1.00 Kejelasan Kebijakan (X1) .12 .02 .22 Y210 .56 Y211 1.17 Y214 .96 Y215 .38 Y216 1.19 .22 .52 1.00 Kondisi Ling kungan (X2) .98 .73 .35 Y110 .34 d7 .46 1 Y112 .46 d8 .83 1 X18 .33 e6 .44 1 X110 .41 e7 .39 1 X112 .47 e8 .33 1 X113 .32 e9 .44 1 X115 .39 e10 .54 1 X118 .43 e11 .47 1 X120 .25 e12 .36 1 X210 .77 e18 .70 1 X211 1.00 e19 .64 1 X214 .88 e20 1.02 1 X215 .65 e21 .62 1 X216 .72 e22 .89 1 X218 .94 e23 .71 1 X220 .91 e24 .81 1 Y113 .41 d9 .90 1 Y114 .38 d10 .66 1 Y116 .68 d11 .81 1 Y117 .73 d12 .75 1 Y120 .80 d13 .78 1 Y217 .67 Y219 .71 Y220 .65 Y221 .68 Y223 .68 .10 .05 -.02 .09 .08 -.09 -.05 .08 -.07 .14 .10 .18 .05 -.13 .05 .03 .05 .06 .07 -.05 -.17 .05 -.03 -.10 .04 .05 .14 -.15
Based on the final CFA each construct constructed a complete model of structural equations. This model is called the Early Stage Model. The overall fit index for the initial stage is the
/ df = 1.641 <2, the value of RMSEA = 0.031 <0.08, the value of CFI = 0.647, and the value TLI = 0.629. This shows an overall fit index that is less
ed to the circumstances, due to less chi-square, CFI and
Figure 1. An antecedent model of successful implementation of SBM Policy (Initial Stage)
An antecedent model of successful implementation of SBM policy (Final Stage)
Chi-sqr. = 2049.611 (Df = 1042) P = .000 Relative Chi-square = 1.967 (< 2) RMSEA = .053 (<.08) CFI = .926 (>.90) TLI = .902 (>.90)1.37
d14 1 .57 d15 1 .90 d16 1 1.31 d17 1 .62 d18 1 .63 d19 1
TLI values supporting model matching. The result of parameter estimation (regression weight or loading factor) through maximum likelihood method. In the simplest form presented in Figure 1. This model can not be used as a benchmark in parameter estimation because it has not shown acceptable fit index. The process of modification indices is done until a more fit index is obtained and the model is expressed as a Final Stage model. The results of the analysis obtained in the simplest form are presented in Figure 2 above. The overall fit index for the final stage model is the value of p = 0.000 <0.05, 1 <2 / df = 1.967 <2, the value of RMSEA = 0.053 <0.08, the value of CFI = 0.926, and the value TLI = 0.902. These values indicate that the probability for chi-square still does not provide an acceptable value, while other criteria have shown acceptable fit. So it has met at least three indexes to be a benchmark of model fit. Thus this model is acceptable for further analysis.
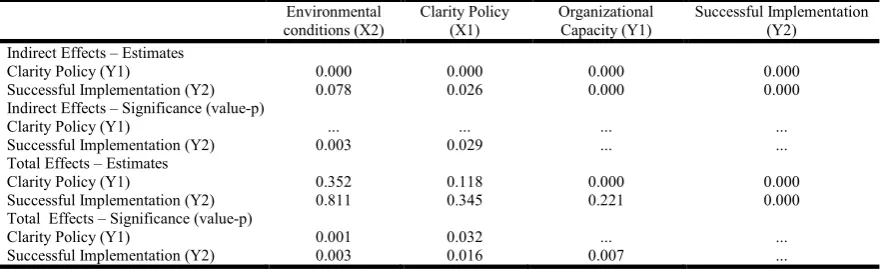
The result of parameter estimation (regression weight) is presented in Table 1 as follows. The analysis results through AMOS for the mediating effect of the intervening variable from the final stage model is presented in Table 2. Based on Table 1 and Table 2 above, the results of hypothesis testing are as follows:
Direct influence of policy clarity variable (X1) on organizational capacity variable (Y1)
The hypothesis to be tested is:
H1: 11> 0 against H0: 11 = 0
As indicated in Table 2, a positive estimate of 11 = 0.118 with
p = 0.005 <0.05 is obtained. This means that H1 is received at the 0.05 significance level. Thus it can be stated that there is a positive and significant influence on the clarity of SBM policy (X1) on the capacity of the implementing organization (Y1) at the 0.05 significance level.
Direct influence of organizational environment condition variable (X2) on organizational capacity variable (Y1)
The hypothesis to be tested is:
H1: 12> 0 against H0: 12 = 0
As indicated in Table 2, a positive estimate of 12 = 0.352 with
p = 0,000 <0.05 was obtained. This means that H1 is received at the 0.05 significance level. Thus it can be stated that there is a positive and significant influence of organizational environmental conditions (X2) on the capacity of the implementing organization (Y1) at the level of significance 0.05. Approximately 34.0% of total variance can be given by each policy clarity variable (X1) and organizational environment condition (X2) on organizational capacity variable (Y1) together.
The direct influence of policy clarity variables (X1) on the successful policy implementation variables (Y2)
The hypothesis to be tested is:
H1: 21> 0 against H0: 21 = 0
As indicated in Table 2, a positive estimate of 21 = 0.129 with
p = 0.005 <0.05 is obtained. This means that H1 is received at the 0.05 significance level. Thus it can be stated that there is a positive and significant influence on the clarity of SBM policy (X1) on the successful implementation (Y2) at significance level of 0.05.
Direct influence of organizational environment condition variable (X2) on success of policy implementation variable (Y2)
The hypothesis to be tested is:
H1: 22> 0 against H0: 22 = 0
As indicated in Table 2, a positive estimate of 22 = 0.734 with
[image:4.595.100.497.280.342.2]p = 0,000 <0.05 was obtained. This means that H1 is received at the 0.05 significance level. Thus it can be stated that there is a positive and significant influence of organizational
Table 1. Estimation of the structural equation coefficient of regression for the Final Stage model
Regression Weight Estimate S.E. T P
Organizational Capacity (Y1) <--- Clarity Policy (X1) 0.118 0.042 2.837 0.005
Organizational Capacity (Y1) <--- Environmental conditions (X2) 0.352 0.047 7.542 0.000
Successful Implementation (Y2) <--- Clarity Policy (X1) 0.129 0.051 2.529 0.005
[image:4.595.80.521.374.509.2]Successful Implementation (Y2) <--- Organizational Capacity (Y1) 0.221 0.049 4.468 0.000 Successful Implementation (Y2) <--- Environmental conditions (X2) 0.734 0.064 11.520 0.000
Table 2. Indirect and total influences among variables
Environmental conditions (X2)
Clarity Policy (X1)
Organizational Capacity (Y1)
Successful Implementation (Y2)
Indirect Effects – Estimates
Clarity Policy (Y1) 0.000 0.000 0.000 0.000
Successful Implementation (Y2) 0.078 0.026 0.000 0.000
Indirect Effects – Significance (value-p)
Clarity Policy (Y1) ... ... ... ...
Successful Implementation (Y2) 0.003 0.029 ... ...
Total Effects – Estimates
Clarity Policy (Y1) 0.352 0.118 0.000 0.000
Successful Implementation (Y2) 0.811 0.345 0.221 0.000
Total Effects – Significance (value-p)
Clarity Policy (Y1) 0.001 0.032 ... ...
Successful Implementation (Y2) 0.003 0.016 0.007 ...
environmental conditions (X2) on the successful implementation (Y2) at the level of significance of 0.05.
Direct influence of organizational capacity organizing capacity (Y1) on successful of SBM policy implementation variable (Y2)
The hypothesis to be tested is:
H1: 21 > 0 against H0: 21 = 0
As shown in Table 2, a positive estimate of 21 = 0.221 with p
= 0,000 <0.05 was obtained. This means that H1 is received at the 0.05 significance level. Thus it can be stated that there is a positive and significant effect on the capacity of the implementing organization (Y1) to the successful implementation of SBM policy (Y2) at the 0.05 significance level. Approximately 80.4% of the total variance can be given by each policy clarity variable (X1), organizational environment condition variable (X2), organizational capacity (Y1) to successful implementation variable (Y2) together.
Indirect influence of policy clarity variables (X1) through organizational capacity (Y1) to successful implementation variable (Y2)
The hypothesis to be tested is:
H1: 2111 > 0 against H0: 2111 = 0
As indicated in Table 2, a positive estimate of 2111 = 0.045
with p = 0.029 <0.05 was obtained. This means that H1 is received at the 0.05 significance level. Thus it can be stated that there is a positive and significant influence of policy clarity variable (X1) through the capacity of implementing organization (Y1) to successful implementation (Y2) at 0.05 significance level.
Indirect influence of organizational environmental condition (X2) variable through organizational capacity organizing variable (Y1) to successful implementation variable (Y2)
The hypothesis to be tested is:
H1: 2112 > 0 against H0: 2112 = 0
As indicated in Table 2, the result of estimation 2112 = 0.078
is positive with p = 0,003 <0.05. This means that H1 is received at the 0.05 significance level. Thus it can be stated that there is a positive and significant influence of organizational environment condition variable (X2) through the capacity of implementing organization (Y1) to successful implementation variable (Y2) at significance level of 0.05.
The total influence (direct and indirect) variable clarity of SBM policy (X1) on the successful implementation variable (Y2)
The hypothesis to be tested is:
H1: 21+2111 > 0 against H0: 21+2111 = 0
As indicated in Table 2, a positive estimate of 21+2111 =
0.345 with p = 0.016 <0.05 was obtained. This means that H1 is received at the 0.05 significance level. Thus it can be stated
that the total influence that occurs is positive and significant in the variable clarity of SBM policy (X1) on the successful implementation (Y2) at the level of significance 0.05.
Total influence (direct and indirect) organizational environmental condition variable (X2) successful implementation (Y2)
The hypothesis to be tested is:
H1: 22+2112 > 0 against H0: 22+2112 = 0
As indicated in Table 2, a positive estimate of 22+2112 =
0.811 with p = 0.003 <0.05 is obtained. This means that H1 is received at the 0.05 significance level. Thus it can be stated that the total influence that occurs is positive and significant in the variable condition of the organization environment (X2) on the successful implementation (Y2) at the level of significance 0.05.
Conclusion
The clarity of SBM policy and the environmental conditions of the organization have a direct positive and significant impact on the capacity of the implementing organization. A total of 34.0% of total variance can be given by each clarity variable of SBM policy and organizational environment condition to organizational capacity variable together. These results indicate that the better the perception of clarity of SBM policy the better the environmental condition of the organization, it will increase the capacity of the implementing organization. In addition, the clarity of SBM policy, the environmental conditions of the organization and the capacity of implementing organizations have a positive and significant impact on the success rate of SBM policy implementation in Makassar City. As many as 80.4% of the total variance can be given by each policy clarity variable, organizational environment condition, and organizational capacity of the implementing agency towards the successful level of SBM policy implementation simultaneously. These results indicate that the better perceptions of clarity of SBM policy, the environmental conditions of the organization, and the capacity of the implementing organization will increase the success of SBM policy implementation. Furthermore, the clarity of SBM policies and the environmental conditions of the organization has a positive and significant indirect impact on the success rate of SBM policy implementation through the capacity of the implementing organization. This means that a good perception of the clarity of SBM policies and the environmental conditions of the organization will improve the success of SBM policy implementation through enhancing the capacity of implementing organizations. In other words, a good perception of the clarity of SBM policies and the environmental conditions of the organization will enhance the capacity of the organization, thereby increasing the success of SBM policy implementation. In addition, the results of the analysis also indicate the total positive and significant influence either directly or indirectly from the clarity of SBM policy and the environmental condition of the organization to the success rate of SBM policy implementation.
REFERENCES
Agustino Leo, 2006. Kebijakan Publik. Bandung: Alfabeta. Akib, Haedar. Artikulasi Konsep Implementasi Kebijakan:
Baca, Edisi tahun 1 No. 1 Vol. 1 Juli-September 2008, h. 28-40.
Amiruddin Siahaan, dkk, 2006. Manajemen Pendidikan Berbasis Sekolah. Jakarta: Ciputat Press Group.
Arbuckle, J.L., 2010. Amos 18.0 User’s Guide. USA: Amos Development Corpororation.
Bafadal, Ibrahim, 2003. Manajemen Peningkatan Mutu Sekolah Dasar, dari Sentralisasi menuju Desentralisasi. Jakarta: Bumi Aksara.
Fattah, N, 2000. Manajemen Berbasis Sekolah. Adira: Bandung.
Ferdinand, A., 2002. Structural Equation Modelling dalam Penelitian Manajemen. Semarang: Undip.
Hamdan Said, Badrullah Bakri Badru and Shahid. M., 2011. Confirmatory Factor Analysis (CFA) for Testing Validity And Reliability Instrument in the Study of Education.
Australian Journal of Basic and Applied Sciences, 5(12): 1098-110.
Hartoyo, 2002. Manajemen Berbasis Sekolah: Pendekatan Desentralisasi Pendidikan dalam Upaya Pemberdayaan Masyarakat dan Sekolah. Departemen Pendidikan Nasional, Direktorat Jenderal Pendidikan Dasar dan Menengah, Basic Education Project: Jakarta.
Hidayat, Deddy N. 2001. Paradigma Klasik dan Hypothetics Deductive Method. Pasca Sarjana Ilmu Komunikasi Universitas Indonesia: Jakarta
Jalal, Fasli dan Supriadi, Dedi, 2001. Reformasi Pendidikan dalam Konteks Otonomi Daerah. Yogyakarta: Adicipta Karya Nusa.
James, B.B., F.K. Stage, F.K., J. King, A. Nora, 2006. Reporting Structural Equation Modeling and Confirmatory Factor Analysis Results: A Review. The journal of education research, Heldref Publications, 99(6): 323-337. Keban T Yeremias, 2004, Enam Dimensi Administrasi Publik.
Yogyakarta: Gava Media.
Kerlinger, F.N., and H.B. Lee, 2000. Foundations of behavioral research (4th ed.). Holt, NY: Harcourt College Publishers.
Meihan, L., W.N. dan Chung, 2011. Validation of the psychometric properties of the health-promoting lifestyle profile in a sample of Taiwanese women. Qual Life Res., 20: 523-528.
Nugroho, Riant, 2006. Kebijakan Publik untuk Negara-negara Berkembang. Jakarta: Gramedia.
Said Zainal Abidin, 2004. Kebijakan Publik. Jakarta: Pancur Siwah.
Tayibnapis, Farida Yusuf, 2000. Evaluasi Program. Jakarta: Rineka Cipta.