Full Length Research Article
IMPACTS OF SUNSPOTS ON SPACE WEATHER AND CLIMATE CHANGE
1*
Mishra, R. K. and
2Dubey, S. C.
1
Department of Physics, Govt. P.G. College Dhamtari, disst. Dhamtari (C.G.), India
2
Department of Physics, S.G.S. Govt. P.G. College, Sidhi (M.P.) Pin-486661, India
ARTICLE INFO ABSTRACT
This paper addresses the Solar Actvity cause and effect of climate change and their various impacts. Earth’s
Sunspots are the coldest part of the Sun and usually develop in pairs. The magnetic field in sunspots stores energy that is released in solar flares (SFs)/coronal mass ejections (CMEs). As a result, solar source activities usually occur in a cycle that mimics the 11-year sunspot cycle (SC). The solar energy that drives the weather system, scientists naturally wondered whether they might connect climate changes with solar variations. The Sun is the primary driver of Earth’s space weather. Storms on the Sun, in the form of SFs/CMEs, can launch showers of radiation and powerful magnetic fields into interplanetary space. Space weather comes as short-lived storms which can last minutes to hours to days. The Sun also undergoes cycles in its level of activity that span years to decades, causing longer-term variations in space weather. Finally, the Sun has changed substantially over the multi-billion year history of our solar system, producing long-term ‘climate change’ effects on our space weather. In the present work, we have discussed potential role of solar activities on recent climate change and space weather.
=
Copyright © 2015Mishra, R. K. and Dubey, S. C.This is an open access article distributed under the Creative Commons Attribution License, which permits unrestricted use, distribution, and reproduction in any medium, provided the original work is properly cited.
INTRODUCATION
Of the many objects in the universe, only two are well known for our climate change and global warming, one is Earth itself and other the Sun. The Sun, which about five billion years old that’s provides an unfailing source of light and energy (Hartmann, 2001). The increase in greenhouse gases caused by human activity is often cited as one of the major causes of global warming. These greenhouse gases reabsorb heat reflected from the Earth’s surface, thus trapping the heat in our atmosphere. This natural process is essential for life on Earth because it plays an important role in regulating the Earth’s temperature. Today the use of fossil fuel for power and electricity is increased thousands times in compassion to pre-industrial revolution. Climate change holds the significant changes in physical and biological systems in all the continents and oceans. It also threatens to destabilize natural phenomena on a regional as well as global scale; some warning signs are already visible. Unprecedented occurrence of severe droughts, heat waves, storms, heavy precipitation, floods, cyclones, shifts in climate zones and seasonality, and increase in sea level and temperature have been reported from various regions of the globe.
*Corresponding author: Mishra, R. K.
Department of Physics, Govt. P.G. College Dhamtari, disst.Dhamtari (C.G.), India
As these ill effects intensify, they will increasingly cause stress to our ecosystems and tribulations to the livelihood and resources of islands, beaches and coasts. The deterioration of the earth’s ecosystems will jeopardize human health; precipitation patterns; water and food supplies; energy supplies; and the integrity of natural systems.
Solar variability and climate change
The Sun also poses a health and safety threat to humans (Palmer et al., 2006) and all kinds of human activities (Jansen and Pirjola 2000). Solar output varies both over the long-term (centuries), which will impact long-term climate trends, and over the shorter-term (the 11 year SC). Observations of the Sun during the middle of the little ice age (1650-1750) indicated that very little sunspot activity was occurring on the Sun’s surface. The little ice age was a time of a much cooler global climate and some scientists correlate this occurrence with a reduction in solar activity over a period of 88 or 176 years. Archibald (2006) predicted that climate during the present solar cycle 24 and forthcoming solar cycle 25 would be significantly cold. The Sun is doing something interesting, and has been for the last few years. .As at late 2010, the progression of the current solar cycle 24 solar minimum indicates that a severe cool period is now inevitable, similar to that of the Dalton Minimum.
ISSN: 2230-9926
International Journal of Development Research
Vol. 5, Issue, 01, pp. 2883-2887, January,2015
International Journal of
DEVELOPMENT RESEARCH
Article History:
Received 03rd October, 2014
Received in revised form 22nd November, 2014
Accepted 30th December, 2014
Published online 26th January, 2015
Key words:
IPCC, TEC,
According to research by NASA solar physicist David Hathaway solar cycle 25 peaking around 2022 could be one of the weakest in centuries. Therefore, it is time to put aside the global warming dogma, if we are moving into another little ice age the next little ice age would be much worse than the previous one and much more harmful than any warming may do. The potential role of solar influences in modulating recent climate has been debated for many decades. The enhanced UV radiation released from the Sun during high solar activity increases the amount of ozone in the stratosphere. At times of minima in the 11-year SC, less ozone is found. One consequence of these solar perturbations is to complicate the detection of human-induced depletion of the protective ozone layer; another may be to perturb the temperature at the Earth’s surface, through connections that link the upper and lower parts of the atmosphere. Variations in temperatures, ozone amounts, and the altitude at which the atmosphere has a given pressure have been correlated with the solar cycle.
Correlations of past solar activity with the historic climate record were reviewed by Brunetti (2003) and detailed work on the 20th century temperature record in relation to solar cycle length was undertaken by Friis-Christensen and Lassen (1991). The Total Solar Irradiance (TSI) is integrated solar energy flux over the entire spectrum which arrives at the top of the atmosphere at the mean Sun-Earth distance. TSI has been monitored from 1978 by several satellites. The long-term solar irradiance variations might contribute to global warming over decades or hundreds of years. Sun has shown a slight cooling trend since 1960, over the same period that global temperatures have been warm. According to TSI variation trends in recent decades, the Sun has contributed a slight cooling influence but our globe is warmed up continuously. It is indication for a dangerous period and high awareness about global warming is most essential. The magnetosphere and upper atmosphere of the Earth can be considerably perturbed by the variations in the solar wind caused by disturbances on the Sun. Changes in the orientation of the interplanetary magnetic field and major increase in the velocity and density of solar wind particles striking the magnetosphere and results in the geomagnetic storms (GMSs).
These storms are seen at the surface of the Earth as perturbations in the components of the geomagnetic field, caused by electric currents flowing in the magnetosphere and upper atmosphere. In addition, the redistribution of particles and fields produces the storms in the ionosphere and thermosphere. Global thermospheric storm winds and composition changes are driven by energy injection at high latitudes. Storm effects may penetrate downwards to the lower thermosphere and may even perturb the mesosphere. Many of the ionospheric changes at mid-latitude can be understood as a response to thermospheric perturbations. A typical mid-latitude ionospheric storm has a positive phase in F2 peak electron density (NmF2) and total electron content (TEC), followed by a negative phase, particularly in the summer hemisphere. At low latitudes, the positive phase may be longer and the negative phase absent altogether. However, there are substantial variations in this scenario from storm-to-storm, depending on location, level of solar activity, magnitude of the geomagnetic disturbance, season of occurrence, local time, time of day of the commencement and duration of the storm.
Sunspots and climate change
Sunspots are huge magnetic storms that are seen as dark (cooler) areas on the Sun’s surface. These spots may be of diameter 37000 km and appear as dark spots within the photosphere, the outermost layer of the Sun. The photosphere is about 400 km deep and provides most of our solar radiation. The layer is about 6000 K at the inner boundary and 4200 K on the outside. The temperature within sunspots is about 4600
K. The number of sunspots peaks every 11.1 years. There is a strong radial magnetic field within a sunspot and the direction of the field reverses in alternate years within the leading sunspots of a group. So the true sunspot cycle is 22.2 years. The number and size of Sunspots show cyclical patterns, reaching a maximum about every 11, 22, 88 and 176 years. In 1801 William Herschel attempted to correlate the annual number of sunspots to the price of grain in London. The most common parameters used to define climate and have been rainfall and temperature, and these have been utilized in many of the Sun-weather studies. There have been several periods during which sunspots were rare or absent, most notably the Maunder minimum (1645-1715), and less markedly the Dalton minimum (1795-1820).
During the Maunder minimum the proportional concentration of radio-carbon (14C) in the Earth’s atmosphere was slightly higher than normal, causing an underestimate of the radio-carbon date of objects from those periods. By means of the premise of excess 14C concentrations in independently dated material such as tree rings, other minima have been found at
times prior to direct sunspot observations, for instance the Sporer minimum from 1450 to1540 (Eddy, 1981).
Incidentally, the Sporer, Maunder, and Dalton minima coincide with the colder periods of the little ice age are explained through the greenhouse effect. This made us to link the influence of sunspots on the Earth’s climate (Verschuren et al. 2000; Neff et al. 2001; Rajesh and Dutta, 2003). Intuitively one may assume that total solar irradiance would decrease as the number of (optically dark) sunspots increased. However, direct satellite measurements of solar irradiance have shown just the opposite to be the case. This means that more sunspots deliver more energy to the atmosphere, so that global temperatures should rise. According to current theory, sunspots occur in pairs as magnetic disturbances in the convective plasma near the Sun’s surface. Magnetic field lines emerge from one sunspot and re-enter at the other spot.
Also, there are more sunspots during periods of increased magnetic activity. At that time more highly charged particles are emitted from the solar surface, and the Sun emits more UV and visible radiation. During periods of maximum Sunspot activity, the Sun’s magnetic field is strong. When Sunspot activity is low, the Sun’s magnetic field weakens. The magnetic field of the Sun also reverses every 22 years, during a Sunspot minimum. The Milankovitch theory suggests that normal cyclical variations in three of the Earth’s orbital characteristics are probably responsible for some past climatic change. The basic idea behind this theory assumes that over time these three cyclic events vary the amount of solar radiation that is received on the Earth’s surface. The first cyclical variation, known as eccentricity, controls the shape of the Earth’s orbit around the Sun. The orbit gradually changes from being elliptical to being nearly circular and then back to
elliptical in a period of about 100,000 years. Second cyclical variation results from the fact that, as the Earth rotates on its polar axis, it wobbles like a spinning top changing the orbital timing of the equinoxes and solstices. Finally, the third cyclical variation is related to the changes in the tilt (
of the Earth's axis of rotation over a 41,000 year period.
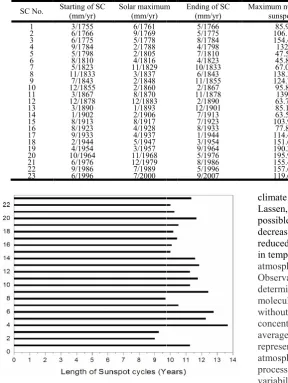
Table 1 gives a catalogue of past sunspot cycles
and several characteristics of sunspot cycles are presented. It is clear that the length of solar cycle, position of solar maxima of sunspot cycle from the beginning of sunspot cycle and maximum sunspot number differ from cycle to cycle. Some similarities are observed in particular sunspot cycles, which is a good base for prediction of future sunspot cycles. The variation in length of sunspot cycles 1–23 is shown in 1. It is clear from this figure that the 11-year period is not constant, but varies between 9 and 13.67 years. Sunspot cycle 23 is similar to sunspot cycle 20 in the way it rises and falls. Sunspot cycle 20 took about four years to peak and about seven years to descend to its minimum. A major part of the sunspot cycle 23’s most intense solar activity occurred 3.5 years after solar maximum. The sunspot cycles 17 and 20 reveal remarkable and intense solar activity in the late stages of both cycles. Sunspot cycles 17 and 20 are very similar in sunspot amplitude to sunspot cycle 23.
Figure 1. The variation in length of sunspot cycles 1 Table.
SC No. Starting of SC (mm/yr)
Solar maximum (mm/yr)
1 3/1755 6/1761
2 6/1766 9/1769
3 6/1775 5/1778
4 9/1784 2/1788
5 5/1798 2/1805
6 8/1810 4/1816
7 5/1823 11/1829
8 11/1833 3/1837
9 7/1843 2/1848
10 12/1855 2/1860
11 3/1867 8/1870
12 12/1878 12/1883
13 3/1890 1/1893
14 1/1902 2/1906
15 8/1913 8/1917
16 8/1923 4/1928
17 9/1933 4/1937
18 2/1944 5/1947
19 4/1954 3/1957
20 10/1964 11/1968
21 6/1976 12/1979
22 9/1986 7/1989
23 6/1996 7/2000
elliptical in a period of about 100,000 years. Second cyclical t, as the Earth rotates on its , it wobbles like a spinning top changing the orbital Finally, the third cyclical variation is related to the changes in the tilt (obliquity) of the Earth's axis of rotation over a 41,000 year period.
gives a catalogue of past sunspot cycles (SC) 1–23 and several characteristics of sunspot cycles are presented. It is clear that the length of solar cycle, position of solar maxima of sunspot cycle from the beginning of sunspot cycle and maximum sunspot number differ from cycle to cycle. Some ities are observed in particular sunspot cycles, which is a good base for prediction of future sunspot cycles. The 23 is shown in Figure year period is not ries between 9 and 13.67 years. Sunspot cycle 23 is similar to sunspot cycle 20 in the way it rises and falls. four years to peak and about seven years to descend to its minimum. A major part of the se solar activity occurred 3.5–4.5 years after solar maximum. The sunspot cycles 17 and 20 reveal remarkable and intense solar activity in the late stages of both cycles. Sunspot cycles 17 and 20 are very similar in
The variation in length of sunspot cycles 1–23
Variations of atmospheric CO
The basic components that influence the Earth’s climatic system can occur externally from extraterrestrial systems and internally from ocean, atmosphere and land systems. The external change may involve variation in the Sun’s output which would externally vary the amount of
received by the Earth’s atmosphere and surface. Internal variations on the Earth’s climatic system may be caused by changes in the concentrations of atmospheric gases, mountains building, volcanic activity, and changes in surface or atmospheric albedo. Due to the global warming, changes occur for large scale weather systems on
surface temperature enhances by the increase of carbon dioxide, CO2, in the atmosphere
enhances the amount of C14 in the atmospheric CO
vegetation. During the increased solar activity close to solar cycle maximum years, Earth is better shie
rays than during the minimum years, and results in the variation of the amount of C
during minima. Thus the C14 content of, for example, annual rings of old trees may reveal interesting information about the Sun’s performance during the last few millennia. Some studies have indicated that there is a connection between long term
climate change and Sun’s activity (Friis Lassen, 1991; Lassen and Friis
possible mechanism is that during high activity levels the decreased amount of galactic cosmic rays could lead to reduced cloud formation in the atmosphere, and hence increase in temperature. The world’s most current data available for the atmospheric CO2 is from measurements at the Mauna Loa
Observatory in Hawaii. Monthly mean CO
determined from daily averages for the number of CO molecules in every one million molecules of dried air and without considering the water vapor in air.
concentrations are the arithmetic mean of the monthly averages for the year. The annual mean rate of growth would represent the sum of all CO2 added to, and removed from, the
atmosphere during the year by human activities and by natural processes. There is a small amount of month
variability in the CO2 concentration that may be caused by
anomalies of the winds or weather systems arriving at Mauna Loa. This variability would not be representative of the
Table. Characteristic properties of solar cycle 1-23
Solar maximum Ending of SC (mm/yr)
Maximum number of sunspots
Position of solar max. (years)
5/1766 85.9 6.33
5/1775 106.1 3.33
8/1784 154.4 3.0
4/1798 132 3.5
7/1810 47.5 6.83
4/1823 45.8 5.75
10/1833 67.0 6.58
6/1843 138.3 3.41
11/1855 124.7 4.66
2/1867 95.8 4.25
11/1878 139 3.5
2/1890 63.7 5.0
12/1901 85.1 2.91
7/1913 63.5 4.16
7/1923 103.9 4.0
8/1933 77.8 4.75
1/1944 114.4 3.66
3/1954 151.6 3.66
9/1964 190.2 3.0
5/1976 195.9 4.16
8/1986 155.4 3.25
5/1996 157.6 2.91
9/2007 119.6 4.16
CO2
he basic components that influence the Earth’s climatic system can occur externally from extraterrestrial systems and internally from ocean, atmosphere and land systems. The external change may involve variation in the Sun’s output ary the amount of solar radiation received by the Earth’s atmosphere and surface. Internal variations on the Earth’s climatic system may be caused by entrations of atmospheric gases, mountains building, volcanic activity, and changes in surface or Due to the global warming, changes occur ther systems on Earth, especially the surface temperature enhances by the increase of carbon atmosphere. The galactic cosmic rays in the atmospheric CO2 and also in
vegetation. During the increased solar activity close to solar cycle maximum years, Earth is better shielded from the cosmic rays than during the minimum years, and results in the variation of the amount of C14 which leads to a decrease content of, for example, annual rings of old trees may reveal interesting information about the Sun’s performance during the last few millennia. Some studies have indicated that there is a connection between long term
climate change and Sun’s activity (Friis-Christensen and Lassen, 1991; Lassen and Friis-Christensen, 1995). One ossible mechanism is that during high activity levels the decreased amount of galactic cosmic rays could lead to reduced cloud formation in the atmosphere, and hence increase The world’s most current data available for the measurements at the Mauna Loa
Observatory in Hawaii. Monthly mean CO2 concentrations are
determined from daily averages for the number of CO2
molecules in every one million molecules of dried air and
without considering the water vapor in air. Annual mean CO2
concentrations are the arithmetic mean of the monthly The annual mean rate of growth would added to, and removed from, the atmosphere during the year by human activities and by natural ses. There is a small amount of month-to-month concentration that may be caused by anomalies of the winds or weather systems arriving at Mauna Loa. This variability would not be representative of the
Position of solar max. Length of solar cycle (years)
[image:3.595.48.337.368.752.2] [image:3.595.46.537.368.726.2]underlying trend for the northern hemisphere which Mauna Loa is intended to represent. The estimated uncertainty in the Mauna Loa annual mean growth rate is 0.11 ppm/yr. Human activities like the burning of fossil fuels, conversion of natural prairie to farmland, and deforestation have caused the release of CO2 into the atmosphere. From the early 1700’s, CO2 has
increased from 275 ppm to 395 ppm in the middle of 2010. The variation of CO2 concentration is shown in Figure 2. From
the plot, exponential growth of CO2 concentration with period
can be observed. The higher concentrations of CO2 in the
atmosphere will enhance the greenhouse effect making the planet warmer. According to computer climate models, if the globe will warm up by 1.5 - 4.5 °C then CO2 concentration
[image:4.595.308.555.46.229.2]can reaches the of 600 ppm by the year 2050.
Figure 2. Variation of CO2 concentration at Mauna Loa
The amount of CO2 that can be held in oceans is a function of
temperature. CO2 is released from the oceans when global
temperatures become warmer and diffuses into the ocean when temperatures are cooler. Initial changes in global temperature were triggered by changes in received solar radiation by the Earth through the Milankovitch cycles. The increase in CO2
then amplified the global warming by enhancing the greenhouse effect. The long term climate changes represent a
connection between the concentrations of CO2 in the
atmosphere and mean global temperature. CO2 is one of the
more important gases responsible for the greenhouse effect. Certain atmospheric gases, like carbon dioxide, water vapor and methane, are able to alter the energy balance of the Earth by being able to absorb long wave radiation emitted from the Earth’s surface. Without the greenhouse effect, the average global temperature of the Earth would be a cold -18 °C rather than the present 15 °C.
The global surface temperature anomalies are plotted in Figure 3. Here, the temperature anomaly means a departure from a reference value or long-term average. A positive anomaly indicates that the observed temperature was warmer than the reference value, while a negative anomaly indicates that the observed temperature was cooler than the reference value. The temperature data for the land and sea surface obtained from the Global Historical Climate Network are used to compute the temperature anomalies. The result reveals that the there exist a temperature anomaly by 1.5 C from its mean values. A rise in Earth’s global temperatures may boost the occurrence and concentration of severe climate events, such as floods, famines, heat waves, tornados, and twisters.
Figure 3.Global surface temperature anomalies
Other consequences may comprise of higher or lower agricultural outputs, glacier melting, lesser summer stream flows, genus extinctions and rise in the ranges of disease vectors. As an effect of increase in global surface temperature species like golden toad, harlequin frog of Costa Rica has already become extinct. There are number of species that have a threat of disappearing soon and various new diseases have emerged lately. The increase in global surface temperature is extending the distribution of mosquitoes due to the increase in humidity levels and their frequent growth in warmer atmosphere. Various diseases due to ebola, hanta and machupo virus are expected due to warmer climates. The effect of increase in global surface temperature will definitely be seen on some species in the water. The increase in global surface temperature is expected to cause irreversible changes in the ecosystem and the behavior of animals. Based on the study on past climate shifts and computer simulations, many climate scientists say that lacking of big curbs in greenhouse gas discharges, the 21st century might see temperatures rise of about 3 to 8º C, climate patterns piercingly shift, ice sheets contract and seas rise several feet.
Climate change will exert unprecedented stress on the coastal and marine environment too. Increase in ocean temperature cause sea level rise and will have impact on ocean circulation patterns, ice cover, fresh water run-off, salinity, oxygen levels and water acidity. Sea level is rising around the world. In the last century, sea level rose 5 to 6 inches more than the global average along the Mid-Atlantic and Gulf Coasts, because coastal lands there are subsiding. Due to global warming, higher temperatures are expected to further raise sea level by expanding ocean water, melting mountain glaciers and small ice caps, and causing portions of Greenland and the Antarctic ice sheets to melt. The IPCC (2007) suggests that if sea level rise could convert as much as 33% of the world’s coastal wetlands to open water by 21st century. Forecasts of climate extremes can improve awareness and reduce adverse effects. Focusing attention on extreme events also may help countries to develop better means of dealing with the longer-term impacts of global climate change. Conversely, the pressures on the biosphere that drive climate change may cause critical thresholds to be breached, leading to shifts in natural systems that are unforeseen and rapid. Studying historical extremes of climate cannot forewarn on the consequences of such events. Rapid changes in climate during extreme events may be more
[image:4.595.40.287.221.403.2]stressful than slowly developing changes due to the greenhouse effect.
REFERENCES
Hartmann, L., J. Ballesteros-Paredes, E.A. Bergin, Ap.J., 562, 2001, 852.
Palmer, S.J., M.J. Rycroft, M. Cermack, Surv. Geophys.,27, 2006, 557.
Jansen, F., R. Pirjola, R. Favre, Space Weather Hazard to the Earth? Swiss Re Publishing, Zurich, 2000.
Archibald, D. Solar Cycles 24 and 25 and Predicted Climate Response Energy and Environment, 17, 2006, 29-38. Brunetti, M. Memoriedella Societa Astronomica Italiana,
74-3, 2003, 778-785.
Friis-Christensen, E. and K. Lassen, Science, 254, 1991, 698-700.
Lassen, K. and E. Friis-Christensen, J. Atmos. Terr. Phys., 57, 1995, 835-845.
Eddy, J.A. Climate and the role of the Sun. In Rotberg and Rabb 1981, 145-167.
Verschuren, D., Laird, K. R. and Cumming, B. F., Rainfall and drought in equatorial east Africa during the past 1100 years. Nature, 403, 2000, 410–414.
Neff, U., Burns, S. J., Mangini, A., Mudelsee, M., Fleitmann, D. and Matter, A., Nature, 411, 2001, 290–293.
Rajesh Agnihotri and Koushik Dutta, Current Science, 85, 2003, 459-463.
IPCC, 2007: Climate Change 2007: Impacts, Adaptation and Vulnerability Contribution of Working Group II to the Fourth Assessment Report of the Intergovernmental Panel on Climate Change [Parry, Martin L., Canziani, Osvaldo F., Palutikof, Jean P., van der Linden, Paul J., and Hanson, Clair E. (eds.)]. Cambridge University Press, Cambridge, United Kingdom, 1000 pp.