ORIGINAL RESEARCH ARTICLE
THE INFLUENCE OF MOBILE TECHNOLOGY USAGE BEHAVIOR ON PERCEIVED WORK
PERFORMANCE IMPROVEMENT
1
Laleska Lebioda,
2, *Ivanete Schneider Hahn and
2Anderson Antônio MattosMartins
1Department of Business Administration, Santa Catarina State University - Udesc, Florianópolis, Brazil 2Department of Graduation in Development and Society, University Alto Vale do Rio do Peixe - Uniarp, Caçador, Brazil
ARTICLE INFO ABSTRACT
Mobile technology is a method of internet access and other utilities through mobile devices such as cell phones, iPad, iPhone, iPod, laptops, smart pads and others related. In this study, we investigate if the mobile technology usage behavior affects the perceived work performance improvement. In addition, it was verified if there were some differences between the generations. To accomplish that, we applied a survey to 580 Brazilians which use mobile devices. To evaluate the relations between variables, univariate and multivariate statistics were used. The results evidenced, first that the perceived usefulness and perceived ease of use increase the mobile technology usage behavior. Second, it was found that mobile technology usage behavior increases the perceived work performance improvement. Finally, findings of this study provided that the differences in mobile technology usage among employees from different generations exist.
Copyright © 2019,Laleska Lebioda et al., This is an open access article distributed under the Creative Commons Attribution License, which permits unrestricted
use, distribution, and reproduction in any medium, provided the original work is properly cited.
INTRODUCTION
Mobile technology is a method of internet access and other utilities through mobile devices such as cell phones, iPad, iPhone, iPod, laptops, smartpads and others related (Vieira and Alcantara, 2011). These technologies have redefined the social dynamics creating new forms of collaboration and interaction (Lyytinen and Yoo, 2002; Pica and Kakihara, 2003) and the widespread reception of mobile phones, smart phones and tablets as communication tools and entertainment is setting a new social contact patterns and providing the most personal freedom for users (Nurullah, 2009). At the same time, its popularity has created new ways of personal and professional communication, including breaking down the boundaries
between these two universes (Cavazotte et al., 2014; Chesley,
2005; Cipriano and Nicolaci-da-Costa, 2009). In business, the need for flexible workers is an important factor that motivates them to adopt mobile technologies, and there are high adoption forecasts for the coming years (Huang, 2015). Evidence shows that many companies have been adhering to and applying (and enabling) mobile technologies in the workplace to improve the
*Corresponding Author: Ivanete Schneider Hahn,
Department of Graduation in Development and Society, University Alto Vale do Rio do Peixe - Uniarp, Caçador, Brazil.
performance of internal and external communication, promoting flexibility of access to information and workflows (Harmon and Demirkan, 2011; Stieglitz and Brockmann, 2012;
Lu et al., 2015). Research also pointed out the benefits of
implementing mobile technology in the workplace. Lu, Yueh, and Lin (2015) suggested that the use of mobile technology (smartphones and tablets) in the workplace improves communication between employees, customers and businesses to promote workflows and improve the professional image. Stieglitz and Brockmann (2012) propose the use of a mobile access system helps company employees and receive ad hoc information, making workflow more efficient and transparent. Chang Tseng, and Woodside (2013), in a study of executives from different countries, noted that the use of mobile technologies improves productivity, responsiveness and job satisfaction of employees. Other studies, supported by local
realities, confirm these results (Huang, 2015; Lu et al., 2015).
To show a small part of this research gap, this study is designed to investigate whether the use of mobile technology has affected the way people work. The analysis was conducted with different generations, considering that the inference of mobile technologies seems to concentrate on generations X and Y (Batat, 2008; Nurullah, 2009; Mcmillan and Morrison, 2006). Nevertheless, it has still numerous studies devoted to company managers, assuming that there are generational
ISSN: 2230-9926
International Journal of Development Research
Vol. 09, Issue, 02, pp.25733-25738, February, 2019
Article History:
Received 17th November, 2018 Received in revised form 03rd December, 2018 Accepted 13th January, 2019 Published online 27th February, 2019
Key Words:
Generation, Human Resource Management, Technology Usage, Survey.
Citation: Laleska Lebioda, Ivanete Schneider Hahn and Anderson Antônio Mattos Martins, 2019. “The influence of mobile technology usage behavior on
perceived work performance improvement”, International Journal of Development Research, 9, (02), 25733-25738.
differences between the workers and the characteristics of people can explain some of the important changes that have occurred over the past decade in the attitudes of employees and expectations. However, only a few scientific researchers have
been conducted to test these generalizations (Becton et al.,
2014). Therefore, clearly, this study is only one-step in the development of management strategies by understanding the generational differences. The presentation of the study starts by contextualizing the survey and demarcation of the objective problem. Then rescue the literature that supports the research question. The third section presents the methodological aspects of the work, from the design of the survey instrument, the delimitation of the population, sample and data collection, and the analysis of the data. The fourth section presents the results received in the survey, bringing the main discussions and statistics deductions. Finally, the last section is intended for managerial and academic implications, study limitations and future research suggestions.
The mobile technology usage intent
The mobile revolution is a reality. Just watch the routine in malls, cafes, trains, cars, buses, airports and on the streets, and one can easily see how much penetration and adoption of mobile devices are changing the living standards and
transforming the way people interact (Martin-Dorta et al.,
2011) and communicate (Jarvenpaa and Lang, 2005). In the literature, we can find several models to measure beliefs or other perceptions about technology usage, like the Ajzen’s theory of planned behavior (TPB) (Ajzen, 1991), TAM model that added perceived usefulness and perceived ease of use as attitudinal beliefs salient to technology usage (Davis, 1989), and the a synthesized model named UTAUT that suggested that a person’s intention to use IT was influenced by four user perceptions (perceived usefulness, perceived ease of use, subjective norm and perceived behavioral control) (Venkatesh
et al., 2003; Venkatesh et al., 2012). These associations are
well known and have been extensively validated so it was only included perceived usefulness and perceived ease of use in our hypotheses. Therefore, there is vast evidence in the literature showing that perceived usefulness and ease of use of technology influences the usage behavior (Saleemd and
Rashid, 2011; Venkatesh and Davis, 2000; Sun et al., 2009;
Yueh et al., 2015). Likewise, the conditions and external
factors of the use of technology affect the acceptance of the
individual to the technology (Venkatesh et al., 2003;
Venkatesh et al., 2012). So, it was designed the first two
hypothesis.
H1: Perceived usefulness has a positive impact on usage
behavior.
H2: Perceived ease of usehas a positive impact on usage
behavior.
It is important to contextualize technology usage within work settings in order to maximize its power in organizations. This should provide organizational managers with a broader set of options to increase IT usage within their organizations and assess the impact of such usage on outcomes (such as
productivity or performance gains) (Sun et al., 2009).
Improving work performance by using mobile technology and the generation gap: There are some studies linking the mobile use to the work performance. As example, Allen and Bryant (2011) established the relationship between technology
use and work performance by surveying 200 employees in startup organizations. The employees agreed that they finished work tasks more efficiently with mobile technology. There are evidences that mobile technology improves employees' work
knowledge and capability (Kahle-Piasecki et al., 2012). From
the executives' perspective, the mobile technology encourages employees' productivity, communication capability and
mobility at lower cost (BEUTNER; PECHUEL, 2012; LU et
al., 2015). In addition, Stieglitz and Brockmann (2012) explain
howmobile technologies increase organizational performance after surveying 192 CIOs and IT managers in German
companies. Yueh et al., (2015) shows that the usage behavior
is the sufficient condition of perceived improvement of work performance. Therefore, the relationship between the usage behavior and work performance supports the hypothesis that employees' usage behavior of mobile technology has a positive impact on their perceived work performance improvement.
H3: The usage behavior has a positive impact on perceived
work performance improvement.
One of the biggest challenges facing managers today is learning how to lead a multigenerational workforce. Many organizations have four generations of employees working alongside one another, and every generation has different
expectations of what they want from the workplace (Lester et
al., 2012). A generation is the social construction where
individuals born during a similar period and these are influenced by historical, social events, and their experiences making them different from one other generation. These differences continue to be molded as aging (Howe and Strauss, 2007), influencing people's thoughts of authority, money, institutions, family and career (Conger, 2002). There are three classifications of age-based generations: baby boomers (1943-1964) generation X (1965-1977) and generation Y (1978-1990) (Parry and Urwin, 2011; Westerman and Yamamura, 2007), and in recent years we had the inclusion of generation
Z, formed by people born after the nineties (Collistochi et al.,
2012; Shah, 2009). Several studies, especially those directed to managers of companies, are between Y and Z generations (Batat, 2008; Mcmillan and Morrison, 2006; Nurullah, 2009), from the perspective that these generations are less committed
at work (Becton et al., 2014). Likewise, these same
generations would be more likely to use mobile technologies. By extension, we hypothesize that the generation affectsboth: usage behavior and perceived work performance improvement.
H4: The generation affects the mobile technology usage
behavior.
H5: The generation affects the perceived work performance
improvement.
From these evidences, we developed an empirical effort to test the hypotheses verified. The operationalization of the study is ready in the next chapter.
METHODS
1999). To evaluate the relationship between different variables we used multivariate statistical techniques.
The measures: The data collection instrument was developed from Venkatesh studies, Thong and Xu (2012) and Lunardi, Dolci and Maçada (2010). The adaptation of the data collection instrument remained a concern not to overly the extension of the questionnaire, considering the interest in obtaining respondents of different generations, occupations, training.... Thus, the final questionnaire had four dimensions: (1) respondents profile: consists of questions regarding age, occupation, gender, training and Federative Unit; (2) Usage behavior: measured from six observable variables, using the measurement Likert scale; (3) Perceived Ease of Use: measured from three observable variables, using the measurement scale Likert; (4) Perceived Usefulness: checked by three observable variables; (5) Percieved Work Performance Improvement: measured by four observable
variables. Since it was an adaptation of questionnaires, we
proceeded to a data collection instrument validation step, made by academics (MALHOTRA, 2001), and the questionnaire was considered appropriate. Considering the desirability of applying the questionnaire to different generations, we proceeded an informal pretest with five distinct profiles, randomly chosen, in order to eliminate potential questionnaire problems, especially as regards the understanding of the questions and fill. It was not identified problems in understanding, this way we proceeded the application of the questionnaire.
Research sample and data collection: We look on this research on Brazilians over 16 years old (able to the job market) and users of mobile technologies. The main criterion used to scale the size of the sample number of respondents was the number needed to allow the use of exploratory factor analysis technique, based on the Kline recommendations (2011). These recommendations show that the minimum sample size should be in terms of the proportion of cases (N) with the number of parameters (observable variables) of the model (Q), considering the ideal proportional sample of 20:1. This way, the suggested sample refers to the minimum of 360 cases. The choice of the sample did not follow statistical methods; it is considered the number of returned questionnaires and filled. For the implementation and application of the research for this population, we adopted the online form tool Google Drive. We apply the online questionnaire because of the large study population. The invitation to participate was sent through the network of contacts involved in the study, collecting data through the collection method called 'snowball'.
This technique is a form of non-probability sample used in research where the original participants of a study indicate new participants which in turn to indicate new entrants and so on, until it reached the proposed objective (the "saturation point"). The "saturation point" is reached when the new respondents begin to repeat the content already obtained in previous interviews, without adding new information relevant to the search (WHA, 1994). Therefore, the “snowball” is a type of technique that uses reference chains, a kind of network. In a complementary manner, considering that the online survey showed a certain group and profile of respondents, we printed some questionnaire and apply personally in large and medium enterprises in the industrial capital of the Midwest of Santa Catarina. Data collection began in early August 2015 and was
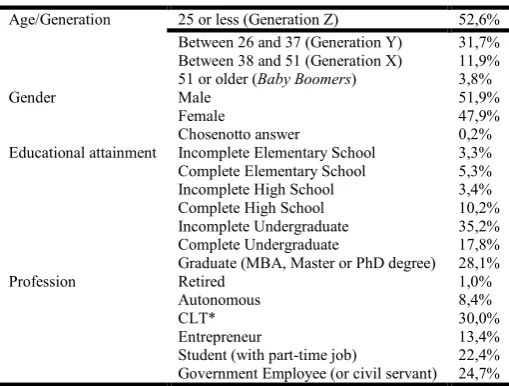
[image:3.595.306.561.195.388.2]completed in three months. Therefore, the final sample is 851 interviewed people, which 271 respondents do not use mobile devices or do not use mobile devices at work, this way we considered 580 valid questionnaires. This sample, however, could not be considered as probability because the probability of inclusion of everyone is not known or equivalent (Malhotra, 2001). Respondents belong to 15 Brazilian states, with the clear majority located in southern Brazil. First, we sought to characterize the sample of respondents, to meet the group (see Table 1).
Table 1. Demographic profile (n=580)
Age/Generation 25 or less (Generation Z) 52,6% Between 26 and 37 (Generation Y) 31,7% Between 38 and 51 (Generation X) 11,9% 51 or older (Baby Boomers) 3,8%
Gender Male 51,9%
Female 47,9%
Chosenotto answer 0,2%
Educational attainment Incomplete Elementary School 3,3% Complete Elementary School 5,3% Incomplete High School 3,4% Complete High School 10,2% Incomplete Undergraduate 35,2% Complete Undergraduate 17,8% Graduate (MBA, Master or PhD degree) 28,1%
Profession Retired 1,0%
Autonomous 8,4%
CLT* 30,0%
Entrepreneur 13,4%
Student (with part-time job) 22,4% Government Employee (or civil servant) 24,7% Source: Authors' calculations based on survey data
* Employees working under the CLT (Brazilian consolidation of labor laws) regulation
As report at Table 1, most of the respondents belong to the X and Z. Surveying the genre indicated that the survey is roughly homogeneous, although most of the respondents are male. As a profession, most acts as CLT, with high education level. As mobile technologies commonly used by the sample we have the notebook (72%), mobile phone or smartphone (71.2%) and smart pads (26.7%).
Data matrix and construct validation: The collected data were analyzed using the SPSS Statistics 21 and IBM AMOS program, by adopting models of univariate and multivariate analysis. Initially, we proceeded the preparation of the input matrix, where the collected data was treated to identify outliers, missing values and normal distribution of figures. Missing values were identified by a simple frequency distribution of missing data, replacing the missing values by the average of the variable. The atypical observations were identified by calculating Z Score, where all the data showed
values less than 3 (HAIR et al., 2005).
Acceptable reliability must comply to values equal to or greater than 0.7, for the reliability of the construct and equal to
or greater than 0.5 for the variance extracted (Hair Jr. et al.,
2005). All measures presented the recommended values.To verify the multicollinearity we used the Variance Inflation Factor (VIF) and no variables presented a high level of multiple associations. The homoscedasticity was performed by the Levene's test at a significance level of 5%. Through an One-Way ANOVA, we found that no variables were heteroscedastic; therefore, no variables were excluded from further analysis.
RESULTS AND DISCUSSION
After scanning the data, and checking the setting of the measures, we effected multivariate statistical analyzes to test hypotheses through multiple linear regression models. Therefore, the analysis of the significance and standardized loads factor and variance allowed the verification of the hypotheses of the study (see Table 3).
The results present on Table 3 showed that all the hypotheses were supported in this study. So, it is possible to infer that: (1) when perceived usefulness increases 1 point, the mobile technology usage behavior increases 0.32 points (supporting H1) and when perceived ease of use increases 1 point, the mobile technology usage behavior increases 0.52 points (supporting H2). In addition, we observe that every 1-point increase on mobile technology usage behavior increases the perceived work performance improvement in 0.39 points (supporting H3). As expected, the results strengthen the evidence of the literature on the history of the use of technology, and both the perceived usefulness and the perceived ease of use have a positive impact on mobile technology usage behavior, like suggested by Saleemd and
Rashid (2011) Venkatesh and Davis (2000), Yueh et al.,
(2015) and others. Not differently, the results of our study confirm that the mobile technology usage behavior increases the perceived work improvement performance, suggested by Allen and Bryant (2011), Kahle-Piasecki, Miao and Ariss
(2012), Beutner and Pechuel (2012), Lu et al., (2015), Yueh et
[image:4.595.32.556.76.129.2]al., (2015) and others. About the generation gap, considering
Table 2. Exploratory factor analysis solution
Observable variables Cumulative variance (%) KMO* solution Extracted variance Reliability
Usage behavior 6 57.74 0.865 0.67 0.93
Perceived Ease of Use 3 75.72 0.714 0.73 0.89
Perceived Usefulness 3 60.23 0.648 0.78 0.91
Perceived work performance improvement 4 69.76 0.775 0.70 0.90
*KMO: Kaiser-Meyer-Olkin measure
[image:4.595.38.560.175.256.2]Source: Authors' calculations based on survey data
Table 3. Estimated parameters of the model and hypotheses status
R² Standardized beta
T-value Sig. Hypotheses status H1. Perceived usefulness has a positive impact on mobile technology usage behavior. 0.64 0.32 11.37 *** Supported H2. Perceived ease of use has a positive impact on mobile technology usage behavior. 0.64 0.52 17.82 *** Supported H3. The mobile technology usage behavior has a positive impact on perceived work
performance improvement.
0.27 0.39 6,72 *** Supported
H4. The generation affects the mobile technology usage behavior. 0.10 -0.12 -3.12 ** Supported H5. The generation affects the perceived work performance improvement. 0.07 0.11 1,93 ** Supported Source: Authors' calculations based on survey data
*** p ˃ 0.001; *** p ˃ 0.05
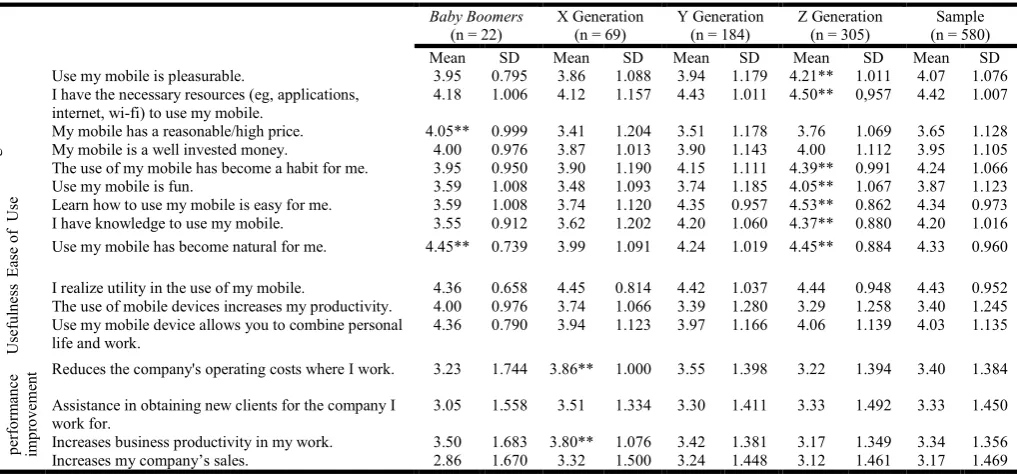
Table 4. Univariate analysis of the dimensions by generation
Baby Boomers
(n = 22)
X Generation (n = 69)
Y Generation (n = 184)
Z Generation (n = 305)
Sample (n = 580) Mean SD Mean SD Mean SD Mean SD Mean SD
Usage
beh
av
io
r Use my mobile is pleasurable. 3.95 0.795 3.86 1.088 3.94 1.179 4.21** 1.011 4.07 1.076
I have the necessary resources (eg, applications, internet, wi-fi) to use my mobile.
4.18 1.006 4.12 1.157 4.43 1.011 4.50** 0,957 4.42 1.007
My mobile has a reasonable/high price. 4.05** 0.999 3.41 1.204 3.51 1.178 3.76 1.069 3.65 1.128 My mobile is a well invested money. 4.00 0.976 3.87 1.013 3.90 1.143 4.00 1.112 3.95 1.105 The use of my mobile has become a habit for me. 3.95 0.950 3.90 1.190 4.15 1.111 4.39** 0.991 4.24 1.066 Use my mobile is fun. 3.59 1.008 3.48 1.093 3.74 1.185 4.05** 1.067 3.87 1.123
Perceive
d
Ease
o
f
Use Learn how to use my mobile is easy for me. I have knowledge to use my mobile. 3.59 3.55 1.008 0.912 3.74 3.62 1.202 1.120 4.20 4.35 1.060 0.957 4.37** 4.53** 0.880 0.862 4.20 4.34 0.973 1.016
Use my mobile has become natural for me. 4.45** 0.739 3.99 1.091 4.24 1.019 4.45** 0.884 4.33 0.960
Perceive
d
Useful
ne
ss I realize utility in the use of my mobile. 4.36 0.658 4.45 0.814 4.42 1.037 4.44 0.948 4.43 0.952 The use of mobile devices increases my productivity. 4.00 0.976 3.74 1.066 3.39 1.280 3.29 1.258 3.40 1.245 Use my mobile device allows you to combine personal
life and work.
4.36 0.790 3.94 1.123 3.97 1.166 4.06 1.139 4.03 1.135
Perceive
d
w
o
rk
p
erform
ance
imp
ro
veme
n
t Reduces the company's operating costs where I work. 3.23 1.744 3.86** 1.000 3.55 1.398 3.22 1.394 3.40 1.384
Assistance in obtaining new clients for the company I work for.
3.05 1.558 3.51 1.334 3.30 1.411 3.33 1.492 3.33 1.450
Increases business productivity in my work. 3.50 1.683 3.80** 1.076 3.42 1.381 3.17 1.349 3.34 1.356 Increases my company’s sales. 2.86 1.670 3.32 1.500 3.24 1.448 3.12 1.461 3.17 1.469 Source: Authors' calculations based on survey data; SD = Standard Deviation
[image:4.595.49.558.301.538.2]that 1 is equivalent a Gen-Z; 2 is equivalent a Gen-Y; 3 is equivalent a Gen-X and 4 is equivalent a Gen-Boomers, we used to verify the hypothesis the regression analysis (and a descriptive analysis listed in Appendix 1). So, we can observe that every 1 increase in generation, the mobile technology usage behavior decreases in 0.12 (supporting H4). In the other side, every 1 increased in generation increases perceived work performance improvement in 0.11 points (supporting H5). Expectedly, the four generations examined express significant differences. A common misperception is that the older
generations are resistant to technology (Becton et al., 2014).
Generation Z in general was shown to be more prone to the use of different mobile technologies, far above the other generations. This behavior was expected, considering that Tapscott (2010) and other authors already showed that this generation is considered the internet generation. It infers also that this generation is looking for entertainment and fun at work, in education and social life, being widely accustomed to
instant responses, chat in real time (Collistochi et al., 2012;
Tapscott, 2010). On other hand, our study suggested that the older generations, like Gen-Boomers, use the mobile technologies at work, and that all the generations believe that the mobile technology use increases their productivity and work performance. However, the results revealed that individualsconsidered Gen-Boomers and Gen-X, valued the mobile technology modes of communicationless than their younger colleagues did. This specifically result is near that
Becton et al., (2014) findings.
Conclusions and Implications for Practice
The results showed that the perceived usefulness and perceived ease of use increase the mobile technology usage behavior. Second, we found that the mobile technology usage behavior increases the perceived work performance improvement. Finally, findings of this study provide that differences in mobile technology usage among employees from different generations exist. So, the main purpose of this article was to provide meaningful contributions to the mobile technology usage behavior and the implications of this use at work
performance. In addition, this study advances our
understanding of generational differences by empirically testing the common assumptions in human resource management. Findings of this study provided further evidence that differences in mobile technology usage among employees from different generations exist. Specifically, our results help managers to understand the working behavior of different generations, and how a possible use of prohibition policy of this kind of technology at work can affect employee productivity, enhancing studies that have occurred over the years. At the same time, the results confirm the strategic importance of mobile technology, which while changes the desktop and leisure of people, it creates many opportunities for new and innovative services provided through mobile devices. The originality of this study focuses on one of the first empirical efforts in Brazil to analyze strategic and organizational implications of mobile technology. In addition, the results of the study will expectantly serve as a basis for more comprehensive research.
Limitations and future research directions: Even reaching the goals of this study, it had limitations. The first refers to the study design, noting that changes in situational and surface features, the most inherent to the change, were not included. Another limitation of this study is that the study only examined
the generational differences, but it possible that some of the differences reported in this study may be attributable to changes because of age or the stage in the life cycle. In addition, this study examined each generation as a homogeneous group, but some researchers suggest that exists a heterogeneity within generations than between generations
(Denecker et al., 2008; Parry and Urwin, 2011). So, future
studies should examine if socio-demographic variables cause significant variations in work values within a generation.
REFERENCES
Ajzen, I, 1991. The theory of planned behavior.
Organizational Behavior and Human Decision Processes,
50, p.179-211
Allen, D.G. and P.C. Bryant, 2011. Employment mode choices in early and late stage startups: A preliminary exploration
using fsQCA. American Journal of Entrepreneurship, 2,
p.1-17.
Batat, W, 2008. Exploring adolescent development skills through Internet usage: a study of French 11-15 year olds.
International Journal of Consumer Studies, 32(4),
p.374-381.
Becton, J.B., H.J.Walker and A. Jones-Farmer, 2014.
Generational differences in workplace behavior. Journal of
Applied Social Psychology, 44, p. 175–189.
Beutner, M. and R.Pechuel, 2012. Acceptance, chances, and problems of mobile learning invocational education in enterprises. International Conference on Mobile and
Contextual Learning, 11., Helsinki/Finland, Proceedings,
Finland.
Cavazotte, F. S. C. N., A.H.C. Lemos and M.S. Brollo, 2014. Trabalhando melhor ou trabalhando mais? Um estudo
sobre usuários de smartphones corporativos. Organizações
and Sociedade, 21 (68), p. 769-788.
Chang, C.W., T.H. Tseng, and A.G. Woodside. Configural algorithms of patient satisfaction, participation in diagnostics, and treatment decisions' influences on
hospitalloyalty. Journal of Services Marketing, v.27, n.2,
p.91-103, 2013.
Chesley, N, 2005. Blurring Boundaries? Linking technology
use, spillover, individual distress, and family satisfaction.
JournalofMarriageand Family, 67(5), p. 1237-1248.
Cipriano, L.and A.M.Nicolaci-Da-Costa, 2009. Celulares pagos por empregadores: “benefício” ou “malefício”?
Psicologia – Ciência e Profissão, 29(1), p. 146-159.
Collistochi, C.C. et al., (2012. A relação entre as gerações e o
processo de aprendizagem emuma organização bancária. In: Encontro da Associação Nacional de Pós-Graduação ePesquisa em Administração, 36., 2012, Rio de Janeiro.
Anais...Rio de Janeiro: ANPAD.
Conger, J, 2002. Quem é a geração X? Liderança e gestão de
pessoas: autores e conceitos. São Paulo: Publifolha. Davis, F. D, 1989. Perceived usefulness, perceived ease of use,
and user acceptance of information technology. MIS
Quarterly, 13 (3), p.319-339.
Denecker, J.C., A. Joshi, J.J.Martocchio, 2008. Towards a theoretical framework linking generational memories to
attitudes and behaviours. HumanResource Management
Review, 18, p. 180-187.
Fonseca, J.J.S, 2002. Metodologia da pesquisa científica.
Fortaleza: UEC.
measurement error. Journal of Marketing Research 18 (1), p.39-50.
Hair Jr., J. F., R.E. Anderson, R.L. Tatham and W.C.
Black.(2005)Análise multivariada de dados. 5. ed. Porto
Alegre: Bookman.
Harmon, R.R. and H. Demirkan, 2011. The next wave of
sustainable IT. IT professional, 13, p.19-25.
Howe, N. and W. Strauss, 2007).The next 20 years: how
customer and workforce attitudes will evolve. Harvard
Business Review, p. 41-52, July.
Huang, Y.F, 2015).iThome 2015 survey of the CIO II: Mobile applications trend analysis. Available online http://www. ithome.com.tw/article/94146
Jarvenpaa, S. L. and K.R. Lang, 2005. Managing the
paradoxes of mobile technology. Information Systems
Management, 22 (4), p.7-23.
Kahle-Piasecki, L., C. Miao and S.Ariss, 2012. Managers and the mobile device: m-learningand m-business: Implications
for the United States and China. Journal ofMarketing
Development & Competitiveness, 6 (1), p. 58-68.
Lester, S. W., R.L. Standifer, N.J Schultz and J.M. Windsor, 2012. Actual versus perceived generational differences at
work: An empirical examination. Journal of Leadership
and Organizational Studies, 19(3), p. 341-354.
Lu, M.H., H.P. Yueh and W. Lin, 2015. Exploring the key factors for corporate implementationof mobile technology. IEEE International Conference onAdvanced Learning
Technologies, 15, Taiwan, Proceedings…IEEE Computer
Society, Taiwan.
Lunardi, G. L., P.C. Dolci, and A.C.G. Maçada, 2010. Adoção de tecnologia de informação e seu impacto no desempenho organizacional: um estudo realizado com micro e pequenas
empresas. Revista de Administração, São Paulo, 45(1), p.
05-17.
Lyytinen, K. and Y. Yoo, 2002. Issues and challenges in
ubiquitous computing.Communication ofthe ACM, 45 (2),
p. 63-65
Malhotra, N. K, 2001. Marketing research. 3. ed. Porto
Alegre: Bookman.
Martin-Dorta, N.,J. L.Saorin, and M.Contero, 2011. Web-based Spatial Training Using Handheld Touch Screen
Devices. Educational Technology & Society, 14 (3), p.163–
177.
McMillan, S.J. and M. Morrison, 2006. Coming of age with the Inter-net: a qualitative exploration of how the Internet
has become an integral part of young people’s lives.New
Media & Society, 8 (1), p.73-95.
Nurullah, A.S, 2009. The Cell Phone as an Agent of Social
Change. Rocky Mountain Communication Review, 6 (1), p.
19-25
Parry, E. and P.Urwin, 2011. Generational differences in work
values: a review of theory and evidence.International
Journal of Management Reviews, 13 (1), p. 79-96.
Pica, D. and M. Kakihara, 2003. The duality of mobility: designing fluid organizations through stable interaction. In: European Conference on Information Systems, 11., 2003,
Napole, Italy. Proceedings…
Saleemd, Z. and K. Rashid, 2011. Mobile banking adoption in
banking sector of Pakistan. Journal of Yasar University, 21
(6), p. 3538-3560
Santos, A. R, 1999. Metodologia científica: a construção do
conhecimento. Rio de Janeiro: DP&A.
Shah, G, 2009. The impact of economic globalization on work
and family collectivism in India. Journal of Indian
Business Research, 1 (2/3), p. 95-118.
Stieglitz, S. and T. Brockmann, 2012. Increasing
organizational performance bytransforming into a mobile
enterprise. MIS Quarterly Executive, 11, p. 189-204.
Sun, Y., A.Bhattacherjee and Q. Ma, 2009. Extending technology usage to work settings: The role of perceived
workcompatibility in ERP implementation. Information &
Management, 46, p. 351–356.
Tapscott, D, 2010. Growing Up Digital:The Rise of the Net
Generation. McGraw-Hill.
Venkatesh, V., M.G. Morris, G.B.Davis,andF.D.Davis, 2003.
“User Acceptance of Information Technology: Toward a
Unified View,” MIS Quarterly, 27 (3), p. 425-478.
Venkatesh, V. and F.D. Davis, (2000. A Theoretical Extension of the Technology Acceptance Model: Four Longitudinal
Field Studies. Management Science, 46 (2), p. 186–204.
Venkatesh, V., J. Y. L., Thong, and X. Xu, 2012. Consumer acceptance and use of information technology: extending
the unified theory of acceptance and use
of technology. MIS Quarterly, 36 (1), p. 157-178
Vieira, A. L. N.and C.A.A Alcantara, 2011. Tecnologia Móvel:
Uma Tendência, Uma Realidade. Cornell University Library: Cornell University.
Yueh, H., M. Lu and W. Lin, 2015. Employees' acceptance of mobile technology in a workplace: An empirical study
using SEM and fsQCA. Journal of Business Research, (in
press).
Westerman, J. W. and J.H. Yamamura, 2007. Generational preferences for work environment fit: effects on employee
outcomes. Career Development International, 12 (2), p.
150-161.
WHA, World Health Association, 1994. Division of Mental
Health: Qualitative Research for Health Programmes.
Geneva