BIROn - Birkbeck Institutional Research Online
Hough, Mike and Sato, M. (2011) Trust in justice: why it is important for
criminal policy, and how it can be measured. Project Report. Euro-Justis
Project, Helsinki, Finland.
Downloaded from:
Usage Guidelines:
Please refer to usage guidelines at or alternatively
BIROn
-
B
irkbeck
I
nstitutional
R
esearch
On
line
Enabling open access to Birkbeck’s published research output
Trust in justice: why it is important for criminal policy,
and how it can be measured
Project Report
(Published draft)
http://eprints.bbk.ac.uk/4507
Citation:
© 2011 The Euro-Justis Project
Publisher version
______________________________________________________________
All articles available through Birkbeck ePrints are protected by intellectual property law, including copyright law. Any use made of the contents should comply with the relevant law.
______________________________________________________________
Deposit Guide
Contact: lib-eprints@bbk.ac.uk
Birkbeck ePrints
Birkbeck ePrints
Hough, M.; Sato, M. (2011) Trust in justice: why it is important for
criminal policy, and how it can be measured
European Institute for
Crime Prevention and Control, affiliated with the United Nations (HEUNI)
P.O.Box 444 FIN-00531 Helsinki Finland
Publication Series No. 70
Trust in justice: why it is important for
criminal policy, and how it can be measured
Final report of the Euro-Justis project
Editors Mike Hough and Mai Sato
Institute for Criminal Policy Research Birkbeck, University of London
June 2011
This book has been published thanks to the support of the European Commission, Directorate-General for Research, 7th Framework Programme for Research – Socio-economic Sciences and Humanities (grant agreement no. 217311).
The information and views set out in this report are those of the authors and do not necessarily reflect the official opinion of the European Communities. Neither the European Communities institutions and bodies nor any person acting on their behalf may be held responsible for the use which may be made of the information contained therein.
Copies can be purchased from:
Academic Bookstore P.O. Box 128 FIN-00101 Helsinki Finland
Website: http://www.akateeminen.com
ISBN 978-952-5333-84-8 ISSN 1799-5590
ISSN-L 1237-4741
CONTENTS
Acknowledgements...5
1 Introduction...6
Mai Sato and Mike Hough
2 Why measure trust in justice?...10
Mike Hough and Mai Sato
3 How to measure trust? Survey measures of trust in justice...18
Mike Hough
4 Results of the pilot surveys...24
A. Overview: Trust in justice, procedural and distributive fairness
and fear of crime...24
Todor Galev and Maria Yordanova
B. Exploring trust in justice and fear of crime through media
consumption ...30
Zsolt Boda, Gergő Medve-Bálint and Gabriella Szabó
C. Testing scales of public trust and police legitimacy...36
Jonathan Jackson and Jouni Kuha
D. Ethnic minorities and trust in criminal justice: report on the French pilot...43
Guillaume Roux, Sebastian Roché and Sandrine Astor
Appendix 1: European Social Survey (ESS) Questionnaire...48
Appendix 2: Euro-Justis Pilot Questionnaire...59
ACKNOWLEDGEMENTS
Thanks are due to a large number of people who have helped the Euro-Justis team over the course of this project. Firstly, of course, we are very grateful to the European Commission for funding the research. We would also like to thank the two Project Officers from the Commission who have worked with us over the life of the project: Dr Ian Perry, who oversaw the beginning of the project, and Dr Manuela Alfé, who saw it through to completion. Their support and advice was especially valued.
We owe a great debt of gratitude to our External Expert Group, who generously gave their time and advice to the project. The Chairman of the EEG was Professor Julian Roberts, and its members were Gordon Barclay, Kjell Elefalk, Professor Sir Roger Jowell, Dr. Balazs Kiss, Professor Helmut Kury, Dr. Tapio Lappi-Seppälä, Professor Jacques de Maillard, Dr. Jan de Keijser, Professor Betsy Stanko, Professor Stephan Parmentier, Andreas Pottakis, Ruslan Stefanov, Professor Jyrki Tala, Daniela Stradiotto, Dr. Emil Tsenkov and Alison Walker.
We would also like to thank various colleagues who committed time and energy to the project, for example by attending our conferences and presenting papers at them, and by commenting on, or co-authoring or contributing papers. Special thanks are due to Professor Tom Tyler of New York University and Professor Wesley Skogan of Northwestern University.
The Euro-Justis project was greatly strengthened by the success of our bid for space on the fifth (2010) European Social Survey, which provided us with an international survey in which to trial the suite of survey questions which were designed under the aegis of Euro-Justis. We would like to thank the ESS team for accepting our bid, and – equally important – for the considerable support and constructive criticism that they provided in helping us refine and improve our suite of questions.
Finally, it is worth saying that a large collaborative project such as this requires the goodwill and mutual trust of a large team of researchers. It has been a privilege to be the coordinating members of the Euro-Justis partnership, and to have had such supportive, industrious and creative colleagues over the last 40 months.
Professor Mike Hough Dr. Mai Sato
1 INTRODUCTION
By Mai Sato and Mike Hough
By any standards, Europe faces a number of challenges over the next few decades. We clearly face a period of economic turbulence, triggered in the short term by the 2008 banking crisis and in the longer term by changes in the centre of gravity of the globalised economy. Whilst these changes may present rich opportunities to many Europeans, it will very probably make life harder for the poorest groups. With equal certainty we can anticipate in the middle term forms of climate change with unknown implications. These developments will bring with them rapid social change and – possibly – large-scale migration within and into Europe.
All of these changes are likely to pose increased rather than reduced problems of social order. Strained economies are likely to result in less social justice and in greater income disparities. It may be that the factors that have driven crime down in many industrialised countries over the last decade and a half will offset these criminogenic trends. But it would be very complacent simply to assume that this will prove the case. Any intelligent criminal policy should anticipate the worst – and be grateful if the predictions fail to come true.
The Euro-Justis project
The ideas and research findings presented here derive from the Euro-Justis project, funded under the European Commission’s 7th Framework Programme for Research. The project had nine partners in seven EU member states. 1 Its remit was to develop social indicators on trust in justice to enable evidence-based public assessment of criminal justice across Europe. At the heart of the project was an effort to create a standardised system of scientific survey indicators that can be used by member states to measure confidence in criminal justice, and to support the development of more inclusionary criminal justice policies designed to secure commitment to the rule of law and thus compliance with the law. From 2008 to 2011, the Euro-Justis project examined the need for such indicators by interviewing criminal justice professionals across Europe (Jokinen et al., 2009);2 developed scientific survey-based indicators on trust in justice, including a set of questions selected for the European Social Survey which covers 28 countries; collected country-level contextual data to appreciate nationally specific issues to interpret the survey measures; and fielded and validated those indicators in several European countries.
The ‘trust in justice’ module of the European Social
Survey (ESS)
A significant outcome of the Euro-Justis project was a successful bid to the ESS for space in its fifth sweep, conducted in 2010. The ESS, conducted with support from the EU but with fieldwork funded by individual member-states, consisted of a core questionnaire and variable modules. Academic researchers are invited to bid for space in these modules, and members the Euro-Justis team bid successfully for a 45 question module, which in essence was a core set of Euro-Justis questions (see Jackson et al., 2011). The end result is that we have not only developed a suite of questions on trust in justice, but have already fielded these questions in a large social survey carried out to high standards in at least 28 European countries. At the time of writing data were due to be available in the autumn of 2011. The total sample will include around 40,000 adults.
1 Euro-Justis - Scientific Indicators of Confidence in Justice: Tools for Policy Assessment
(duration: 1/3/2008-31/6/2011) is a Specific Targeted Research Project funded under the Socio-Economic Sciences and Humanities Programme of the 7th Framework Programme for Research of the European Union, Thematic Priority 6 – Socio-economic and scientific indicators. Project website: www.eurojustis.eu
2 JUSTIS Project Working Papers Review of Need: Indicators of Public Confidence in
Whilst we regard this development as a very positive one, it meant that the Euro-Justis project did not develop in precisely the way that was envisaged when we submitted our proposals. The project ended up yielding – directly or indirectly – a number of different ‘products’:
A small number of ‘headline indicators’ for use in existing surveys
A free-standing set of 45 survey questions used in the ESS, which provide key measures of trust in justice, perceptions of legitimacy, cooperation with justice and compliance with the law
A suite of around 166 questions (including the ESS items) that provides exhaustive coverage of trust, legitimacy, cooperation, compliance, fear of crime and punitivity.
The set of core ESS questions were piloted exhaustively as part of the ESS developmental process. The larger set of 166 items was also piloted as part of the Euro-Justis project in Bulgaria, Italy and Lithuania; a parallel survey was mounted in the Czech Republic. Finally, an adapted questionnaire was piloted in France, designed specifically to examine the relationships between police and ethnic minorities.
The shape of this report
This report marks the completion of the Euro-Justis project. It does three things. First, Chapter 2 sets out a conceptual framework – or a set of ideas – about ‘trust-based justice’, arguing that building trust in justice ought to be a central priority for governments across Europe. It explains why we believe it is important to use indicators of public trust in justice as a barometer for testing the state of criminal justice systems across Europe.
Chapter 3 proposes practical ways in which member states can and should measure public trust in justice. It summarises the concepts that are important to measure, and presents the way that we think measurement is best done.
References
Jackson, J., Bradford, B., Hough, M., Kuha, J., Stares, S. R., Widdop, S., Fitzgerald, R., Yordanova, M. and Galev, T. (2011) ‘Developing European
Indicators of Trust in Justice’, European Journal of Criminology. Vol 8No.
4: 267–285.
Jokinen, A., Ruuskanen, E., Yordanova, M., Markov, D. and Ilcheva, M. (2009) JUSTIS Project Working Papers Review of Need: Indicators of
Public Confidence in Criminal Justice for Policy Assessment. Helsinki:
2
WHY MEASURE TRUST IN JUSTICE?
By Mike Hough and Mai Sato
Europe has enjoyed a half-century of unprecedented prosperity and tranquility. This prosperity has brought most Europeans lifestyles of comfortable consumerist individualism. Over the last thirty years it has also created widening income disparities in many countries, with a minority of socially excluded people living on very low incomes. One of the by-products of these trends at the end of the last century was rising crime. However, crime peaked in most member states in the mid-1990s, and trends since have been generally downward. Reasons probably include the economic upturn enjoyed by many countries in the 1990s, better crime prevention and security design, and better policing.
It is probably over-optimistic to expect these downward trends to continue into the middle of the century. Members States and EU institutions should probably anticipate growing rather than receding threats to social order. Europe clearly faces what at best may prove a short-term period of economic turbulence, triggered by the 2008 banking crisis; at worst this could turn into a serious challenge to the Euro-zone economies. Those countries with fragile economies have little choice to agree to swingeing public expenditure cuts, and it is hard to see how these cuts can avoid fuelling social inequality.
Other trends will exacerbate these processes. Globalisation and increasing competition, for example from the South Asian and Chinese economies, are driving down the wages of the less affluent sectors of the European population. Migration within Europe and immigration into Europe constitute further threats to social stability. Maintaining commitment to the rule of law will be a growing challenge as populations become ethnically and culturally more diverse. The economies of EU Member States could also be destabilised by the impact of climate change and even by viral pandemics. The precise impact of these threats is unknown, but they are all likely to increase income disparities, to amplify the social exclusion of the poorest segments of the population and thus to intensify problems of crime and order maintenance.
emergence of forms of penal populism whereby politicians choose criminal policy as the battleground upon which they can fight with their opponents to demonstrate their competence and tough-mindedness. Media news values make crime a saleable commodity, and the media are very ready to construct crises which politicians can vie to solve (cf. Roberts et al., 2002). This is not to argue that strategies that are “tough on crime” are redundant, but to place them as the centrepiece of justice policy could prove a fundamental misjudgement.
There is a growing body of evidence that coercing compliance with the law is a less efficient route to social order than securing normative compliance – that is, getting people to accept the rule of law because they believe it is right to do so (cf. Tyler, 2006, 2010, 2011; Hough et al., 2010). One can differentiate between inclusionary strategies that are premised on economic inclusion to achieve social justice and those that aim to demonstrate that the institutions of justice are themselves fair and just. It is the latter group of strategies, based on theories of procedural justice, with which the Euro-Justis project is concerned. Let us now consider in more detail these theories of normative compliance, and in particular procedural justice theories.
The conceptual foundation of Euro-Justis: theories of
normative compliance
Classical criminology and common-sense thinking about crime tend to appeal to a simple model of crime control (cf. Hough, 2007) in which:
people are rational-economic calculators in deciding whether to break the law;
a deterrent threat is the main weapon in the armoury of criminal justice;
offenders – and thus crime rates – are responsive primarily to the risk of punishment, which can vary on dimensions of certainty, severity and celerity;
increasing the severity of sentencing, and extending the reach of enforcement strategies, are therefore seen as sensible responses to crime; and,
offender rights tend to be seen as a constraint on effective crime control.
within the boundaries of the simple crime control model described above, finding solutions to crime control that are designed to secure instrumental compliance.
Questions about compliance, by contrast, yield answers that recognise the interplay between formal and informal systems of social control, and in particular the normative dimensions in people’s orientation to the law. Normative compliance with the law occurs when people feel a moral or ethical obligation or commitment to do so. Theories of normative compliance posit a range of mechanisms by which people acquire – or lose – norms of acceptable behaviour.
It is helpful to think of a broad family of compliance theories which can be traced back to Durkheimian and Weberian thinking about the roots of social order. There are two distinct sides to the family. On the one hand, there has been increasing (or perhaps, more accurately, rediscovered) interest over the last two decades in theories about the relationship between ‘political economy’ (cf. Reiner, 2007) and crime, which trace the connections between the social distribution of wealth and attachment to – or detachment from – social norms. The emergence of neo-liberal economic policies is obviously implicated in the renewed academic interest. The idea that high levels of income inequality fuel crime is almost a criminological truism, with a long sociological pedigree in strain theory.
Theories of institutional anomie (cf. Messner and Rosenfeld, 2001, 2010) serve as good current variants on this line of thought. According to these, rapid transitions towards the values of free-market economies can unbalance and weaken traditional normative systems of social control. Over the last two decades, establishing the relationships between forms of inequality and detachment from social norms has become less a matter of speculative sociology and increasingly an empirical issue. There is a growing body of comparative research looking at relationships between economic inequality, trust in institutions and crime rates (e.g. Lappi-Seppälä, 2011; Cavadino and Dignan, 2005).
On the other hand, there are compliance theories about the impact on societal norms of the institutions of formal social control. Some of these are clearly in the Durkheimian tradition. For example, Beetham (1992) argues that the legitimacy of institutions of justice derives at least in part from their alignment with the moral values of the policed. The work of Robinson and Darley is also in this tradition. Thus Robinson and Darley (1997) argue that if the law’s potential for building a moral consensus is to be exploited, the sentence of the court must be aligned at least to some degree with public sentiments. These ideas are sometimes called intuitive justice theories.
If Robinson and Darley argue the need for judicial outcomes to be aligned with public values, procedural justice theorists like Tyler (e.g. 2006, 2010, 2011) emphasise the need for justice institutions to pursue fair and respectful
institutional legitimacy and compliance with the law. This is the central hypothesis in procedural justice theory.
The two broad families of compliance theory – with their different emphasis on securing social justice and a fair system of justice – are obviously compatible. Social justice and fairness in the justice system are both likely to be preconditions for a well-regulated society. However, only the second family carries direct implications for policy and practice within policing and criminal justice – and the most direct implications flow from procedural justice theories. Many criminologists would like to see the crime-preventive dividend of a fairer distribution of income and wealth, but for police chiefs and politicians with explicit responsibility for crime control, these arguments are inevitably subsidiary to ones about what they should do in the ‘here and now’ of improving systems of justice.
Procedural justice theories
Procedural justice theories are especially useful in making sense of issues around trust in the police, beliefs about police legitimacy and public compliance and cooperation with the law. Legitimacy is a central concept here. There are two uses of the term. Political philosophers often talk of political systems as achieving legitimacy when they meet various agreed objective criteria, to do with acceptance of democratic norms and observance of human rights. Assessments of this sort also involve subjective judgements, of course, about the nature of the ‘good or just society’. But there is a separate set of questions about the ability of a criminal justice system to command legitimacy in the eyes of the public - whether the policed see the police as legitimate. These questions are open and empirical, and require examination of public attitudes, values, behaviours and beliefs.
Perceived legitimacy exists when the policed regard the authorities as having
earned an entitlement to command, creating in themselves an obligation to obey the police. If people willingly offer their obedience to systems of authority that command legitimacy, questions about the ‘drivers’ of legitimacy become of central policy importance. Procedural justice theories propose that perceived legitimacy flows from public trust in institutions; and that public trust is at least in part a function of the quality of treatment that the public receive from justice officials. Thus if the police treat people fairly and respectfully, and if this treatment is aligned with public perceptions of morality, they will be regarded as having legitimate authority, and will be better able to command compliance and cooperation.
Penal populism and procedural justice
political impatience with what is seen as a debilitating culture of human rights. There has been a marked coarsening of political and media discourse about crime and justice (cf. Lappi-Seppälä, 2011). It seems fairly clear that there are structural pressures on politicians – which are intense in some forms of ‘adversarial’ two-party democracies – to offer tough, no-nonsense, populist solutions to crime problems (cf. Roberts et al., 2002). The difficulty with this is that no-nonsense solutions often tend to be genuinely nonsensical, premised on the faulty assumption that persistent offenders adopt the form of homo
economicus, fine-tuning their criminal behaviour in the face of varying levels
of deterrent threat. Criminal justice politicians risk getting trapped within these over-simplified economic theories of instrumental compliance. This is not to argue that instrumental strategies for securing compliance are redundant; but to place them as the centrepiece of justice policy is a fundamental misjudgement. Procedural justice theorists (e.g. Tyler, 2009, 2011) argue that strategies of instrumental compliance are costly and ineffective. The argument is that motive-based, voluntary self-regulation based on perceptions of the legitimacy of the law is more effective, more economical and more durable over time. According to the procedural justice perspective people are willing to accept decisions and outcomes that they do not regard as being in their personal best interests – provided that they consider justice institutions and officials to be wielding legitimate authority. This points to the possibility of creating a system of social control which is based upon the willing consent and cooperation of citizens, rather than upon the threat of punishment. If such a vision is to be even partly achieved, it will be important to nudge political and public debate towards a greater appreciation of the normative dimension in regulating behaviour. For liberally minded reformers a particular attraction of procedural justice theories is that they promise to resolve the tension that is often thought to exist between effective crime control and the respecting of people’s rights3. They point to the conclusion that fair, respectful and legal behaviour on the part of justice officials is not only ethically desirable, but is a prerequisite for effective justice.
Trust as an organising concept in justice policy
Our analysis shows that few member states currently place the sort of emphasis on trust in justice that we regard as necessary (cf. Jokinen et al., 2009). If policy in member states attends more closely to issues of public trust in the criminal justice system, this should result in systems that are both more just – in the broadest sense – and more effective in tackling crime. If member states are to achieve balanced and effective crime policies, they need to pay closer
3 For more radically minded reformers, of course, procedural justice approaches to crime
attention to issues of trust and legitimacy. If they ignore these factors, their criminal policies risk becoming skewed towards short-term crime control strategies at the expense of ensuring that the justice system commands legitimacy and that citizens feel safe and secure. Measures of trust in justice and the legitimacy of legal authorities can be used to inform careful and long-term policies to foster public compliance instead of short-long-term and 'electioneering' strategies that exploit public feelings for political gain.
Too often today, policy makers tend to base their policy decisions upon an assumed "public dissatisfaction" or "public concern" on various matters of justice, in the absence of any reliable scientific measure of confidence either at the European or country level. As a result, policy is not driven by scientific and transparent measurement of public attitudes to justice. Member states need well-designed indicators of public trust and institutional legitimacy if they are to devise, track and evaluate criminal justice policies. If governments lack proper indicators and scientific evidence on the trajectory of trust and legitimacy over time, they will be unable to measure the impact of such policy. Trust and legitimacy indicators are vital for better formulation of the problems of public confidence, and more effective monitoring of changes in public confidence in response to policy innovation.
References
Beetham, D. (1991) The Legitimation of Power. Basingstoke: Palgrave
Macmillan.
Bottoms, A. E. (2001) ‘Compliance and Community Penalties’, in A. E. Bottoms, L. Geslthorpe and S. Rex (eds) Community Penalties: Change and
Challenges. Cullompton: Willan Publishing.
Cavadino, M. and Dignan, J. (2005) Penal Systems: A Comparative Approach.
London: Sage.
Hough, M., Jackson, J., Bradford, B., et al. (2010) Procedural Justice, Trust and Institutional Legitimacy. Policing: A Journal of Policy and Practice
04(3): 203−210.
Jackson, J., Bradford, B., Hough, M., Kuha, J., Stares, S. R., Widdop, S., Fitzgerald, R., Yordanova, M. and Galev, T. (2011) ‘Developing European Indicators of Trust in Justice’, European Journal of Criminology. Vol 8No. 4: 267–285.
Jokinen, A., Ruuskanen, E., Yordanova, M., Markov, D., and Ilcheva, M. (2009) JUSTIS Project Working Papers Review of Need: Indicators of
Public Confidence in Criminal Justice for Policy Assessment. Helsinki:
HEUNI (available from: http://www.eurojustis.eu/fotoweb/34.pdf).
Lappi-Seppälä, T. (2011) ‘Explaining Imprisonment in Europe’ European Journal of Criminology Vol 8, No 4: 303–328.
Messner, S. and Rosenfeld, R. (2001) An Institutional-Anomie Theory of Crime. In R. Paternoster & R. Bachman (Eds.), Explaining criminals and
crime. Los Angeles: Roxbury.
Messner, S. and Rosenfeld, R. (2010) Institutional-Anomie Theory: A macro-sociological explanation of crime. In A. J. L. Krohn & G. P. Hall (Eds.),
Handbook on crime and deviance. New York: Springer Science Business
Media.
Reiner, Robert (2007) Law and order : an honest citizen’s guide to crime and control. Polity, Cambridge.
Roberts, J.V., Stalans, L.S., Indermaur, D. and Hough, M. (2003) Penal
Populism and Public Opinion. Findings from Five Countries. New York:
Oxford University Press.
Roberts, J. V. and Hough, M. (2005) Understanding Public Attitudes to
Criminal Justice. Maidenhead: Open University Press.
Robinson, R. H. and Darley, J. M. (1997) ‘The Utility of Desert’, Northwestern
University Law Review, Vol. 91: 453–499.
Tyler, T.R. (2004) Enhancing Police Legitimacy. The Annals of the American Academy of Political and Social Science. 593: 84−99.
Tyler, T.R. (2006) Why People Obey the Law (second edition). New Haven: Yale University Press.
Tyler, T.R. (2010) Why People Cooperate? The Role of Social Motivations.
New Jersey: Princeton University Press.
Tyler, T. R. (2011) ’Trust and legitimacy: policing in the US and Europe’,
3
HOW TO MEASURE TRUST? SURVEY
MEASURES OF TRUST IN JUSTICE
By Mike Hough
This chapter presents a short guide on how to use the survey indicators developed by the Euro-Justis project.
Survey indicators for policy
According to Land (1983), there are different types of social indicators. He uses the terms “normative welfare indicators” to refer to indicators which focus on objective measures of welfare, subject to the interpretation that there is a
right direction to judge whether things are better – such as crime or health.
There are also “satisfaction indicators”, which measure psychological satisfaction – such as happiness – instruments that ascertain the subjective reality in which people live.
Applying this typology of social indicators to crime, most member states assess the success of their crime policies by reference to levels of crime, usually measured by police statistics or by national surveys of victimisation or the International Crime Victims Survey. In other words, normative welfare indicators are being used, under the assumption that lower crime rates and victimisation rates are the signs of a better society. While these indicators are important measures, the Euro-Justis project advocates rather greater use of subjective – or perceptual – indicators, to assess criminal policy and practice against criteria of public trust.
How to field Euro-Justis survey indicators
Most policy indicators, in criminal justice as elsewhere, are derived from administrative records – the data created by bureaucracies in the course of their everyday work. Survey indicators necessarily require a special data collection process. The options are:
where the jurisdiction in question is included in the fifth European Social Survey (ESS), to use this source of data.
to mount a free-standing survey
to insert questions in an established survey instrument, such as a national crime survey
Which option to select depends on the depth and breadth of coverage that is desired. For those countries that took part in the fifth ESS, the best and cheapest option is to draw on these results. It will be possible either to use published results – when these become available in 20124 – or to commission researchers to carry out bespoke analysis.
The key advantage to any jurisdiction of using the ESS to assess public trust in justice is that of comparability: it is possible to make sense of country-level findings by comparing them with those of similar jurisdictions. The biggest limitation is that trend data cannot be assured: there is no prospect of regular
repeats of the module on trust in justice, and an uncertain prospect of any
repeat of the module.5 However, it would be possible to secure trend data by repeating the module in another survey.
For those countries that did not participate in the fifth ESS, the options are to mount a free-standing survey, or to insert questions in a pre-existing survey. The full suite of questions developed by Euro-Justis (166 items in total, reproduced as Appendix 2) would require a free-standing survey in view of its length. It would take around 45 minutes to complete, which is not far short of the maximum length of interview which respondents will tolerate. This is also the most costly option. The costs of a probability survey of 1,000 people will vary from country to country, ranging from €15,000 to €50,000 or more.
If less in-depth coverage was required, it would be possible to insert a version of the ESS module on trust in, for example, a national crime survey. In piloting, the module took between 15 and 20 minutes (on average) to administer, and the final version (reproduced as Appendix 1) was slightly shorter. For example, a Japanese university has recently mounted a survey in Japan that combines the questionnaire of the International Crime Victims Survey with the ESS trust module. It would also be possible to mount a short survey comprising solely of the ESS module and the necessary demographic data.
Those jurisdictions who do not wish to go for any of these options could consider including a few key questions in a government or commercial omnibus survey. Leaving aside ESS analysis, this is the cheapest option.
Which questions to include?
The Euro-Justis suite of questions included public assessments of fairness, effectiveness and value-expressive aspects, contact with the police, intention to
4 The ESS data are placed in the public domain when they have been checked and edited, and
any academic institution may analyse them. The Euro-Justis team will be doing so, as will others.
5 It would be necessary to bid competitively for space in the ESS questionnaire at some point in
support (e.g. reporting crimes, giving evidence in court), knowledge about the criminal justice system, and perceived legitimacy. The questions were designed in part to enable analysis to identify the relationships between different concepts relating to trust in justice. Table 3.1 summarises these concepts.
Table 3.1 Overview of key Euro-Justis indicators
CONCEPT SUB-CONCEPT
Trust in the police Trust in police effectiveness
Trust in police distributive fairness Trust in police procedural fairness
Trust in the courts Trust in court effectiveness
Trust in court distributive fairness Trust in court procedural fairness
Perceived legitimacy of the police Obligation to obey the police
Moral alignment with the police
Perceived legitimacy of the law and the courts
Obligation to obey the law and court decisions
Moral alignment with the courts
Competing motives to comply with the law
Perceived risk of sanction -
Personal morality -
Compliance with the law -
Cooperation with the police and courts -
Contact with the police Police-initiated positive experience
Police-initiated negative experience Perceived legality of police and court
action
-
Punitive attitudes -
Anxiety about crime -
Media consumption -
Which questions to include will depend on policy priorities. If an overall indicator of trust in institutions is all that is required, then the top-level indicators that we recommend should take the following form:
Taking into account all the things the [police/courts] are expected to do, would you say they are doing a good job or a bad job? Choose your answer from this card. [Very good job/Good job/Neither good nor bad job/Bad job/Very bad job]
it would be necessary to ask the battery of questions measuring trust in police or court effectiveness, distributive fairness and procedural fairness. As each sub-concept in our suite of questions is usually measured by a scale derived from three survey items, this would involve asking 18 questions – if both the police and courts were covered – and more, if people were asked about prosecutors, probation and prisons. We have proposed that trust is the key concept for which indicators are needed, on the basis that improved trust builds legitimacy, compliance with the law and cooperation with justice. Some jurisdictions may regard it as something of a luxury to have indicators of these factors, additional to measures of trust. On the other hand, we would suggest that it is important for policy fully to assess the various factors that promote compliance with the law and cooperation with justice. So indicators of trust may be the top priority, but it is also highly desirable to include indicators of institutional legitimacy.
Presenting indicators
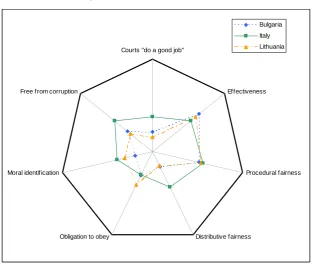
Figure 3.1 Spidergram presenting selecting police indicators from pilot surveys
Police "do a good job"
Effectiveness
Procedural fairness
Distributive fairness Obligation to obey
Moral identification Free from corruption
Bulgaria Italy Lithuania
Figure 3.2 Spidergram presenting selecting court indicators from pilot surveys
Courts "do a good job"
Effectiveness
Procedural fairness
Distributive fairness Obligation to obey
Moral identification Free from corruption
Bulgaria Italy Lithuania
[image:24.595.100.413.420.685.2]References
4
RESULTS OF THE PILOT SURVEYS
This chapter falls into four main sections, authored by team members in four of the Euro-Justis partner institutions. The results are preliminary, but they give a good sense of the emerging findings. Fuller results will be presented in academic journal articles over the coming months.
A. Overview: Trust in justice, procedural and
distributive fairness and fear of crime
By Todor Galev and Maria Yordanova
This section presents headline findings on levels of trust in justice, perceptions of fairness and fear of crime for the three countries – Bulgaria (BG), Italy (IT), and Lithuania (LT) – in which the first wave of piloting was carried out.
Ratings in overall performance
[image:26.595.64.546.527.738.2]Consistent with findings in other countries, overall public confidence in police performance is much higher than in the courts in all three countries. Figure 4.1 shows differences between the three countries in responses to our ‘top-line’ item which asked in very general terms how good a job different justice institutions were doing. Italy had the highest positive ratings and the lowest negative ratings for both the police and the courts; Lithuania scored lowest and Bulgaria was in the middle.
Figure 4.1 Overall evaluation of police and courts performance
Overal evaluation ofthe courts (%) Overal evaluation ofthe police (%)
43,8
56,6 30,0
38,7 35,7
54,1
17,5 7,8
15,9
,0 10,0 20,0 30,0 40,0 50,0 60,0 BG
IT LT
Good job Neither good nor bad job Bad job
22,3
37,9 15,8
40,7 42,5
49,3
36,9 19,6
34,9
,0 10,0 20,0 30,0 40,0 50,0 60,0 BG
IT LT
Ratings of police effectiveness
Figure 4.2 shows the results of three more focused questions on police
effectiveness. Here respondents were mostly positive and a large proportion of
people in all three countries chose the positive end of the scale when asked how successful the police are in preventing crimes and in arriving at the crime scene when they are called. However, trust in the police effectiveness is much lower for catching burglars. These items invited scores on an 11-point scale, running from negative to positive. Italy’s ratings appear to be slightly higher than Bulgaria’s and Lithuania’s.
Figure 4.2 Police effectiveness (% selecting each point of the scale)
Based on what you have heard or your own experience how successful do you think the police are at preventing crimes in [country] where violence is used or threatened?
0,0 5,0 10,0 15,0 20,0 25,0 30,0 35,0
0 1 2 3 4 5 6 7 8 9 10
Bulgaria Italy Lithuania
And how successful do you think the police are at catching people who commit house burglaries in [country]?
0,0 5,0 10,0 15,0 20,0 25,0 30,0 35,0
0 1 2 3 4 5 6 7 8 9 10
Bulgaria Italy Lithuania
[image:27.595.115.512.513.673.2]0,0 5,0 10,0 15,0 20,0 25,0 30,0 35,0
0 1 2 3 4 5 6 7 8 9 10
Bulgaria Italy Lithuania
Ratings of police distributive fairness
[image:28.595.102.495.97.255.2]Ratings of trust in police distributive fairness were generally lower in all three countries as compared to the level of trust in police effectiveness. Two-thirds of the respondents considered the treatment by the police is affected mainly by people’s economic status, i.e. the respondents think the police treat rich people better in all of the countries under consideration (Figure 4.3). When race and the ethnic group are concerned, there are substantial differences among the countries. In Italy the majority of the people (54%) thought that police discriminated people based on race, while this is not the case in Bulgaria (40%) and Lithuania (23%). These results possibly reflect the differences among the countries in the composition of minority and migrant groups and their diversification according ethnicity and race. Lastly, irrespective of the differences between the political systems in the three countries, more than half of the respondents in each country sample think that police decisions are unduly influenced by pressure from political parties and politicians.
Figure 4.3 Trust in police distributive fairness (% agreeing with statement)
67,2
60,1
65,0 23,0
53,6
39,5 61,1
51,6
58,4
0,0 10,0 20,0 30,0 40,0 50,0 60,0 70,0 80,0
Bulgaria Italy Lithuania
Police decisions and actions are unduly influenced by parties and politicians
Different race or ethnic group treated worse
Ratings of procedural fairness
The majority of people in all three countries think that their police ‘often’ treat people with respect, make fair and impartial decisions and explain their decisions to people. Trust in police procedural fairness is the highest in Italy, scoring around 10 percentage points more than in Bulgaria and Lithuania. Ratings of police readiness to explain their decisions and actions when they are asked to do so are lower than for the other two items (Figure 4.4).
[image:29.595.175.500.323.546.2]The value of survey items of this sort lies in their scope for yielding comparative information over place or time. It is hard to say from a single ‘snapshot’ survey whether it is reassuring or worrying that, for example, six out of ten respondents in all three countries believe that the police ‘often’ treat people with respect – although in our view it ought to be a matter of concern that four out of ten respondents believe that the police are not very often respectful.
Figure 4.4 Perception on police procedural fairness
Based on what you have heard or your own experience how often would you say the police generally treat people in [country] with respect …
4,2 3,2 2,5
38,2 37,3 36,0
47,7 51,2 55,5
9,9 8,3
6,0
0,0 20,0 40,0 60,0 80,0 100,0
Bulgaria Italy Lithuania
About how often would you say that the police make fair, impartial decisions in the cases they deal with? Would you say… 4,7 3,6 4,3 43,1 36,1 44,0 45,5 53,0 49,6 6,7 7,4 2,1
0,0 20,0 40,0 60,0 80,0 100,0
Bulgaria Italy Lithuania
not at all often not very often often very often
And when dealing with people in [country], how often would you say the police generally explain their decisions and actions when asked to do so?
14,8 13,9 7,4 42,7 42,6 37,3 25,9 32,6 41,0 7,0 5,5 6,2 9,8 5,5 8,1
0,0 20,0 40,0 60,0 80,0 100,0
Bulgaria Italy Lithuania
not at all often not very often
often
very often
No one ever asks the police to explain their decisions
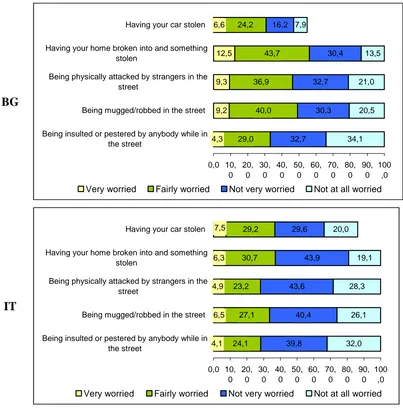
Fear of crime
As for fear of crime, the degree of insecurity is considerably higher in Lithuania than in Bulgaria and Italy. Particularly in Lithuania, the share of people who feel “very worried” about becoming a victim of different crimes is three to five times higher than in Italy and about two to three times higher than in Bulgaria (Figure 4.5).
neighbourhood compared to 21% in Italy and 15% in Bulgaria. At the same time, victimisation rates for burglary are similar in the three countries6 (11% in Bulgaria, 7% in Italy and 11% in Lithuania) with a higher proportion of Italians knowing about others who have been victimised in their neighbourhood in comparison to the other two piloting countries (52% in Italy, 43% in Lithuania and 32% in Bulgaria). The higher levels of fear of crime expressed in Lithuania were not accompanied by corresponding perceptions that this was affecting their quality of life. One can speculate that higher rates of crime on the one hand prompt anxiety about crime, but on the other hand that people get used to these feelings as a fact of life.
Figure 4.5 Fear of crime and insecurity (%)
BG 4,3 9,2 9,3 12,5 6,6 29,0 40,0 36,9 43,7 24,2 32,7 30,3 32,7 30,4 16,2 34,1 20,5 21,0 13,5 7,9 0,0 10, 0 20, 0 30, 0 40, 0 50, 0 60, 0 70, 0 80, 0 90, 0 100 ,0 Being insulted or pestered by anybody while in
the street
Being mugged/robbed in the street Being physically attacked by strangers in the
street
Having your home broken into and something stolen
Having your car stolen
Very worried Fairly worried Not very worried Not at all worried
IT 4,1 6,5 4,9 6,3 24,1 27,1 23,2 30,7 29,2 39,8 40,4 43,6 43,9 29,6 32,0 26,1 28,3 19,1 20,0 7,5 0,0 10, 0 20, 0 30, 0 40, 0 50, 0 60, 0 70, 0 80, 0 90, 0 100 ,0 Being insulted or pestered by anybody while in
the street
Being mugged/robbed in the street Being physically attacked by strangers in the
street
Having your home broken into and something stolen
Having your car stolen
Very worried Fairly worried Not very worried Not at all worried
LT 5,9 18,8 26,1 29,0 25,7 25,0 40,6 36,3 36,3 19,9 42,0 30,2 27,5 24,5 10,9 27,1 10,3 10,1 10,2 7,2 0,0 10, 0 20, 0 30, 0 40, 0 50, 0 60, 0 70, 0 80, 0 90, 0 100 ,0 Being insulted or pestered by anybody while in
the street
Being mugged/robbed in the street Being physically attacked by strangers in the
street
Having your home broken into and something stolen
Having your car stolen
Very worried Fairly worried Not very worried Not at all worried
Conclusions
These findings are intended simply to provide a ‘taster’ of the potential for comparative analysis of survey data of this sort. With only three countries to compare, the results are somewhat tantalising. The comparison of 28 countries which the ESS will shortly permit will enable us to present a much fuller comparative picture.
B. Exploring trust in justice and fear of crime through
media consumption
By Zsolt Boda, Gergő Medve-Bálint and Gabriella Szabó
This section explores the possible effects of media consumption on fear of crime, and on trust in criminal justice; and examines if there is a relationship between media consumption and punitive attitudes. The following hypotheses were formulated:
H1: Heavy consumption of tabloid press and tabloid television genres
is associated with a high level of fear of crime.
H2: Those who are interested in crime-related media content have less
trust in of the criminal justice institutions (e.g. CSI effect: people who watch fictional crime series develop unrealistic expectations about the work of criminal justice institutions).
H3: There is a relationship between media consumption and punitive
Analysis presented in this section presents the combined results from the three piloting countries – Bulgaria, Italy, and Lithuania, unless stated otherwise.7
Media consumption and fear of crime
Media consumption was measured by using the following indicators: preference for reading crime-related articles in newspapers; preference for reading crime-related articles in tabloid newspapers; watching fictional crime TV series (e.g. CSI); watching reality crime TV series (e.g. Cops); reading tabloids daily or weekly magazines; the length of time spent reading newspapers on an average weekday, the length of time spent watching TV on an average weekday.
Crime-related consumption – both fiction and non-fiction – as well as the extent of media consumption in general – were found to be associated with higher levels of fear.8 For example, those who read crime-related content in newspapers were more likely to report being “very worried” about being a victim of crime (8% compared to 3%) and less likely to claim that they were “not worried at all” (18% compared to 26%).9 We observed the same relationship concerning those respondents who liked to watch reality crime series on TV.10 14% reported to be “very worried” compared to 5% of those
who did not follow such series. Finally, the group of respondents who watched TV for more than three hours a day seems to be more concerned with being a victim of crime than those who spend less time in front of the screen. 44% of those who spend more than three hours a day watching TV were “very worried” or “fairly worried” compared to 37% of those whose daily TV consumption is between one and three hours and 34% for those who watch TV for less than an hour a day.11
Media consumption and institutional trust
Trust in the police
Examining the relationship between media consumption and trust in the police, the extent of media consumption was – surprisingly – associated with higher
7 Weights were applied to the dataset based on the US Census Bureau International Population
Database (data from 2010). We created a weight variable that weighted cases for age cohorts (below 30; 30–44; 45–59; 60–74; above 74), gender and population size.
8 Fear of crime was measured by creating an ordinal fear of crime index by combining four
questions (worry about being insulted or pestered by anybody while in the street or any other public place; being mugged/robbed in the street; being physically attacked by strangers in the street; and having your home broken into and something stolen), and defined by “very worried”, “fairly worried”, “not very worried” and “not at all worried”.
levels of trust.12 Longer time spent reading newspapers was associated with higher trust levels: 54 % of those who read newspapers for less than half an hour a day demonstrated some trust or high trust in the police compared to 72% of those who spend more than an hour a day with reading newspapers.13 A similar but even stronger relationship appears with time spent watching TV: while only 41% of those who watch TV for less than an hour have some trust or high trust in police, the corresponding figure is 61% for those who spend more than three hours watching TV.14 Focusing specifically on the content of media consumption, it was found that those who watched crime-related fiction series on TV were somewhat more likely to report the “highest trust” level towards the police (23%) than those who did not (15%).15 In addition, reading tabloid magazines and preferring crime-related content was also associated with greater trust in police. 20% of this group of respondents was classified as having the highest trust level in police compared to 14% of those who did not read tabloids.16
Trust in the courts
There were mixed results for trust in the courts: the amount of time spent on newspaper and TV consumption showed opposite associations.17 The more time one spent reading newspapers, the more likely it was that the respondent had a relatively high trust in courts: 62% of those who spent more than one hour reading newspapers had some or high trust in courts while this share was 49 % for those who spent even less time reading newspapers.18 On the other hand, those who watch more TV trust courts less: only 46 % of those who watch TV for more than three hours trust courts (some trust or high trust category) compared to 62% of those who watch it for less than an hour per
12 Trust in the police was measured by creating an ordinal trust in the police index by
combining four questions (whether the police are doing a good job or a bad job; whether the police generally have the same sense of right and wrong as I do; whether the police stand up for values that are important to people like me; and whether I generally support how the police usually act), and defined by “highest trust in the police”, “some trust in the police”, “low trust in the police” and “lowest trust in the police”.
13 χ2 = 41.303; df = 6; N = 2337; p < 0.001 14χ2 = 79.291; df = 6; N = 2342; p < 0.001 15 χ2 = 21.522; df = 3; N = 2342; p < 0.001 16χ2 = 19.315; df = 3; N = 2342; p < 0.001
17 Trust in the courts was measured by creating an ordinal trust in the courts index by
combining five questions (whether the courts are doing a good job or a bad job; whether the courts make mistakes that let guilty people go free; how often courts make fair, impartial decisions based on the evidence made available to them; how often say that judges in [country] take bribes; whether the courts generally protect the interests of the rich and powerful above those of ordinary people (reverse), and defined by “lowest trust the in courts”, “some trust in the courts”, “low trust in the courts” and “lowest trust in the courts”.
day.19 Although slightly above the set confidence level, reading tabloid newspapers still seems to have a non-negligible association with trust in courts: those respondents who read tabloid magazines seem to trust the courts more (56% of them fell in the some trust and high trust categories) than those who did not read tabloids (47%).20 Reading crime-related news was also just above our pre-defined confidence level, still, the variable offered an interpretable association: 49% of those who prefer reading crime-related content placed some or high trust in courts compared to a higher share, 56% of those who did not indicate such preference.21
Media consumption and punitive attitudes
Punitive attitudes were measured by two variables: the perceived need for harsher sentences by the courts; and the perceived need to make current sentencing practice harsher. As for the perceived need for harsher sentences, those who chose crime as their preferred topic to read and those who spent a longer time watching TV had punitive attitudes.22 Those who preferred to read crime-related content in press were more likely to agree (82%) that courts should punish criminals harsher than those who did not read crime-related content (75%). However, it is important to note that there seems to be a widespread consensus about the need for tougher punishments. Similarly, those who watched more TV (more than three hours a day) shared a greater consent for harsher sentences (83%) than those who watched TV for less than an hour per day (61%). Reading tabloid newspapers and preferring crime-related content to read produced the expected results: 81% of this group would have liked harsher punishments compared to 76% of the other group.23
As for the perceived need to make current sentencing practice harsher, the picture is much less clear. In general, the overwhelming majority of respondents agreed that sentences were too lenient. That said, those who spend more time reading the newspaper (more than an hour) were less punitive than those who spend less time reading the newspaper.24 For the amount of time
spent watching TV, those who spent least time watching TV (less than half an hour) were less punitive than those groups who spent longer time watching TV.
19χ2 = 22.516; df = 6; N = 1821; p = 0.001 20χ2 = 14.051; df = 3 ; N = 1821 ; p = 0.003 21χ2 = 14.662; df = 3; N = 1821; p = 0.002
22 Crime as the preferred topic to read (χ2 = 28.205; df = 2; N = 2515; p < 0.001); time spent
with watching TV (χ2 = 81.240; df = 4; N = 2515; p < 0.001). 23χ2 = 16.687; df = 2; N = 2527; p < 0.001
24 Time spent with reading newspapers (χ2 = 20.597; df = 4; N = 2348; p < 0.001); time spent
Trust in media and attitudes towards the police and courts
Shifting the focus from media consumption, this section examines the relationship between trust in the media and attitudes towards the police and the courts.25
Trust in media and trust in the police
Positive evaluation of the media was associated with higher trust in the police. Respondents who agreed with the statement that the media provided accurate, reliable and sufficient information on the topics they were interested in were more likely to demonstrate higher levels of trust in police.26 Similarly, those
who were satisfied with the quality of media were more likely to have higher trust levels in the police than those who were dissatisfied with media quality.27 Those who disagreed that the media simply reflected the views of the majority showed lower trust in police.28
Trust in media and trust in courts
Similarly, the respondents who agreed with the statement that the media provided accurate, reliable and sufficient information on the topics they were interested in seemed to trust the courts slightly more.29 The same association appeared between trust in courts and the statement on the satisfaction with the quality of media: respondents satisfied or at least neutral with the quality of media demonstrated higher levels of trust in courts.30 Those who agreed with the statement that the media reflected dominant political views were significantly less likely to belong to the group demonstrating the highest trust level towards the courts.31 However, at the same time they were no more critical of courts than the other groups. This is because their combined share in the “no trust” and “little trust” categories (48%) was just slightly above the combined share of the other two groups (47% of neutrals and 42 % of those disagreeing with the statement. The association was more straightforward for those who agreed that the media were biased towards business interests – they
25 There were five statements which examined the respondents’ evaluation of the quality of the
media: the media I read/watch provide accurate, sufficient and reliable information about the issues I am interested in; I am satisfied with the quality and content of media what I
read/watch; the media are biased towards dominant political views; the media are generally biased towards business interests; and the media simply reflect the views of the majority. Respondents were asked to choose from the following options: agree, neither agree nor disagree, disagree.
were also more likely to trust the courts.32 Respondents who did not agree with the statement that the media simply reflected the views of the majority were much more likely to report low or the lowest trust levels towards the courts.33
Conclusion
It is likely that the mass media are indeed an important factor in how people process and perceive the world; however, the results have demonstrated that identifying precisely the role media plays in shaping people’s minds and attitudes to crime and criminal justice is a complex task. From a series of
bivariate analyses, we found some evidence for H1 as heavy media
consumption seemed to be associated with higher levels of fear of crime. However, we were unable to verify H2: higher media consumption seemed to
be associated with greater trust in criminal justice institutions, including the finding that watching crime-related fiction on TV may build a positive image towards the police rather than developing unrealistic expectations about their work. We also found partial evidence that trust in the media and confidence in criminal justice institutions are associated with each other. Concerning H3, we
also found some evidence of association between greater media consumption and the presence of punitive attitudes. However, the survey data showed that in general, there was a very high level of punitive attitudes present among the majority of respondents and it was not possible to determine precisely how media consumption was influencing this.
All in all, we did not find substantial evidence for the existence of a direct, strong and homogenous media effect which explains variations in levels of fear of crime and trust in criminal justice institutions. Media consumption perhaps should be considered as the expression of identity and personality (“I am what I read/watch”; “I share the same media experience with the social group I choose to belong to”) rather than something shaping people’s identify. Fear of crime, for instance, can be fuelled by media content, but only for those who are already sensitive and receptive to crime-related issues. Future analysis should focus on factors that influence the respondents’ choice of preferred media context, such as their socio-economic background through the usage of multivariate analysis. While more detailed analysis is necessary, preliminary findings on predicting respondents’ fear of crime using multivariate analysis showed that media consumption plays a secondary role in explaining fear of crime, in comparison to other factors such as being more trusting of others, gender (being a woman), the experience of victimisation, and living in a large city which offered more explanatory power.
C. Testing scales of public trust and police legitimacy
By Jonathan Jackson and Jouni Kuha
In this section we assess the measurement properties of the scales of trust and legitimacy through a statistical analysis of data from the Euro-Justis pilot surveys. Many of the Euro-Justis measures are designed to form scales, and multiple-item survey scales are commonly analysed using latent variable models, which include such methods as linear factor analysis and structural equation modelling, latent trait (item response) models, and latent class models (for overviews, see Bartholomew and Knott, 1999; Bollen, 1989; McCutcheon, 1987, and Skrondal and Rabe-Hesketh, 2004). All of these operationalise the basic idea that the individual survey items are regarded as fallible measures of some directly unobservable (i.e. latent) construct, and that it is those latent constructs that are the main focus of interest.
Figure 4.6 Graphical representations of the types of models considered in the analysis.
Diagram (1) represents a model of complete measurement equivalence, where the distribution of the latent variable may vary between countries, but the measurement model for survey items as measures of the latent variable is the same in all countries. Diagram (2) represents partial non-equivalence where the measurement model of Item 3 varies between countries. The arrow labelled (a) represents a direct effect of country on the average level of the Item, i.e. an effect on the intercept term of the measurement model. The line marked (b) represents a situation where, furthermore, the loading of the latent variable in the measurement model depends on the country.
(1)
Latent Variable
Country
Item 2 Item 3 Item 1
(2)
Latent Variable
Country
Item 2 Item 3 Item 1
(b) (a)
Latent variable models can be used to examine cross-national comparability of survey measurement, when constructs are measured using multiple indicators. Suppose ij denotes the value of a single latent variable for respondent j in country i, and let Yijk denote the value of survey item k for that respondent.
Suppose that items k=1,…K are all measures of (in our examples K=3). In all of the models, we make the following assumption about the latent variable that
ij
is normally distributed with mean
(i)and variance
(i). (1)The measurement model is a model for the items Yijk given the latent variable
ij
. We will consider different possibilities for this model. The simplest of them states that
ijk ij k k ijk
Y
(2)for all items k=1,…K. Here ijk is a normally distributed random variable with
mean 0 and variance kk. All of the parameters k,k, and kk of this model
are the same in all of the countries. The measurement is then said to be fully equivalent across the countries. This case is represented by diagram (1) of Figure 4.6, where the equivalence is indicated by the fact that the diagram contains no arrows directly from country to the survey items.
If any parameters of the measurement model do vary between countries, the measurement is not fully equivalent. Equivalence is “partial” if it holds for some, but not all, the items. For example in diagram (2) of Figure 4.6, measurement of item 3 is equivalent. We will consider two forms of non-equivalence, depending on which parameters of the measurement model it affects. In the first, only the intercept terms k may vary between countries, so
that ijk ij k i k ijk
Y
( )
(3)
for one or more items k. In Figure 4.6, this “direct effect” from country to an item is represented by the arrow labelled (a). The second possibility is that both the intercepts and the loadings k may vary, so that for some items
ijk ij i k i k ijk
Y
( )
()
(4)
The variation in the loadings can be thought of as an interaction between country and the latent variable in the measurement model; it is represented by the line labelled (b) in Figure 4.6. In both models (3) and (4) we assume that the measurement variances kkare the same across countries, but other choices
for them are also possible.
A summary of the results of our analyses is given in Table 4.1 (see page 40). We examined one item at a time. As an example, consider the police effectiveness item EFF3, which is shown third in Table 4.1. A model of full equivalence was fitted for the three items for each construct, and with one of the other items (here EFF1) as the anchor item. This is the model given by equations (1) and (2), and is labelled “Equivalence” in the table. The estimates of the intercepts (i)and loadings (i)
k
of the measurement model for item EFF3 are shown in this row of the table, separately for Italy, Lithuania and Bulgaria. For the equivalence model, these are by definition equal for the three countries. Estimates of the rest of the parameters are not shown in the table.
equivalence model (2) holds for the other two items). Here the intercept for EFF3 is 5.721 for Bulgaria and 5.989 for Lithuania, but 5.160 for Italy. Finally, the row labelled “Interaction” shows estimates when model (4) is used for the item being tested, i.e. when both the intercept and slope of that item vary by country. These three models are then repeated for the other three constructs. The different models for each item are then compared using standard statistical likelihood ratio (LR) tests (see Agresti and Finlay 2009, S. 15.3). This test always compares a pair of models, where one model is a constrained version of the other. Three comparisons are considered here: between the Equivalence and Direct-effect models; between the Direct-effect and Interaction models; and directly between the Equivalence and Interaction models. The P-values of these tests are shown in Table 4.1. A small P-value indicates that the less constrained of the two models fits substantially better than the more constrained one, and a large P-value that the models are not significantly different.
For example, in the comparison of the Equivalence and Direct-effect models for item EFF2 we have P=0.276, which indicates that the less constrained Direct-effect model does not fit significantly better than the more constrained Equivalence model. For EFF1 we have P<0.01 for the same comparison, so the opposite conclusion is reached. In other words, when the intercept parameters of the measurement model of an item are allowed to have different values in the three countries (while keeping the measurement models of the other two items for the same concept the same across countries), their difference is statistically significant for EFF2 but not for EFF1. The measurement is cross-nationally equivalent in this respect for EFF2 but not for EFF.
Lessons drawn
For the two trust scales we find evidence of non-equivalence in the intercepts of the measurement models between the countries, but not their loadings between the countries. In particular, we find two intercepts vary between countries, with inspection of the findings for trust in police effectiveness indicating that people in Lithuania tend to think that the police are slightly less effective at preventing violence (conditioning on their value on the latent variable), compared to people in Bulgaria or Italy. Compare the intercepts of 5.147 in Lithuania, 5.338 in Bulgaria and 5.503 in Italy (Table 4.1), where the indicators range from 0 to 10). Moreover, people in Italy tend to think the police are slightly less effective at arriving at the scene of a violent crime, compared to Bulgaria or Italy (intercepts of 5.169 in Italy, 5.721 in Bulgaria and 5.989 in Lithuania).