2417
PERFORMANCE INCREMENT OF HIGH SCHOOL
STUDENTS USING ANN MODEL AND SA ALGORITHM
ANAS BLASI
Assistant Professor, Mutah University, Department of Computer Science, Jordan
ABSTRACT
In this study, Artificial Neural Network (ANN) model has been used for modeling and design of students’ grades in high school level to predict their grades and increase their performance depends on four factors: grades average of ninth level, grades average of tenth level, grades average of eleventh level, and the average of studying hours per day. To do so a Neural Network has been designed. The input parameters were the grades average of ninth stage, grades average of tenth stage, grades average of eleventh stage, and average studying hours per day. One hidden layer was considered with ten neurons. The output layer is Grades average of high school level. One hundred data points were considered to train the network and calculate the weights. After that, the results of ANN model have been used by Simulated Annealing (SA) optimization algorithm to maximize the students’ grades in high school level. MATLAB software was used to do the implementation part. The main goal of this study has been achieved by predicting high school students’ grades, which can help in increasing the students’ performance in this level of education.
Keywords: Artificial Neural Networks, Back Propagation Network, Simulated Annealing, Data Mining
1. INTRODUCTION
Education system considered as one of the most important systems that contributes to the enhancement of any country in the world, and in most social, economic and cultural areas. By understanding the concept of knowledge, it can be used as a means to improve life in all aspects, particularly economic [1]. From this point of view, developing new methods of education that cope with continued development in all other fields is necessary.
In fact there are a lot of challenges and difficulties facing this goal, one of them is the difficulty to predict levels of student performance and grades. These predictions are particularly difficult and important in high school stage because this stage could be considered the most important stage for students since it can specify which major they will have higher education.
In high school level, students are trying to increase their performance but they don’t know where they stand academically and what is their performance is. The prediction of their grades at this level of education will help them know their current situation and performance. So from this point, this will increase their performance in order to produce the highest possible grades.
Data mining techniques can be useful to achieve the objectives of this work. It is clear that there has recently been a growing demand for using the data mining concept and applying its techniques in different fields such as educational system
Data mining techniques can be used for exploring students’ data in high school level to identify the factors that affect their academic performance. For this reason, Artificial Neural Network (ANN), which is one of the most popular data mining techniques, will be used in this paper.
2418 Simulated Annealing (SA) optimization algorithm will be used as well in this study to maximize students’ grades and to get the optimal results of students, which will help increasing the performance of students in this level.
Many researchers concentrated on studying college students’ performance depending on some factors like marks but very limited put the spot on the students in high school level [3] [4] [5]. However, this paper is going to fill this gap by achieving the main aims by increasing the performance of high school students by applying Artificial Neural Network (ANN) model to predict students’ grade then improving and optimizing their final grades by applying Simulated Annealing (SA) algorithm.
The objectives of this paper, framed to assist the academic achievers in high school level, are as follows:
A. Identify the different factors that can affect Students performance.
B. Construct a prediction model using Artificial Neural Network (ANN) in order to predict student final grades.
C. Develop a Simulated Annealing (SA) optimization algorithm to maximize the students’ grades in order to increase students’ performance.
2. LITERATURE REVIEW
There is an increasing interest in using data mining in Higher Education (HE) but very limited in high school level. Most of these research works are concerned with the performance of students [6] [7]. There are many resources for data in HE such as: graduate students’ surveys, students’ transcripts, workshops, etc. However, this paper concentrates initially on student transcript data since many previous studies have considered it as a significant indicator to student performance. However, it appears to be that no studies have taken Simulated Annealing (SA) into consideration side by side with data mining techniques.
There are many studies were applied the Data Mining techniques on the educational system but very limited studies used the optimization algorithms specially the Simulated Annealing (SA) algorithm which make this area of study very interesting to achieve the benefits of the optimization algorithms in increasing and
maximizing the performance of high school students.
Most of the researchers are concentrating on higher education system by using different data mining techniques to predict students’ grades but very limited studies concentrated on high school level. For example, the authors in their study [8] explain the importance of increasing the students’ performance in university courses, and they believe that there are several factors that may affect this performance. The authors used the data mining processes, particularly classification, to help in predicting students’ grades and enhancing the quality of the higher educational system by evaluating student’s data and study the main attributes that may affect the student’s performance in higher education courses.
Flores in his study tried to identify the students who had a problem to passing the courses at Cordoba University. The Artificial Neural Network model was developed and used to predict the students’ grades [9]. However, Flores obtained his data from MOODLE logs (Modular Object-Oriented Dynamic Learning Environment). He applied his experiment using MOODLE Database that contained 240 students in methodology and programming technology course, and then Flores worked to simplify the experimental work as much as possible by reducing the range of grades to pass or fail.
Kotsiantis tried in his study to take advantage of students’ data at the Hellenic Open University that is written on the assignments and the marks of students in order to predict the student’s performance [10]. He also applied many supervised machine-learning techniques like neural networks, naive bayes, decision tree, support vector machines, and logistic regression. By the end, he found that neural networks are one of the best techniques to be used to predict the students performance, ANN was accurate more that the other techniques and easy to use.
2419 improving the results through the use of GA Tree algorithm and its system (GATree system).
Saleh and Geoffrey in their study [12], they have investigated many approaches based on simulated annealing at the university level. However, by using simulated annealing the authors got valid schedules for problem of academic class scheduling for large university using a complex cost function.
Duong and Lam also did similar work as the previous study [13], they used in their study the simulated annealing algorithm to present a solution method for examination timetabling or academic course scheduling. However, they combined constraint programming and simulated annealing for the problem of exam timetabling with real data sets and they proved that they could solve a very difficult scheduling problem with simulated annealing.
After reviewing the related literature, it could be concluded that very few researchers were interested in studying the student performance in high school level using data mining techniques specially Artificial Neural Network (ANN) and optimization algorithms such as Simulated annealing (SA).
3. APPLYING ARTIFICIAL NEURAL
NETWORK (ANN)
3.1 Artificial Neural Network Overview
Artificial Neural Networks are considered as an artificial intelligence modeling technique. It contains neurons as original units, and as mentioned before it functions like the cell of the human brain, which is arranged in different layers in the network.
ANN has the ability to learn from a sample set which is called an ANN learning set. The architecture of ANN needs to first be established with some constrains on it – the number of hidden layers and neurons in each hidden layer has to be identified, then the learning process and calculation of weights can be started [14].
The back propagation (BPN) starts from the input layer the proceeds to the hidden layer and finally the output layer. There are also some equations that will be used to help in completing the process. The equations have been described in detail below [15].
Net input to node j can be represented as:
Where bj is the quantity of biasness over node j
Output of the node j can be represented as:
The outputs from the hidden layer are introduced into nodes in the output layer. This process is called the feed forward stage, and then output (opk) can be obtained from nodes in the output
layer.
System error is represented as:
Error for (BPN) from nodes in the output layer to the nodes in the hidden layer using gradient search method:
The d value for output layer is represented as:
When all the training input used in training system will collect adjusted weights using the equation represented as:
Adjustment of weights will be achieved according to:
Input data point must be closed to the interval [0, 1], so we can consider the interval [0.1, 0.9] is the best and convert the data to become between 0.1 and 0.9. In order to activate ANN we will use the sigmoid function, since it takes any real valued input and returns an output bounded between [0, 1].
2420
3.2 ANN Model
Data in this study has been collected from 100 hundred students (50 male and 50 female) in private school at Kingdome of Saudi Arabia (KSA). As mentioned before, four inputs (Grades average of ninth stage, Grades average of tenth stage, Grades average of eleventh stage, and average studying hours per day) and one output (average of high school stage) will be used.
The data will be divided into three samples, the first one for the training, second for the validation, third for the testing. Percentage will be divided as (60% for the training, 20% for the validation, and 20% for the testing).
Figure 1 shows the neural network model created for data classification. This figure describes the architecture of the model created and how input parameters such as grades average of ninth stage, grades average of tenth stage, grades average of eleventh stage, and average studying hours per day are connected to hidden layer and further hidden layer is connected to output layer such as average of high school stage.
[image:4.612.322.515.137.215.2]In this work, the network model has created with four input parameters are connected to one hidden layer and then the hidden layer are connected to one input layer.
Figure 1: The neural network for proposed model
3.3 ANN Results:
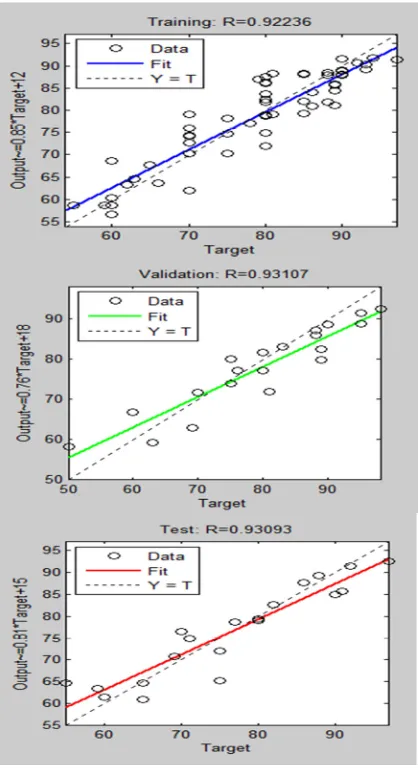
After applying the data on the ANN model, Figure 2 shows the regression analysis chart for MSE performance function with logsig activation function. Within this graph the training R=0.92235 and the test R=0.93093 and the validation is 0.93107. In this paper, by varying the simulation is trained the neural network tool in three performance functions and the three activation functions. The results obtained after training the data under different scenarios MSE gives better
[image:4.612.313.522.249.634.2]validation results. The errors obtained the training for MSE is 18.769, testing error is 19.025 and validation is 25.2298.
Figure 2: Results of the mean square errors and the regressions
Figure 3: Results of the regressions
[image:4.612.90.290.442.540.2]2421 relationship between the outputs and targets. If R= 1, this indicates that there is an exact linear relationship between outputs and targets. If R is close to zero, then there is no linear relationship between outputs and targets.
In this case, the training data indicates a good fit. The validation and test results also show R-values that greater than 0.9. The scatter plot is helpful in showing that certain data points have poor fits.
4. APPLYING SIMULATED ANNEALING ALGORITHM (SA)
4.1 SA Overview
Simulated Annealing (SA) is a random search technique which exploits an analogy between the way in which metal cools and freezes into a minimum energy crystalline” [16]. However, SA considered as algorithm for solving the combinatorial minimization problems and NP complete problems [17].
[image:5.612.351.487.157.524.2]Table 1 below shows the strengths and weaknesses of the simulated annealing algorithm [16].
Table 1: strengths and weaknesses of the simulated annealing algorithm
It can be concluded that the main point of Simulated Annealing (SA) advantages of over other methods is the ability to ignore becoming trapped in local minima, and SA does a random search which does not accept decreasing change but can accept the increasing changes.
The latter are accepted with a probability: p = exp ( -df / T)
Where df is the increase in f and T is a control parameter, which by analogy with the original application is known as the system ''temperature"
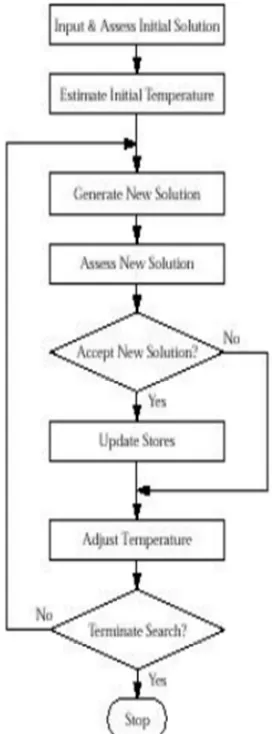
irrespective of the objective function involved. The implementation of the basic SA algorithm is straightforward. The following Figure 4 shows its structure [10-16]:
Figure 4: Simulated annealing Structure
[image:5.612.92.296.399.591.2]2422
Figure 5: Simulated Annealing heuristic algorithm [18]
4.2 SA implementation
In this section, the developed algorithm of Simulated Annealing (SA) has been described in detail. MATLAB software has been used for the implementation part for both Artificial Neural Network (ANN) and Simulated Annealing (SA). Below is the code for SA with the description in detail:
*************************************** t0=50;m=50;n=50; % t0: starting temperature m: number of temperatures n: no. of moves x0=[78 85 79 3]; % x0: initial solution xn=x0; % xn: the solution for next iteration t(1)=t0; % next temp
xf=x0; % final solution
alpha = 0.9; % cooling parameter
xn=x0; % current solution equals the initial solution for r=1:m % start the loop for the temperatures for i=1:n % start the loop for each temperature moves
% move operator for the solution xtemp(1)=xn(1)+normrnd(0,0.1) % move operator for the first grade
xtemp(2)=xn(2)+normrnd(0,0.1) % move operator for the second grade
xtemp(3)=xn(3)+normrnd(0,0.1) % move operator for the third grade
xtemp(4)=xn(4)+normrnd(0,0.05) % move operator for the hours
% check if the move solution is better than the current solution
if
sim(net100,[xtemp(1);xtemp(2);xtemp(3);xtemp(4) ])>= sim(net100,[xn(1);xn(2);xn(3);xn(4)]) xn=xtemp; % the current solution equals the temprory solution (take the move)
else % if the temprory solution is not better decide based on the probability
p=rand(1); %generate random no. between 0 and 1 (represent the probability)
if p>=
(1/exp(sim(net100,[xtemp(1);xtemp(2);xtemp(3);xt
emp(4)])-sim(net100,[xn(1);xn(2);xn(3);xn(4)])/t(r))) xn=xtemp; % take the move
end % this means if the prob. not greater then we will not take the move
end if
sim(net100,[xn(1);xn(2);xn(3);xn(4)])>=sim(net100 ,[xf(1);xf(2);xf(3);xf(4)]) % if the next solution is better than the final replace it
xf=xn; % final solution = the current solution end % if the current is not better dont change the final
t(r+1)=t(r)*alpha; % change the initial temperature
end % end for n end % end for m xf=round(xf); for i=1:4 if xf(i)>100 xf(i)=100; end
end
solution=xf
optimal=round(sim(net100,[xf(1);xf(2);xf(3);xf(4)]) )
****************************
4.3 SA Results
The result of the Artificial Neural Network (ANN) model has been entered on the simulated annealing algorithm, which represented as a function called (Net100) in the previous simulated annealing code, then have the starting temperature, number of temperatures, and number of moves have been changed multiple times.
Finally 50 moves have been considered for each one, which gave better results after running the program.
Below are the initial solutions: - The average of the ninth grade= 78 - The average of the tenth grade= 85 - The average of the eleventh grade=79 - The hours of study per day=3
2423 in the initial solution, the annealing schedule, and
the stopping criterion. As shown in Table 2, after changing some parameters of SA code, there is a change in the best-input solution and the optimal solution. For example, the first result when the initial temperature was 50, the cooling parameter was 0.9, the number of temperature was 50, the number of moves was 50, and the Initial Solution was (90 91 92 4). In this case the best input solution will be (98 89 100 5) and optimal grade is 93, this means if the average of the student in the ninth stage was 90, the average of the student in the tenth stage was 91, the average of the student in the eleventh stage was 100, and his studying hours per day were 4, the max grade he will get is 93.
It can be concluded here that the student’s high school grade can be predicted then the performance of the student can be positively improved using simulated annealing algorithm.
5. CONCLUSIONS AND FUTURE WORK
Artificial Neural Network (ANN) model was applied in this study to predict the high school students’ grades to increase their performance depends on four factors: grades average of ninth stage, grades average of tenth stage, grades average of eleventh stage grades, and average studying hours per day. The results obtained after training the data under different scenarios Mean Squire Error (MSE) gives better validation results.
Simulated Annealing (SA) algorithm was applied as well on the results of Artificial Neural Network (ANN) model using MATLAB software (code was developed to do so).
Finally from the results the objectives of this paper have been achieved by predicting the students’ grades in high school level using ANN, students’ grades have been improved by using SA algorithm to increase students’ performance and maximize their final grades.
As an extension of this paper, the attendance data of a certain student along with his/her transcript’s achieved by this work will be taken into consideration to build a predication model that assist the student in increasing his/her academic performance.
6. REFERENCES
[1] Mok. K, Tan .J, “Globalization and Marketization in Education: A Comparative Analysis of Hong Kong and Singapore”, Edward Elgar Publishing, 2004.
[2] Sovan Lek, J.F. Gue´gan, “Artificial neural networks as a tool in ecological modeling, an introduction”, Ecological Modeling 120, 1999, 65–73.
[3] Minaei-Bidgoli, B., Kortemeyer, G., Punch,W.F., (2004). Enhancing Online Learning Performance: An Application of Data Mining Methods, In Proceeding of Computers and Advanced Technology in Education. [4] Luan, J., (2002). Data mining and knowledge
management in higher education – potential applications. In Proceedings of AIR Forum, Toronto, Canada.
[5] Gabrilson, S., Fabro, D. D. M., Valduriez, P., (2008). Towards the efficient development of model transformations use model weaving and matching transformations, Software and Systems Modeling. Data Mining with CRCT Scores. Office of information technology, Geogia Department of Education.
[6] Dringus, L., & Ellis, T. (2005). Using data mining as a strategy for assessing
asynchronous discussion forums. Computers &
Education, 45, 141-160.
[7] Blikstein, P. (2011). Using learning analytics to assess students' behavior in open-ended programming tasks. Paper presented at the
Proceedings of the 1st International
Conference on Learning Analytics and
Knowledge, Banff, Alberta, Canada.
[8] Al-Radaideh Q., Al-Shawakfa E., Al-Najjar M. (2006) “Mining Student Data Using Decision Trees”, The 2006 International Arab Conference on Information Technology (ACIT'2006).
[9] Calvo-Flores C., Galindo E., Jiménez M., Piñeiro O., "Predicting students’ marks from Moodle logs using neural network models", Current Developments in Technology-Assisted Education , 2006, 1(2) PP.(586-590).
[10]Kotsiantis S., Pierrakeas C., Pintelas P., "Predicting students’ performance in distance learning using Machine Learning techniques", Applied Artificial Intelligence, 2004, 18(5) PP. (411-426).
[11]Kalles D., Pierrakeas C., (2006)" Analyzing student performance in distance learning with genetic algorithms and decision trees", Applied Artificial Intelligence, 2006, PP. (655-674). [12]Elmohamed, M.A. Saleh; Fox, Geoffrey; and
2424 [13]Tuan-Anh Duong, Kim-Hoa Lam, “Combining
Constraint Programming and Simulated Annealing on University Exam Timetabling”, Intl. Conf., 2004, February 2-5, Hanoi, Vietnam.
[14]R. Garrett, J. Lin, T. Dean, “An investigation of the effects of solution heat treatment on mechanical properties for AA 6xxx alloys: experimentation and modeling”. International Journal of Plasticity, 2005, 21: 1640–1657. [15]The back propagation (BPN) equations taken
from the notes of Prof. Lowis in soft computing course, 2010.
[16]Busetti, F., “Simulated Annealing Overview” [17]Teukolsky S.A., “Numerical Recipes in C”,
Cambridge University Pres, 2002, p 444-456. [18]Wikipedia: “Simulated annealing”
2425 Initial
Temperature
Cooling parameter
Number of Temperature
Number of Moves
Initial Solution
Best input
Solution Optimal grade Change the initial solution three times
50 0.9 50 50 90 91 92 4 98 89 100 5 93
50 0.9 50 50 80 85 87 2 82 83 100 7 91
50 0.9 50 50 75 70 70 2 77 76 99 3 89
Change the annealing schedule three times
50 0.8 50 50 90 91 92 4 100 88 100 9 93
50 0.5 50 50 90 91 92 4 94 92 96 7 97
50 0.1 50 50 90 91 92 4 94 89 94 6 92
Change the stopping criterion twice
50 0.9 30 50 90 91 92 4 93 91 97 6 95
50 0.9 10 50 90 91 92 4 89 88 91 4 93