Full Length Research Article
ASSESSMENT OF WATERSHED MANAGEMENT IMPACTS ON EROSION AND SEDIMENTATION
(BEHVARD WATERSHED, IRAN)
1
Seyed Ali Asghar Hashemi,
*2Hoda Karimipour and
3Houshang Jazi
1
Soil Conservation and Water Management Research Department, Semnan Agricultural and Natural Resources
Research Center, AREEO, Semnan, Iran
2
Senior Technical Expert, SMLWR Project (UNDP/Gov Joint Project), Artesh Highway, Minicity, Tehran, Iran
3National Project Manager, SMLWR and Menarid Projects (UNDP/GEF/Gov Joint Projects), Artesh Highway,
Minicity, Tehran, Iran
ARTICLE INFO ABSTRACT
The implementation of soil preservation programs and measures to combat erosion and sedimentation could substantially assist the protection of resources and the maintenance of the reservoir constructions under the framework of watershed management activities. The assessment of watershed management activities and the level of public support is essential in facilitating the enhancement of such steps and identifying their strengths and weaknesses. Thus, the objective of this research was to assess the impact of watershed management activities on erosion and sedimentation of Behvard Watershed. The aforesaid area is a sub-watershed basin being studied by the Sustainable Management of Land and Water Resources (SMLWR) Project of Hableroud Watershed Basin in collaboration with UNDP from 1996 where currently several watershed projects are ongoing. The assessment results of erosional facies of the basin in the areas of biological operation indicate alterations in various regions. The most effective steps in reduction of erosional facies and the consolidation of erosional flanks are embankment along with plantation of fruit saplings and drop seeding. The highest reduction in special erosion (73.2%) in the areas of biological operations was due to embankment and plantation of fruit saplings. The amount of controlled sedimentation via the operational activities indicates that earth band sar contains the highest level of sedimentation. The comparison of sedimentation levels reveals that in some sub-basins the sedimentation reductions were 4.8 to 6 folds and the amount of sedimentation at the reservoirs were 79% to 83.2% less.
Copyright © 2015 SeyedAli Asghar Hashemi et al.This is an open access article distributed under the Creative Commons Attribution License, which permits unrestricted use, distribution, and reproduction in any medium, provided the original work is properly cited.
INTRODUCTION
Mankind requires food resources to continue his existence on the planet Earth. Water and soil are the essential elements for the preservation of food resources. One of the parameters that adversely affect the quality of water and soil is erosion. Thus, combating erosion at global scale is a primary concern. Erosion is an unavoidable phenomenon that anthropogenic activities could either exacerbate or palliate its impacts (Ahmadi, 2000). In the case of intact soils, it takes about 300 years to produce 25 millimeters of top soil. This amount is considerably less than the volume of eroded soil. In case of cultivated lands that the principles of proper soil tillage are not
*Corresponding author: Hoda Karimipour
Senior Technical Expert, SMLWR Project (UNDP/Gov Joint Project), Artesh Highway, Minicity, Tehran, Iran
fully observed, it takes about 100 years to produce the same 25 millimeters of top soil. Therefore, approximately 4 tons of soil is produced per hectare each year. But, the amount of soil erosion is usually higher. In an optimized situation where the proper methods of cultivation and harvesting are implemented, 25 millimeters of top soil could be produced in 30 years. In other words, 12.5 tons of soil per hectare could be created each year. This is roughly equal to the amount of acceptable soil erosion during the same time span, which is considered as the permissible level of erosion in deep fertile soils. It is evident
that the permissible levels for shallow or less fertile soils are lower (Refahi and Nemati, 1995), (Refahi, 2009). It should be taken into consideration that not only erosion destroys the soil and its fertility, but also reduces the capacity of dam reservoirs. Thus, soil erosion hampers agricultural development plans (Okoba and Sterk, 2010).
ISSN: 2230-9926
International Journal of Development Research
Vol. 5, Issue, 07, pp. 4897-4904, July, 2015
DEVELOPMENT RESEARCH
Article History: Received 23rd April, 2015 Received in revised form 09th May, 2015 Accepted 26th June, 2015 Published online 30th July, 2015 Key words:
Erosion, Hablehroud, Sedimentation,
If the rectification of sedimentation process is not impossible, at least it is difficult and very costly. As a result, investments are made on prevention of soil erosion, protection of water and soil resources through watershed management; instead of reclamation of lost resources in recent years (Bagdi, 2005). The implementation of soil protection programs and the utilization of methods to combat erosion and sedimentation could substantially assist the preservation of available resources and the maintenance of the reservoirs within the framework of watershed activities (Boroghandi et al., 2012). The estimation of total volume of sediment yield per year at a watershed basin, before and after the implementation of soil protection programs is a relatively appropriate method for the assessment of the effectiveness of such programs (Janku et al., 2014). Meanwhile, the evaluation of public satisfaction from the watershed activities helps to identify the weaknesses and strengths of these steps. Thus, the post-assessment of watershed activities is essential (Johnson, 1993). The utilization of quantitative methods in assessment of protective measures and the anthropogenic impacts, before and after watershed activities, are preferred with greater precision to the qualitative approaches, if adequate data is available (Elidermi and Marvili, 2013), (Sadeghi et al., 2004), (Chang and Huang, 2006), (Mori, 2003), (Cognard et al., 2001).
MATERIALS AND METHODS
The studied area and its specifications
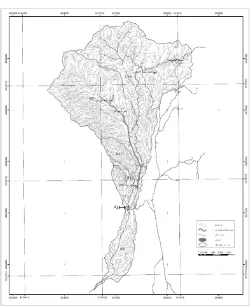
The studied area is Behvard watershed basin located at Gharmsar County with an area of 4953 hectares. The only village inside the studied area is Behvard Village situated on the southern edge of the basin. The location of the studied area is presented in Figure 1.The boundaries of the watershed basin are shown in Figure 2. The studied watershed basin is divided into 7 sub-basins as indicated in Figure 2. From the year 2000, there are ongoing activities under the framework of Sustainable Management of Land and Water Resources (SMLWR) Project of Hableroud Watershed Basin.
Research Method
For this research, the available reports and studies were reviewed. Then, the influential indicators of structural, biological (encompassing alteration of erosional facies and shapes at areas of biological activities) and land-use alteration activities were determined. Before and after the precipitation season, the field visits and monthly monitoring were performed.
Figure 2. The boundaries of Behvard Watershed Basin and sub-basins
Afterwards, the prepared forms for the identification of indicators were completed. With the aid of GPS, photography camera and the dimensions of the sedimentations, the required data were gathered. Then, the changes occurred on the shape of surface, rill, watercourse and gully erosions were studied. The erosional shapes of the basin were categorized based on soil surface factor (SSF) used by the US Bureau of Land Management (BLM). In order to determine the amount of changes occurred on the erosional types and facies, the following steps were taken;
Preparation of a map for the new working units Study the aerial photos and the development of the preliminary maps of erosional shapes
Field visit of the area and review the erosional shapes map of the preliminary studies, prior to project activities
Taking field surveys and positioning the location of several erosional shapes via GPS
Collation of the surveyed locations and the related forms with satellite images and subsequently provide the final map of the erosional shapes
Determine the status of erosion in each region based on the collected information
Study the scope of alterations made on the erosional types, facies and surface
For determining the levels of erosion and monthly sedimentation controlled by the implemented activities, the measurement and estimation of sediments was conducted during the monitoring period prior and after the precipitation season (Atnafe et al., 2015). All the 134 constructed structures
including 79 earth band-sar, 35 concrete gabion check dam, 5 gabions, 5 sandy grout, one gurab, 2 small earth dams, one underground band and the entire area of biological activities were monitored. The amount of trapped sediment behind the mechanical structures were also calculated. Based on the samples taken from various gabion, dry-stone check dam, wattle, apron, groin and small earth dam structures as well as the calculated sediments behind the structures, the amount of trapped sediments was determined. In order to calculate the trapped sediment behind the structures, the mathematical principles of prismatic volumes were used. Thus, the sediments behind each structure was divided into one rectangular and two triangular sections. Eventually with the aid of parameters related to each structure, the volume of trapped sediment was obtained. The measured parameters included the geographical latitude and longitude of the structure, type of structure, the sedimentation width of the structure, height of the structure, height of sedimentation to weir and the useful height of sedimentation (prior and after the precipitation season), length of sedimentation, width of the tail end sedimentation, bed slope as well as the right flank and the left flank slopes (Kairis et al., 2013).
One the most precise methods of estimating the sedimentation volume produced in the watershed basin is use of measured data from hydrometric stations, the estimated sediment rating curve and the eventual produced sediment. In places where adequate number of stations are available, the amounts of sediment could be measured. Meanwhile in the basins with watershed structures, the reliable method of sediment rating is through the reservoirs (Hashemi and Arabkhedri, 2008). Since there are no measurement devices in this basin, the utilization of statistical methods is impossible. Therefore, the alteration levels of total and special erosion in the basin is determined through an experimental method called Erosion Potential Method (EPM) (Gavrilovic, 1988). The Erosion Potential Method (EPM) was proposed by Gavrilovic in 1988 (Gavrilovic, 1988). In this model, the influential factors on the sedimentation inside the watershed basin are evaluated and scored. They include Coefficient Value for the Observed Erosion Process, Land Use Coefficient, Coefficient of Soil Resistance to Erosion, Land Slope, and Coefficient of Erosion of the watershed basins. The following equation is used to estimate the produced sediment at watershed basins:
Ru
Wsp
Gsp
(1)Where, Gsp is the produced sediment (cubic meter per square kilometer each year)
Wsp is the special erosion (cubic meter per square kilometer each year. It is estimated based on the following relationship:
.
.
.
23
Z
H
T
Wsp
(2)Where, H is average annual precipitation (millimeter)
Z is the Coefficient of Erosion is obtained from the following equation:
)
(
.
21
I
Xa
Y
Z
Where, Y, Xa and
are coefficient of soil and rock resistance to erosion, land use and erosion , respectively in each watershed basin whose scores are shown in Tables 2-3 to 2-5.Where, I is the percentage of land slope
= 3.14159T is the coefficient of temperature obtained from the following equation:
2 1
) 1 . 0 10
(
t
T
(4)
Where t is the mean annual temperature in Centigrade
Ru is the coefficient of sedimentation at the watershed basin, derived from the equation below:
)
10
(
)
(
4
1/2
L
D
O
Ru
(5)Where, O and L are the perimeter and length of the watershed basin in kilometers
D is the difference between the mean height of the watershed basin and its exit point in kilometers
DISCUSSION AND CONCLUSION
Level of alteration in erosional facies at sub-basins
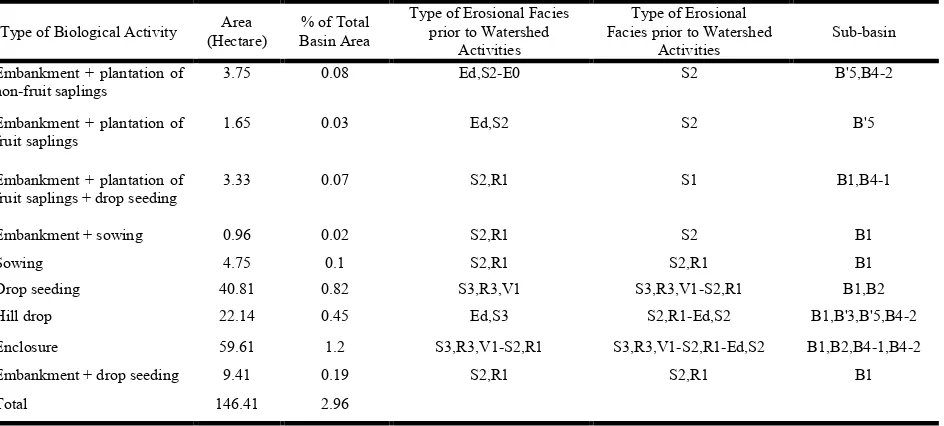
The assessment results of the erosional facies at the working area of biological activities indicate that the level of alterations vary in different areas. The maximum effect on the adjustment of erosional facies and stabilization of erosional slopes with embankment and plus plantation of fruit saplings and drop seeding. The minimum effect or no effect is caused by hill drop and drop seeding activities that are considered unsuccessful. The results are presented in Table 4.
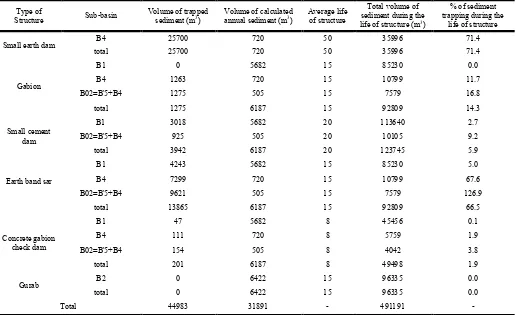
The amount of controlled sedimentation by the performed activities
The volumes of accumulated sediments behind the structures for each sub-basin and the calculated coefficient of trapped sediments for the modified structures are indicated in Table 5.
Calculation of special erosion
In Table 6, the amounts of special erosion at the site of biological activities of Behvard basin, before and after the watershed activities, are provided.
Determination of special sedimentation (Gsp) and annual sedimentation (Gs) of basin
The amounts of annual and special sedimentations of the basin and sub-basins are calculated based on EPM model, whose
results are presented in table 6. In order to convert the volume of sediment to its weight, the specific weight of sediments with respect to the soil texture, organic materials, and the geological formations is assumed to be 1.3 Ton/M3. In this research, due to lack of any laboratory results on sediment samples from Behvard basin and the concentration of biological and bio-mechanical activities at the upstream of Behvard Earth Dam and Village, the reverse calculation of produced sediments at BO2 and B4 sub-basins was conducted whose results are presented in Table 7. Thus from the data gathered from the field visit, the volume of trapped sediments from the commencement of the construction phase of the structure until the field monitoring were calculated (row 1 of the Table). Then, the results of EPM experimental model were used to extract the volume of estimated sediment yield in year (GS) as indicated in row 2 of the Table. In order to calculate the amounts of produced sediments at the region during the post-watershed activity years, the mean life of the structure had to be determined. Since the above-mentioned activities were conducted during 2000 to 2004 period, the mean life of the structure was assumed to be 18 years (row 3 of the Table).
Since, there were no previous calculation on the amount of erosion and sedimentation, this factor had to be determined in order to compare and evaluate the performance of the constructed structures on the control and alteration of erosion and sedimentation levels. Thus, the number of years required for the production of the stated amount of trapped sediment was determined by dividing the volume of trapped sediment (row 1 of the Table) by the volume of estimated sediment yield in year (GS) after the completion of the watershed activities (row 2 of the Table). The results were provided in row 4 of Table 6. Then, the number of years required for the production of the stated trapped sediment (row 4 of the Table) was divided by the mean number of years after the completion of the activities (row 3 of the Table), and the ratio of produced sediment before and after the activities was determined (row 5 of the Table). Eventually, this ratio (row 5 of the Table) is multiplied by the volume of estimated sediment yield in year (GS) as stated in row 2 of the Table in order to obtain the present annual sediment yield (row 6 of the Table). Thus, the volume of trapped sediment (row 1 of the Table) could be used along with the mean number of years after the completion of the activities (row 3 of the Table) and the area of each sub-basin (row 7 of the Table) in order to calculate the amount of special trapped sediment (row 8 of the Table).
)
Ү
[image:5.595.106.496.78.192.2](
Table 1. Coefficient of Soil Resistance to Erosion
# Specifications of soil and bedrock Average Score
1 Sand, gravel, loess soil 2
2 Loess, tuff, saline soils, steppe soils and similar soils 1.6
3 Arkosic limestone and marl 1.2
4 Serpentine, red sandstone and flysch sediments 1.1
5 Podzols soils, parapodzol, crushed schist, Micaschtist, Gneiss, clay schist, etc. 1 6 Sheets and compact limestone, red clay soils, silicate humus soil 0.9
7 Brown forest soils and mountain soils 0.8
8 Non-calcareous colloidal Asmvyytza soils, marshy soils and interazonal soils 0.6 9 Czarnoziom soils, alluvial sediments with good texture 0.5
10 Bare and dense igneous rocks 0.25
)
Xa
[image:5.595.117.485.229.337.2](
Table 2. Land Use Coefficient
# Conditions influencing the coefficient Average Score
1 Bare and infertile lands (bad lands) 1
2 Lands plowed from top to bottom of flanks 0.9
3 Orchards and vineyards without vegetation coverage at the lower stratification 0.7
4 Farms cultivated on the level lines 0.6
5 Deteriorated forests and shrubberies with eroded soil 0.6
6 Dry mountain pastures 0.5
7 Grasslands and similar permanent harvests 0.4
8 Drained meadows 0.3
9 High forests on steep slopes 0.2
10 High forests on shallow slopes 0.05
Table 3. Coefficient of Erosion (
) in EPM method# Conditions influencing the coefficient Average Score
1 Watershed basin or region completely affected by gully erosion and deep erosional processes 1
2 About 80% of the region is covered by rills and gullies 0.9
3 About 50% of the region is covered by rills and gullies 0.8
4 Entire region is affected by surface erosion: gravels and debris, moderate rills and gullies and severe karst erosion 0.7 5 Entire region is affected by surface erosion without evident effects like rills, gullies, rock falls, etc. 0.6 6 50% of the region is affected by surface erosion, but other parts of the basin is not affected 0.5 7 20% of the region is affected by surface erosion, but 80% is not affected 0.3 8 The land surface is without discernable erosion (small rock falls or watercourse landslides) 0.2
9 The land surface is without discernable erosion – mostly farm lands 0.15
10 The land surface is without discernable erosion – mostly used for permanent or woody products (grasslands, pastures, etc.) 0.1
Table 4. Status of erosional facies at the site of biological activities after the watershed activities
Sub-basin Type of Erosional
Facies prior to Watershed Activities Type of Erosional Facies
prior to Watershed Activities % of Total
Basin Area Area
(Hectare) Type of Biological Activity
B'5,B4-2 S2
Ed,S2-E0 0.08
3.75 Embankment + plantation of non-fruit saplings
B'5 S2
Ed,S2 0.03
1.65 Embankment + plantation of fruit saplings
B1,B4-1 S1
S2,R1 0.07
3.33 Embankment + plantation of fruit saplings + drop seeding
B1 S2
S2,R1 0.02
0.96 Embankment + sowing
B1 S2,R1
S2,R1 0.1
4.75 Sowing
B1,B2 S3,R3,V1-S2,R1
S3,R3,V1 0.82
40.81 Drop seeding
B1,B'3,B'5,B4-2 S2,R1-Ed,S2
Ed,S3 0.45
22.14 Hill drop
B1,B2,B4-1,B4-2 S3,R3,V1-S2,R1-Ed,S2
S3,R3,V1-S2,R1 1.2
59.61 Enclosure
B1 S2,R1
S2,R1 0.19
9.41 Embankment + drop seeding
2.96 146.41
[image:5.595.45.547.377.484.2] [image:5.595.66.538.524.737.2]Table 5. Coefficient of sediment trapping of modified structures
% of sediment trapping during the
life of structure Total volume of
sediment during the life of structure (m3) Average life
of structure Volume of calculated
annual sediment (m3) Volume of trapped
sediment (m3) Sub-basin Type of Structure 71.4 35996 50 720 25700 B4
Small earth dam
71.4 35996 50 720 25700 total 0.0 85230 15 5682 0 B1
Gabion B4 1263 720 15 10799 11.7
16.8 7579 15 505 1275 B02=B'5+B4 14.3 92809 15 6187 1275 total 2.7 113640 20 5682 3018 B1 Small cement
dam B02=B'5+B4 925 505 20 10105 9.2
5.9 123745 20 6187 3942 total 5.0 85230 15 5682 4243 B1
Earth band sar B4 7299 720 15 10799 67.6
[image:6.595.53.538.420.565.2]126.9 7579 15 505 9621 B02=B'5+B4 66.5 92809 15 6187 13865 total 0.1 45456 8 5682 47 B1 Concrete gabion check dam 1.9 5759 8 720 111 B4 3.8 4042 8 505 154 B02=B'5+B4 1.9 49498 8 6187 201 total 0.0 96335 15 6422 0 B2 Gurab 0.0 96335 15 6422 0 total - 491191 - 31891 44983 Total
Table 6. Special erosion on the area of biological activities at Behvard basin, prior and after watershed activities
Type of biological activities Prior to watershed activities After watershed activities % of reduction WSP(ton/ha/yr) WSP(ton/ha/yr)
Embankment + plantation of non-fruit saplings 6.07 2.61 57.0
Embankment + plantation of fruit saplings 7.83 2.10 73.2
Embankment + plantation of fruit saplings + drop seeding 4.68 1.38 70.5
Embankment + sowing 4.30 2.30 46.5
Sowing 5.57 3.93 29.4
Drop seeding 11.12 7.25 34.8
Hill drop 8.71 7.92 9.1
Enclosure 6.83 6.48 5.1
Embankment + drop seeding 5.14 3.48 32.3
Table 7. Sedimentation estimate and its reduction % at Behvard sub-basins, before and after watershed activities
# Sedimentation Sub-basin Unit Comments
BO2 B4
1 Volume of trapped sediment 19283 34373 Cubic meter Results of field work 2 Calculated volume of sediment after watershed activities 505 720 Cubic meter per year GS 3 Average # of years, after the completion of activities 8 8 Annual 1379-1383 4 # of years required to produce the given amount of sediment 38 48 Annual Row 2/Row1 5 Ratio of produced sediment, before and after the activities 4.8 6.0 Ratio Row 3/Row4 6 Volume of annual sedimentation, before the activities 2410 4297 Cubic meter per year Row 2 x Row 5
7 Area 4.28 2.76 Square kilometer
8 Special trapped sediment 563 1557 Cubic meter per square
kilometer per year
Row 7/(Row3/Row1) 9 Calculated special sediment 118 261 Cubic meter per square
kilometer per year
Gsp
10 Reduction % of sedimentation 79.0 83.2 %
[image:6.595.54.538.594.784.2]basin despite the high sensitivity of its formations. The considerable difference between the amount of special sediment and the data from the Hablehroud Bankouh Hydrometric Station (8.32 tons of special sediment per hectare per year) reveals the significant effect of biological and bio-mechanical corrective measures. Based on the concentration of watershed activities at BO2 and B4 sub-basins as well as the presented results in Table 6 with the assumed mean duration of 8 years for the watershed activities at the above-mentioned sub-basins, the trapped sedimentation by the constructed structures are determined to be 38 and 48 years of sedimentation after the implementation of the corrective measures, respectively. However, the amount of sedimentation has accumulated in only 8 years, before the complete effect of corrective measures taking place.
In other words, assuming that all the present structures at the BO2 and B4 sub-basins are constructed in a given year, with the current status of vegetation coverage and the mentioned corrective measures, it is possible to control the produced sediments in the region for 35 years. Given the fact that Behvard basin is situated at the upstream of Behvard small earth dam and the control of erosion and sedimentation is highly important for the preservation of water levels at dam reservoir, the long term control and consolidation of sediments could considerably increase the life of Behvard small earth dam at the outlet of B4 sub-basin. Moreover, the results indicate the sedimentation reduction of 79% and 83% at BO2 and B4 sub-basins, respectively. The special sediments have reduced from 563 to 118 cubic meters per square kilometer at BO2 sub-basin and from 1557 to 261 cubic meters per square kilometer at B4 sub-basin each year. However, the limited implementation of biological activities (at about 3 percent of the region) have had considerable effect on the reduction of erosion and reduction only in few sub-basins of the regions.
Assessment and prioritization of activities on control of erosion and sedimentation, and the improvement of land capability
The results from field works and expert evaluation of erosion and sedimentation at Behvard watershed basin reveal that the collective watershed activities have has substantial effect on the reduction of erosion and sedimentation in the region. Albeit, the distribution and the scope of the implemented measures vary in different sub-basins. In order to determine the significance of effect and the prioritization of activities, the diversity of measures taken are to be considered as highly influential in success of the operation. Thus, it is difficult to prioritize the measures with high certainty (Goss, 2014). However, the data obtained from the field works and the subsequent calculations indicate the significance of mechanical measures on the control of erosion and sedimentation in the region at the early stages. Meanwhile, the principles of watershed management point out to the extensive biological measures at the upstream of the constructed structures after the completion of the mechanical activities (Pohrazska et al., 2015). The vegetation coverage is responsible for natural control of erosion and sedimentation in order to prevent high level of sedimentation at the structures. Thus, mechanical activities at the early years have been effective followed by the implemented biological measures at the studied basin. The combination of above-mentioned
activities have had successful impact on control of erosion and sedimentation at some sub-basins, particularly at the upstream of Behvard small earth dam and village. The mechanical activities could be prioritized based on the effect of each measure. At Behvard watershed basin, the construction of small earth dams and levees (total of 79 units) have had the greatest contribution by containing 13865 cubic meters of sediments. Due to the presence of soil at the structures and the flanks, these locations have been suitable for the growth of endemic vegetation and consolidation of sediments. The small earth dams, despite their low cost, have had high success rate in controlling erosion and sedimentation with the mean trapping coefficient of 82 percent in the region. The small cement dams at the major waterways are the next most effective structures in the region that have controlled 3942 cubic meters of sediment. Only in five cases, the structures have caused the reduction of slope and the upsurge of permeability into the major waterways with the mean trapping coefficient of 27.8 percent. The five constructed gabions have contained 1275 cubic meters of sediment with the mean trapping coefficient of 14.3 percent. Due to the presence of concrete gabion check dams at the upstream, the mentioned gabions have sustained their trapping capability.
Despite the relatively high number of concrete gabion check dams (35 structures), they have contained only 200 cubic meters of sediment with the mean trapping coefficient of about 2 percent during the recent years. The small distance between the structures, the shallow slope of waterways, low thickness and permeability of structures, and the dominance of soil and marl in the region have reduced the effectiveness of concrete gabion check dams in controlling erosion and sedimentation. Thus, their construction has the lowest priority. Amongst the performed biological measures, embankments have the highest effectiveness due to the shallow slope, greater permeability of water and better growth of vegetation. In the studied area, some of the implemented projects like embankment- plantation of fruit and non-fruit saplings embankment-sowing, and embankment-plantation of fruit saplings-drop seeding have resulted in suitable establishment of vegetation coverage and ensuing high effectiveness in reduction of erosion and sedimentation in the region. Nonetheless, projects like sowing and embankment-drop seeding despite the reduction of slope and growth of invasive species are the next priorities with medium effectiveness. Some of the projects like drop seeding, enclosure and hill drop had no impact on the vegetation coverage and erosion control and are considered as low priority (Table 8).
REFERENCES
Atnafe, A. D., Ahmed, H. M., Adane, D. M. 2015. Determinants of Adapting Techniques of Soil and Water Conservation in Goromti Watershed, Western Ethiopia.
Journal of Soil Science and Environmental Management, 6(6): 168-177.
Bagdi, G.L. 2005. People’s participation in soil and water conservation through watershed approach. International book distributing Co. 1st Edition. New York.
ChangHsu-Hsi, HuangWen-Chih, 2006. Application of a quantification SWOT analytical method. Mathematical and Computer Modeling, 43(2): 158-169.
Cognard-Plancq, A.L., Marc, V., Didon-Lescot, J.F., Normand, M. 2001. The role of forest cover on stream flow down Sub-Mediterranean Mountain watersheds: A modeling Approach. Journal of hydrology, 254: 229-243. Eildermi, A. R., Marvili, M. 2013. Quantitative assessment of
watershed activities at Ekbatan watershed basin. Journal of
Iranian Watershed Engineering and Sciences, 7(23): 63-66
(In Persian).
Gavrilovic, Z. 1988. The use of an empirical method (erosion potential method) for calculating sediment production and transportation in unstudied or torrential streams. Proceeding of international conference on River Regime. Published by John Wiley and sons, Paper.12: 411-422. Goss, M. 2014. The changing face of soil use and
management. Soil Use and Management, 30(1).
Hashemi, S. A., Arabkhedri, W. M. 2008. Assessment of EPM model through sediment rating of small dams. Journal of Water and Soil Sciences, Natural Researches and Agricultural Technologies and Sciences, 11(42):345-355 (In Persian).
Janku, J., Kuceraval, D., Houska, J., Kozak, J., Robesova, A. 2014. The evaluation of degraded land by application of the contingent method. Soil and Water Research, 9(4): 214-223.
Johnson, R.C. 1993. Effects of foresting on suspended soils and bed load yield in the Balguhdder catchment. Journal of Hydrology, 145: 403-417.
Kairis, O., Karavitis, C., Kounalaki, A., Salvati, L., Kosmas, C. 2013. The effect of land management practices on soil erosion and land desertification in an olive grove. Soil Use and Management, 29(4): 597-606.
Mori, K. 2003. Change in water balance attendant upon urbanization toward sustainable use of water resources. In proceeding: International Conference on rational use and conservation of water resourced in a changing environment, 10-15 July, Armenia.
Okoba, B. O., Sterk, G. 2010. Catchment-level evaluation of farmers' estimates of soil erosion and crop yield in the central highlands of Kenya. Land Degradation and Development, 21: 388-400.
Poharazska, J., Kucera, J., Karasek, P., Konecna, J. 2015. Land degradation by erosion and its economic consequences for the region of south Moravia (Czech Republic). Soil and Water Research 10(2): 105-113. Refahi, H. 2009. Erosion and its biological control, Chapaval,
Tehran University Press: 672 (In Persian).
Refahi, H. V., Nemati, M. R. 1995. Utilization of EPM in erosion study and sediment production of Alamout Roud basin. Journal of Iranian Agricultural Sciences, 26(1): 33-45(In Persian).
Sadeghi, S. A. V., Sharifi, F., froutan, A. V., Rezaei, M. 2004. Quantitative assessment of watershed activities and their performance (case study: Keshar watershed sub-basin). Research and Construction, 17(4): 96-102(In Persian).