Autonomic System to protect Wireless Sensor Networks
from External Attacks
Hosam Soleman
Department of Computer Engineering Maleke-Ashtar University
Islamic Republic of Iran
Ali Payandeh
Department of Computer Engineering Maleke-Ashtar University
Islamic Republic of Iran
ABSTRACT
The increased deployment of ubiquitous wireless sensor (WSN) networks has exponentially increased the complexity to detect wireless sensor network attacks and protect against them. In this paper, we investigated the vulnerabilities in wireless sensor networks, developed a comprehensive taxonomy of wireless sensor network attacks that has been used to guide our approach to develop, and successfully implement autonomic system capable of detecting and protecting wireless sensor networks from a wide range of attacks.Proposed system depends on analyzing packet flow information to detect the attacks. Where by analyzing information of packet flow, the autonomic system can be determines the behavior of the network if normal or abnormal.
Keywords:
wireless sensor network, packet flow, cluster topology, autonomic.1.
INTRODUCTION
Wireless sensor networks are composed of many lowcost micro sensor nodes which are deployed in the monitoring area. Each sensor node can form a multi-hop self-organizing network through wireless communication, and each sensor node is capable of sensing, data processing and communication [1]. Generally speaking, wireless sensor network is often deployed in an open environment, even the enemy-occupied domain. As sensor nodes transfer data through wireless communication link, the network can be easily captured and invaded. Due to the lack of foundation infrastructure like wired network, what wireless sensor networks face not only traditional security threats but also some attacks which include the exhaustion attack, selective forwarding-attack, wormhole-attack, sinkhole-attack, Sybil attack, hello-flood-attack, etc… Besides, each sensor node has limited energy and processing capability, small storage capacity and low bandwidth, this put forwards a larger challenge for the security of wireless network.
The objective of autonomic mechanism is to detect complex wireless sensor network attacks and generate counter measures to protect the WSN and the privacy of the users. It uses a set of measurement attributes collected from multiple network headers that includes information had been gathered from packets. Wireless sensor network flows (WSNetFlow) are learned and mined to select the features that are most relevant to different types of normal traffic and attack. By doing a traffic profiling of a wireless sensor network under different topology settings, data can be captured, compared, and modeled as a signature or baseline for normal operational behavior. This baseline can be used in an intrusion detection or prevention mechanism to identify a misbehaved network.
By comparing traffic against the captured data in the experiment, it will allow the developer and user to quickly pinpoint the source(s) of any performance problems or faulty nodes. With this knowledge, users will be able to spend more time focusing on the application instead of troubleshooting and debugging. Time and money can be saved as immediate action can be taken to resolve issues quickly. This study can also be used as an input to proactively monitor and identify issues quickly and accurately during the operation phase, saving situations where long downtime is prohibited or undesirable.
2.
RELEVANT KNOWLEDGE
Intrusion Detection refers to monitor the operational status of network or system, found action or sigh that violate security policy of the Network or system which may exist a variety of illegal attacks, malicious damage, misuse and so on, and make effective prevention and defensive behavior [2].According to the different methods of detection, the technology of Intrusion Detection can be classified for three types:
The first category is anomaly detection. It need to establish the model of normal user behavior, then, determine whether the user behavior significantly deviates from the threshold set by normal behavior model, and achieve intrusion detection finally. The common anomaly detection include based on Statistics[3],Cluster[4],Multi-agents[5.], Neural Network, Support Vector Machine(SVM)[6], Data Mining, Immunization Methods[7], Hidden Markov Model[8] ,etc.. The second category is misuse detection (signature-based detection).That is creating a signature library based on the known attack signature, then match the data collected from the network with the data in the signature library one by one, if there exists a matching feature, then that is an invasion. The common technology based on misuse detection contain based on Expert System, Model Reasoning, State Transition Analysis, Pattern Matching techniques and so on.
The third category is standardized detection. By defining a restrict mechanism describing rightful operate of program and protocol to supervise the executing program which violating the restrict mechanism.
2.1 Typical threats in WSNs
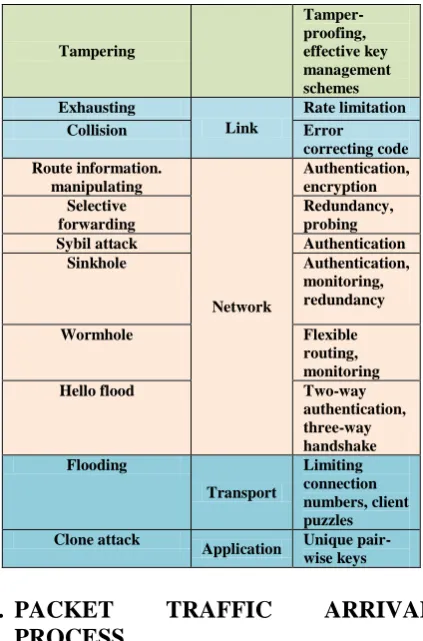
The threats and adequate defense techniques in WSNs can be classified as in Table 1.
Table1. Typical threats in WSNs
Threat Layer Defense
techniques
Jamming Physical
Tampering
Tamper-proofing, effective key management schemes Exhausting
Link
Rate limitation
Collision Error
correcting code Route information.
manipulating
Network
Authentication, encryption Selective
forwarding
Redundancy, probing
Sybil attack Authentication
Sinkhole Authentication,
monitoring, redundancy
Wormhole Flexible
routing, monitoring
Hello flood Two-way
authentication, three-way handshake Flooding
Transport
Limiting connection numbers, client puzzles Clone attack
Application Unique pair-wise keys
3.
PACKET
TRAFFIC
ARRIVAL
PROCESS
Because the data traffic dynamics in different WSN scenarios are quite different, the data traffic modeling and analysis in WSNs will be quite application dependent. In [9] it is suggested that WSN applications can be categorized as event-driven or periodic data generation. For periodic data generation scenarios, constant bit rate (CBR) can be used to model the data traffic arrival process when the bit rate is constant [10]. When the bit rate is variable, a Poisson process can be used to model the data traffic arrival process as long as the data traffic is not bursty[11]. For event-driven scenarios such as target detection and target tracking, bursty traffic can arise from any corner of the sensing area if an event is detected by the local sensors. A Poisson process has also been used to model the traffic arrival process in an event-driven WSN [12]. However, there is no solid ground to support the use of a Poisson process in this case. Actually, the widely used Poisson processes are quite limited in their burstiness [13]. Instead of using Poisson processes, the author of this article proposes to use an ON/OFF model (see Figure 1) to capture the burst phenomenon in the source data traffic of an event-driven WSN [14]. Further, the distributions of ON/OFF periods are found to follow the generalized Pareto distribution in his considered WSN scenario. Ref. [15] studies a different WSN scenario - a mobile sensor network (MSN). In an MSN, the node mobility introduces new dynamics to network traffic.
Fig. 1: ON/OFF state transition diagram
In this research have been used constant bit rate (CBR) to modeling the data traffic arrival process when the bit rate is constant (arriving packets to the base station is constant).
4. RULE-BASED INTRUSION
DETECTION SCHEMES IN WSN
Also called specification based intrusion detection schemes. In these schemes, the detection rules are first designed by domain expert before the starting the detection process. Most of the techniques in these schemes follow three main phases: data acquisition phase, rule application phase and intrusion detection phase (Silva et al., 2005). In the following subsections, the key important schemes in this category are explored.
4.1 Decentralized IDS in WSN
[image:2.595.61.273.70.391.2]4.2 Malicious Node Detection in WSN
Pireset al. (2004) present a solution to identify the possible malicious node based on the received signal strength measured in each node. They showed how to detect two kinds of attacks called HELLO flood attack and the wormhole attack in WSN by building a rule that compare the energy of the received signal and the energy of the same observed signal around the network. Although, this solution was one of the first solutions in the domain, it still restricted to those two types of attacks. In addition, sometimes there are other reasons rather than attacks that may cause a change in the signal strength which make this solution impractical.
4.3 An intrusion Detection System ForWSN
A novel intrusion detection scheme that takes the benefits of neighboring node information to detect the node impersonation and resource depletion attacks has been proposed by Onat and Miri (2005). In this scheme each node can make a statistical profile of its neighbor’s behavior based on two features which are the received power rate and the arrival packet rate.
This scheme cannot to be generalized for a typical wireless sensor network application in which many types of attacks evolve continuously. In addition and similar to the scheme proposed in (Pireset al., 2004), the building of the rules based on the received power rate is impractical since there are other factors that may affect this feature.
4.4 Towards Intrusion Detection in WSN
Krontiriset al. (2007) introduce a lightweight scheme for detecting selective forwarding and blackhole attacks in WSN. The key idea of their scheme is to make nodes monitor their neighborhood and then communicate between each other to decide if there is an intrusion taken place. The scheme is further evaluated experimentally on a real WSN deployment. This scheme benefits from the neighbors monitoring so that there is a kind of distribution that will minimize the computation load on a detection agent node. However, there will be an increase in the communication messages between nodes during the collaboration for voting that will increase the communication overhead and as a result will deplete the power of nodes quickly. It is clear that, this scheme lacks the generality that other schemes in the same category.
4.5 Intrusion Detection Scheme of Sinkhole
Attack in WSN
More specific intrusion detection scheme to detect sinkhole attack was proposed by Krontiriset al. (2008). This scheme is composed of four modules: Local Packet Monitoring Module, Local Detection Engine Module, Cooperative Detection Engine and Local Response Model. The proposed scheme has been implemented in the TinyOS environment with MinRoute protocol. A suitable detection rules have been prepared to suite with the sinkhole attack.
Generally, this scheme satisfies the distribution feature of IDS which is highly required on a large scale and autonomous environment like WSN. The problem here still with the communication overhead between the nodes to exchange useful information that helps in detecting the attack.
4.6 Neighbor-Based Intrusion Detection for
WSN
Stetskoet al. (2010) present an intrusion detection architecture based on collaboration between neighbors. They evaluated their scheme for detecting three types of attacks: Hello flood, selective forwarding and jamming attacks. Their scheme was implemented for Collaboration Tree Protocol (CTP) on the TinyOS environment. Although, the collaboration among nodes makes this scheme strong, the communication overhead is a problem. In addition, the extracted features that are used to construct the rules like packet sending rate and packet dropping rate caused a high false alarm for detecting attacks. Another drawback of this study is that it did not consider the power consumption rate related to the performance which is a very critical issue in WSNs.
4.7 Fuzzy Logic Intrusion Detection Scheme
for Directed Diffusion Based Sensor
Networks
Chi and Cho (2006) propose an intrusion detection scheme based on fuzzy logic. Some features of the traffic were extracted to build the fuzzy rules which are: node energy level, message transmission rate, neighbor nodes list and error rate in the transmission. The scheme was constructed to prevent and detect from the denial of service (DoS) attack which always drains the resources of the system.
The base station or some monitoring nodes will be responsible for collecting the information messages from the neighborhood and the detection value will be calculated by the fuzzy controller based on the four features mentioned above It is not clear how to choose the monitor nodes and how many nodes will be enough to protect the network. In addition, the need for an expert or sufficient experience to prepare the rule causes inadaptability of the scheme to detect new emerging attacks. Another drawback is that the chosen monitor node can be a point of failure if it is being compromised itself.
4.8 Fuzzy Logic Intrusion Detection Scheme
against Sinkhole Attacks in Directed
Diffusion Based Sensor Networks
Another fuzzy logic based intrusion detection approach has been proposed by Moon and Cho (2009) to detect sinkhole attacks in directed diffusion based sensor networks. Two features related to the directed diffusion protocols are used which are the reinforcement ratio and the radius. The reinforcement ratio is the proportion of the reinforcement messages transmitted in an area to the number of sensing events from the nodes. The radius is defined as the number of hop counts between any two nodes in the area. In the case of the sinkhole attack, there will be more reinforcement message traffic in area than the normal number and the number of hop count will be smaller. The fuzzy logic controller will use these two features as an input to generate its output which is the detection value. If the result detection value is greater than a predefined security threshold, the controller will raise an alarm that a sinkhole attack has taken place in the area. Prior to the calculation of the detection value, the fuzzy rules should be set by an expert according to the symptoms of the sinkhole attacks.
4.9 Intrusion Detection Based on Traffic
Analysis and Fuzzy Inference System in
WSN
Ponomarchuk and Seo (2010) introduced an intrusion detection scheme for WSN by utilizing two main traffic features: the packet reception rate and the packet inter-arrival time in a time window and then apply the fuzzy inference to decide whether an attack has taken place or not. However, this scheme is based on fuzzy logic, so it needs the rules to be prepared prior the detection process. The dependence on the prior knowledge which is the rules makes such schemes impractical for a continuous streaming environment like WSN. In addition, the authors did not specify certain attacks to be detected by this scheme.
Advantages of Rule-based intrusion detection schemes for WSN:
Fast detection: because there is no training involved in these schemes. This feature fulfills the need for online detection when there is a continuous streaming of data in some WSN applications
The computational complexity is not discussed here: since the schemes use only simple rules for detecting attacks
Higher detection accuracy: since it depends on comparison with some predefined rules.
5.
AUTONOMIC PROTECTION
SYSTEM
[image:4.595.313.572.80.279.2]The system is a cluster type of intrusion detection for wireless sensor networks, its structure after clustering is shown in Figure 2:
Fig 2. Clustering of wireless sensor networks diagram
In this system, at first, we make the following assumptions: • In the detection area, each node has the same resources and energy, between nodes is equivalent.
• The node is static in network, and the detection area is divided into clusters by the clustering algorithm, and clustering algorithm can automatically run on the basis of the conditions set by the algorithm.
• The common node of each cluster can directly communicate with the cluster head node or communicate through multi-hop. • The base station is a safe and unlimited resources, and can communicate with each elected cluster head node, it can form a new cluster with all the cluster head node based the base station on cluster head.
[image:4.595.56.268.421.570.2]Intrusion detection model of the scheme is shown in Figure 3. Protection system is placed in the big base station.
Fig 3. Autonomic Protection System
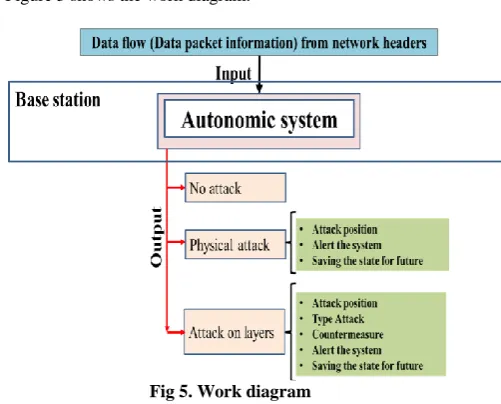
The protection system the objective of mechanism is to detect complex wireless attacks and generate counter measures to protect the WSN and the privacy of the users. It uses a set of measurement attributes collected from multiple headers in WSN that includes information from sensor nodes and packets. WSNetFlows are learned and mined to select the features that are most relevant to different types of normal traffic and attack.
Autonomic mechanism anomaly behavior analysis engine uses both standard and training based anomaly behavior analysis; and sends alerts to a prediction engine that determines the attack type, and sends different information about the attack and the attacker to the impact analysis module that determines the appropriate action based on risk analysis and pass that to the action handler to take the appropriate response as shown in Figure: 3
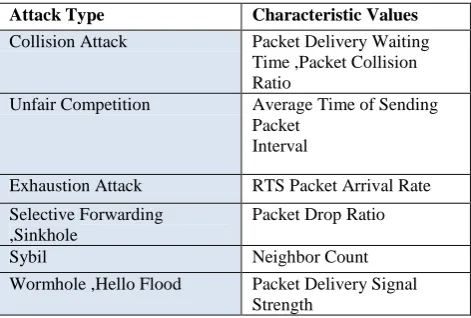
In the detection area of wireless sensor networks, data that each sensor node collected included: location information, routing information, history, information about network topology and node behavior information. It generates a feature vector for each Sensor node according to characteristic values that the above information showed in table 2, the table is the corresponding detected attack type and the corresponding characteristic values:
Table 2.attack type and the corresponding characteristic values
Attack Type Characteristic Values
Collision Attack Packet Delivery Waiting Time ,Packet Collision Ratio
Unfair Competition Average Time of Sending Packet
Interval
Exhaustion Attack RTS Packet Arrival Rate
Selective Forwarding ,Sinkhole
Packet Drop Ratio
Sybil Neighbor Count
[image:4.595.311.547.610.769.2]6.
PACKE
TRAFFIC
IN
WSN
SERVES AS THE DATA SOURCE OF
ANOMALY DETECTION
Packet traffic has been the most used data source in the anomaly detection for WSNs. The authors propose that an anomaly in WSNs could violate one of the following rules applied to packet traffic:
1) Interval rule: A failure is raised if the time which passes between the reception of two consecutive messages is larger or smaller than the allowed limits.
2) Retransmission rule: The monitor listens to a message, pertaining to one of its neighbors as its next hop, and expects that this node will forward the received message, which does not happen.
3) Integrity rule: The message payload must be the same along the path from its origin to a destination, considering that in the retransmission process there is no data aggregation by other sensor nodes.
4) Delay rule: The retransmission of a message by a monitor's neighbor must occur before a defined timeout.
5) Repetition rule: The same message can be retransmitted by the same neighbor only a limited number of times.
6) Radio transmission range: All messages listened to by the monitor must have originated (previous hop) from one of its neighbors.
7) Jamming rule: The number of collisions associated with a message sent by the monitor must be lower than the expected number in the network.
By regularly monitoring the violations of the listed rules, network anomalies will be detected.
7.
EVALUATING
AUTONOMC
SYSTEM (ANOMALY DETECTION
STRATIGY) FOR WSN
The two commonly used measurements for evaluating the performance of an anomaly detection strategy are the false positive rate (FP) and the false negative rate (FN). FP is defined as the proportion of normal events that are erroneously classified as abnormal. FN is defined as the proportion of abnormal events that are erroneously classified as normal. Obviously, a good anomaly detection strategy should have both a low FP and a low FN. However, a tradeoff is usually to be made between FP and FN, given that these two measurements are usually influenced in opposing ways, by adjusting the threshold parameters used in many anomaly detection strategies. In addition to FP and FN, the overhead introduced by an anomaly detection strategy is also a concern. Considering the extreme resource-constrained specialties of WSNs, a good anomaly detection strategy should introduce as little overhead as possible. Although WSNs are designed for low rate communication, a broad range of real-time applications, such as health care, highway traffic coordination and even multimedia transmission have also been proposed. When an anomaly detection strategy is designed for real-time applications, it should also fulfill the real-time requirement such that it will not cause performance degradation to the applications.
FP is measured as the number of normal records that are classified anomalous. False positive rate (FPR) is the percentage of normal records that are classified anomalous to the total number of normal records as shown in Equation 2 [16].
Equation 1
Equation 2
The number of normal records in the testing dataset is 3267 and the number of false positive detection is 73 leading to false positive rate of 2.234 %.
FP factor in equation 1 returns the sum of all false alerts within a period of time T. FPR in equation 2 returns the number of false alerts by the total number of collected frames during the same period of time T. FPR measures the percentage of faulty alerts per the total number of received frames. Systems that generate high false positive rates are not practical and less trusted by network administrators.
8.
DETECTION RATE
Detection measures the ability of a certain protection systems to detect wireless attacks. This ability is the degree of confidence that an evaluated protection system can indeed detect a certain type of attack. It is quantified as the probability that a certain protection system can detect a certain wireless sensor attacks.
The detection rate (DR) is computed as the percentage of times a certain attack type is detected when attacks from the same type are launched n times as given in Equation 3:
Equation 3
Where n is the total number of variations for attack type j; N(i,j) is 1 if the attack is detected and 0 if the attack is not detected. The total detection rate measures the wideness of detection for a certain protection system.
9.
RECEIVER OPERATION
CHARACTERISTIC
The ROC figure is used by different protection system evaluation methodologies [17, 18, and 19] to test and evaluate the accuracy of protection systems. We extend this approach to evaluate the protection system operation by considering both false alarms and detection rates. ROC shows the detection rate variations against higher or lower false-positive rate. While detection rate quantifies the ability of protection system to detect certain attacks, a high false positive rate can degrade the trust level because detection alerts might not be taken seriously by system administrators.
Fig 4.ROC Curve showing direct comparison between WSPS and AirDefense for 4 different types of attacks.
10.
EXPERIME_TAL RESULTS
10.1
Simulation parameters:
[image:6.595.313.564.194.396.2]Ns-2 simulator will be used to evaluation our work. Ns-2 is an object-oriented (OO) simulator, written in C++, with an OTcl interpreter as a front-end [20]. Simulation kernel, models, protocols and other components are implemented in C++, but are also accessible from OTcl. OTcl scripts are used for simulator configuration, setting up network topology, specifying scenarios, recording simulation results etc. Typical ns-2 OTcl script for wireless simulation begins with configuration command, which is used to specify PHY, MAC and routing protocol, radio propagation and antenna model, topology etc. The next step is creation of mobile nodes. Node movement and network traffic patterns are usually defined in separate files. Tools for generating these files are provided. The table 2 shows the simulation parameters:
Table 2. Simulation parameters
channel type Wireless Channel radio-propagation
model
Propagation/Two Ray Ground
network interface type Phy/Wireless Phy/802_15_4
MAC type Mac/802_15_4
interface queue type Queue/DropTail/PriQueue link layer type LL
antenna model Antenna/Omni Antenna max packet in ifq 100
number of sensor nodes
80
protocol type AODV
X dimension of topography
500 m
Y dimension of topography
500 m
simulation period 500 second Energy Model Energy Model
value Initial energy 100
number of CH (cluster head) nodes
8
number of base station node
1
10.2
Autonomic System Input And
Output
The proposed protection system can protect network from the following attacks:
Collision Attacks. Unfair Competition. Exhaustion Attacks
Selective Forwarding, Sinkhole. Sybil
Wormhole, Hello Flood. Figure 5 shows the work diagram.
Fig 5. Work diagram
The detection rates of normal and attack types are shown in Table 3.
Table 3. Detection Rate (DR) for different wireless sensor network attacks types
Type Size Number of
Detection DR
Collision Attacks.
530 512
96.60% Unfair
Competition.
530 499
94.15% Exhaustion
Attacks
530 480
90.56% Selective
Forwarding,
530 488
92.07%
Sybil 530 520 98.11%
Sinkhole. 530 500 94.33%
Wormhole 530 512 96.60%
Hello Flood. 530 499 94.15%
11.
CONCLUSION
[image:6.595.52.288.461.713.2]choosing attack characteristics can lead high false rate when detect some attacks. The aim of our future research is to choose appropriate characteristics to reduce false rate and increase the accuracy when detecting attacks.
12. REFERENCES
[1] Zhenwei Yu, Jeffrey J.P. Tsai,A Framework of Machine Learning Based Intrusion Detection for Wireless Sensor Networks, IEEE International Conference on Sensor Networks, Ubiquitous, and Trustworthy Computing,2008.
[2] Dorothy E. Denning,An intrusion detection model.IEEEransactions on Software Engineering.1987: 222-232.
[3] Youcai Zhou, Tinglei Huang, A Statistic Anomaly Intrusion Detection Method For WSN, Microcomputer information ,2009(in chinese).
[4] Libin Yang, Dejun Mu, XiaoyanCai, An Anomaly Detection Scheme for Wireless Sensor Networks Based on Kernel Clustering•, Chinese Journal of Sensors and Actuators•C2008.8(in chinese) .
[5] Wang Huaibin,YuanZhang.Intrusion Detection for Wireless Sensor Networks Based on Multi-agent and Refined Clustering[C].Communications and Mobile Computing•C2009:450-454
[6] Qi Zhu Rushun Song, YongxianYao,SVM-based cooperation intrusion detection system for WSN,Application Research of Computers,2010.4(in chinese).
[7] Yang Liu,YuFengqi,Immunity-based intrusion detection for wireless sensor networks,IEEE World Congress on Computational Intelligence•C2008.
[8] SarjounS.Doumit, Dharma P. Agrawal, Self-organized criticality and stochastic learning based intrusion detection system for wireless sensor networks, MILCoM :IEEE Military Communications Conference.2003.
[9] Demirkol, I., Alagoz, F., Delic, H., and Ersoy, C. (2006). Wireless sensor networks for intrusion detection: Packet traffic modeling. IEEE Communications Letters, 10(1):22--24.],
[10] Cui, S., Madan, R., Goldsmith, A. J., and Lall, S. (2005). Joint routing, mac, and link layer optimization in sensor networks with energy constraints. In Proc. of IEEE
International Conference on Communications (ICC'05), pages 725--729.
[11] Ma, Y. and Aylor, J. H. (2004). System lifetime optimization for heterogeneous sensor networks with a hub-spoke topology. IEEE Transactions on Mobile Computing, 3(3):286--294.
[12] Tang, S. (2006). An analytical traffic flow model for cluster-based wireless sensor networks.In Proc. of 1st International Symposium on Wireless Pervasive Computing.
[13] Paxson, V. and Floyd, S. (1995). Wide-area traffic: The failure of poisson modeling. IEEE/ACM Transactions on Networking, 3:226--244.
[14] Wang, Q. and Zhang, T. (2008). Source traffic modeling in wireless sensor networks for target tracking. In Proc. of the 5th ACM International Symposium on Performance Evaluation of Wireless Ad-Hoc, Sensor, and Ubiquitous Networks (PE-WASUN'08), pages 96--100.
[15] Wang, P. and Akyildiz, I. F. (2009). Spatial correlation and mobility aware traffic modeling for wireless sensor networks.In Proc. of IEEE Global Communications Conference (Globecom'09).
[16] W. Lee, S. J. Stolfo K. Mok, “A data mining framework for building intrusion detection models”, In Proc. IEEE Symposium on Security and Privacy, 1999.
[17] SJ Stolfo, W Lee, PK Chan, W Fan, E Eskin “Data mining-based intrusion detectors: an overview of the columbia IDS project” ACM SIGMOD Record, 2001 -portal.acm.org.
[18] Lippmann et al. “Evaluating intrusion detection systems: The 1998 DARPA offline intrusion detection evaluation”, In Proceedings of the on DARPA Information Survivability Conference and Exposition (DISCEX’00).
[19] J. McHugh. Testing intrusion detection systems: A critique of the 1998 and 1999 DARPA intrusion detection system evaluations as performed by Lincoln Laboratory.