Performance Analysis of Segmentation Techniques
Amandeep singh
E.C.E, Lovely Professional University near Phagwara Punjab, India
Jaspinder sidhu
E.C.E Lovely Professional University near Phagwara Punjab, India
ABSTRACT
This article presents the performance analysis of different segmentation techniques. Global thresholding, Adaptive thresholding, Region grow and Active contour using level set techniques has been used in this paper for proposed segmentation analysis. In this procedure flows as first by Appling segmentation technique to extract ROI from image and calculate the parameters from the resulting image obtained by the applied techniques. Parameters are PSNR and MSE. Segmentation techniques have been tested on medical and synthetic data sets and results are compared with each other. Tests indicate that using level set contour significantly improves the ability of extracting region of interest with unbroken boundaries and Adaptive thresholding acquires most of the details present in the image. Global thresholding have the highest success rate of extracting the region of interest.
General Terms
ROI –Region of interest
Keywords
Global threshold; Adaptive threshold; Region grow; Level set contour; Hybrid segmentation
1.
INTRODUCTION
The study present in this article is part of Mtech thesis in which we are aiming to develop a hybrid automated image segmentation system for segmentation of tumor present in medical images obtained by Computed Tomography (CT) scans. On the bases of these results we will decide which two segmentation methods are to be used for hybrid segmentation method. In bio medical images our main task is to segment the known anatomical structures pixels from the background pixels for research, cancer diagnosis, quantification of tissue volumes, radiotherapy treatment planning and study of anatomical structures. The Cancer diagnose can be manually performed by a human expert who simply examines an image, determines borders between regions, and classifies each region this process is called segmentation in terms of image processing. This is perhaps the most reliable and accurate method of image segmentation because the human visual system is immensely complex and well suited to the task. But the of human organs in CT scans using gray level information is particularly challenging due to the changing shape of organs in medical images and the gray level intensity overlap in soft tissues.
Segmentation method need to obtain two parameters first one is location of tumor in CT scan and second is obtaining the exact share of tumor by identifying its boundaries extracting .segmentation increase rate of similar CT interpretation between different analyzers. P. K. Sahoo et al [1] [2] Thresholding is one of the most basic techniques for segmenting an image. Thresholding is a pixel level operation in which intensity of pixel is compared with a threshold any
intensity value above threshold is converted into 1 and all the value below threshold is converted into 0 which make a binary image. Binary image is resulting of thresholding segmentation in which 0 resembles the black color and 1 indicates the white color .each segmented object from n biomedical image resembles an internal organ. Adaptive thresholding is an advanced version of global thresholding in which we apply different threshold for different locations in the imagee.Adaptive threshold is also known as dynamic thresholding which have several methods under the category. Adaptive thresholding can be performed by using Mean, Median, Distance, Energy etc method. Conceder an equation Z(x, y) in image procession field this equation represents the pixel location in the image. Whenever the pixel location intensity is greater than T which is given threshold the location is converted to 1 otherwise to 0.
Z(x, y) =1 if f(x, y) ≥ T
0 otherwise
Biomedical images are in gray scale which have very less intensity difference in so it is very difficult to separate objects of interest. N. Otsu et al [3] [4] Global Thresholding use a single threshold for entire image. Which is easy and fast operation as compare to adaptive thresholding which need threshold calculation time for different regions of image which in a complex process.
Another is Region-growing, this process try to make a bunch of pixels which are having similar gray scale. Region growing approach simply take a point in an image which is called as seed point and grow the region surround this seed point by joining the neighboring pixels to region. Basically the seed point is location of threshold selection to create a region all the neighboring pixels having same intensity will join to region. When the growth of one region stops we simply choose another seed pixel which does not yet belong to any region and start again. This whole process is continued until all pixels belong to some region. When Multiple region to be segmented by region growing segmentation it provide a advantage of dynamic thresholding each seed point at different place of image probably have different intensity and al the neighboring pixels will join to region according to their seed point intensity. Region growing methods often give very good segmentations that correspond well to the observed edges Region Growing has several advantages over conventional segmentation techniques. Unlike gradient and Laplacian methods, the borders of regions found by region growing are perfectly thin and connected. The algorithm is also very stable with respect to noise. Region will never contain too much of the background, so long as the parameters are defined correctly. Other techniques that produce connected edges, like boundary tracking, are very unstable.
image. Active contours, or snakes, are computer-generated curves that move within images to find object boundaries. They are often used in computer vision and image analysis to detect and locate objects, and to describe their shape. The snake will be more likely to be attracted to the cell boundaries if you draw the initial contour outside the cell. This is because the interiors of the cells are noisy and therefore the image gradient does not attract the snake as strongly toward the cell boundaries as it does when the snake is initialized outside the cells.C.M. Li et al [5] There are two principal approaches to build an active contour: explicit or Lagrangian approach, and resulting interfaces called snakes, implicit or Eulerian approach, and resulting interfaces called level sets. These methods are used in the domain of image processing to locate the contour of an object. In this paper we use level set contour method along with other methods for analysis. Thus this paper is focusing on a finding out the optimal segmentation method for wide range of images conclusion of this paper will uncover the performance of implemented segmentation technique on various set of images.
The paper is organized as follow. Methodology used in this research paper is explained in section 2 which explains the parameter used in comparison of different techniques, simulation results have been summarized on tables to show the performance and the comparison of applied methods which are uncovered in section 3. Finally, the paper is concluded in section 4.
2.
METHODOLOGY
The PSNR is abbreviated as peak signal to noise ratio and it is most commonly used as a measure of quality of reconstruction. The signal in this case is the original data, and the added noise is the salt paper noise and error introduced by segmentation methods during process of segmentation. Salt paper noise is used because it represents loss in binary transmission as the resulting hybrid segmentation method constructed using 2 most efficient segmentation methods declared in this research will be installed in an computer and CT scan is transmitted to it digitally for segmentation to computer. We also used PSNR and MSE because they have high approximation to human perception of reconstruction quality; a higher PSNR would normally indicate that the segmented image is of higher quality. The comparison of different segmentation methods using these parameters will describe the optimal performance of particular segmentation method in terms of human perception. The MSE is abbreviated as mean squared error which for two m×n monochrome images I and K where one of the images is considered a noisy approximation of the other is defined as:
MSE = 1/mn
1 0 m i
1 0 n j[I(I,j) –k(i.j)]2
The PSNR is defined as:
PSNR = 10.log10(MAXI 2/ MSE)
= 20.log10(MAXI) – 10.log10(MSE)
Here, MAXI is the maximum possible pixel value of the image. When the pixels are represented using 8 bits per sample, this is 255. More generally, the definition of PSNR is the same except the MSE is the sum over all squared value differences divided by image size and by three. The lower MSE values show the better performance in presence of noise by the corresponding image segmentation method algorithm.
Fig 1. Process Diagram
The process diagram is shown in fig 1., here it is clearly given the steps that we are going to follow first of all we have image than noise addition and on that we apply segmentation techniques that we already discussed in introduction, next PSNR and MSE comparison is done and the result of that is shown in the tables given in next section.
3.
RESULTS
The results of segmentation methods are obtained on wide range of images each image in result is used in this analysis have its unique gray scale variation and object details. The images used are divided into dataset of shape edge images, normal image, multi object images and biomedical image. The eye image and bone images counted under the data set of sharp edge images because the boundaries of objects present in these images are very sharp each object can be clearly differentiated from other object. Lena image is considered in normal image dataset because this image have mix edges considering both sharp and smooth and intensity variation is also speeded over all portion of image . frog and hex shape image are considered under the multiple object dataset of image these image have two or more number of objects. Frog image is further said to be a multi object shape edge image this help to calculate the performance of segmentation algorithm over image where Sharpe edges are present in multiple objects. Hex shape image have normal edges but high intensity variation between different number of objects the results of segmentation on this image is also contributing enormously because this image help to understand how an segmentation method respond to different intensity variations. Biomedical image dataset have two cell images is to uncover the performance of segmentation method on biomedical images. Research algorithms are applied to various formats of images and results are given below.
IMAGE NOISE ADDITION
SEGMENTATION TECHNIQUES PSNR & MSE
COMPARISION
(a) (b) (c) (d) (e) (f)
Fig 2. Segmentation results for Eye image .(a) Original eye image effected by salt paper noise (b) Global threshold applied on original eye image (c) Result of Adaptive threshold segmentation applied on eye image.(d) Eye image result of region grow thin segmentation (e) Eye image result of region grow thin segmentation (c) Result of Level set segmentation applied on eye image.
(a) (b) (c) (d) (e) (f) Fig3.Segmentation results for Bone image .(a) Original bone image effected by salt paper noise (b) Global threshold applied on original bone image (c) Result of Adaptive threshold segmentation applied on bone image.(d) Bone image result of region grow thin segmentation (e) Bone image result of region grow thin segmentation (c) Result of Level set segmentation applied on
Bone image.
[image:3.595.69.515.232.350.2](a) (b) (c) (d) (e) (f)
Fig. 4. Segmentation results for Lena image .(a) Original lena image effected by salt paper noise (b) Global threshold applied on original lena image (c) Result of Adaptive threshold segmentation applied on lena image.(d) Lena image result of region grow thin segmentation (e) Lena image result of region grow thin segmentation (c) Result of Level set segmentation applied
on lena image.
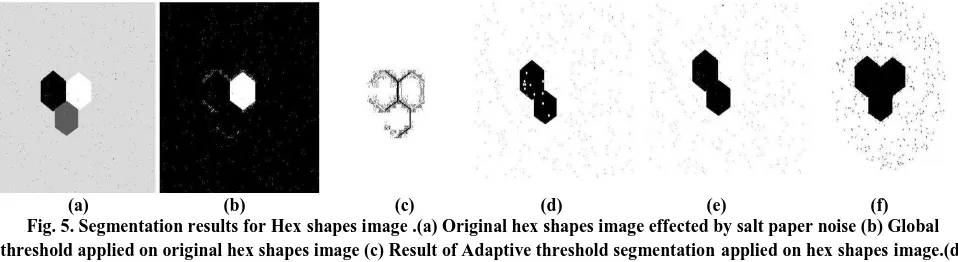
(a) (b) (c) (d) (e) (f) Fig. 5. Segmentation results for Hex shapes image .(a) Original hex shapes image effected by salt paper noise (b) Global threshold applied on original hex shapes image (c) Result of Adaptive threshold segmentationapplied on hex shapesimage.(d)
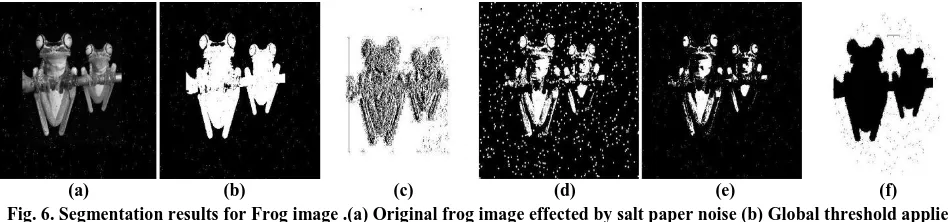
[image:3.595.56.535.578.709.2](a) (b) (c) (d) (e) (f) Fig. 6. Segmentation results for Frog image .(a) Original frog image effected by salt paper noise (b) Global threshold applied
on original frog image (c) Result of Adaptive threshold segmentation applied on frog image.(d) Frog image result of region grow thin segmentation (e) Frog image result of region grow thin segmentation (c) Result of Level set segmentation applied
on frog image.
[image:4.595.56.528.230.321.2](a) (b) (c) (d) (e) (f)
Fig. 7. Segmentation results for Frog image.(a) Original frog image effected by salt paper noise (b) Global threshold applied on original frog image (c) Result of Adaptive threshold segmentation applied on frog image.(d) Frog image result of region grow thin segmentation (e) Frog image result of region grow thin segmentation (c) Result of Level set segmentation applied on frog
image.
Table 1. Results of PSNR and MSE applied on segmentation methods using Eye image.
[image:4.595.45.570.394.464.2]Eye Image
Global threshold Adaptive threshold
Region gorw thick
Region grow thin
Level set
PSNR
58.43
53.26
58.33
58.41
17.71
PSNR_N
10.3
5.13
10.2
10.28
-30.41
MSE
0.0933
0.3067
0.0954
0.0937
1.10E+03
Table 2. Results of PSNR and MSE applied on segmentation methods using Bone image.
Bone image
Global threshold
Adaptive threshold
Region gorw thick
Region grow thin
Level set
PSNR
62.13
64.5604
72.12
67.42
14.13
PSNR_N
14
16.42
23.99
19.29
-33.99
MSE
0.0398
0.0228
0.004
0.0118
2.51E+03
Table 3. Results of PSNR and MSE applied on segmentation methods using Lena image.
[image:4.595.48.568.687.761.2]Lena image
Global threshold Adaptive threshold
Region gorw thick
Region grow thin
Level set
PSNR
56.93
53.85
56.67
56.84
18.59
PSNR_N
8.8
5.722
8.54
8.71
-29.53
MSE
0.131
0.2678
0.139
0.134
898.37
Table 4. Results of PSNR and MSE applied on segmentation methods using Frog image.
Table 5. Results of PSNR and MSE applied on segmentation methods using Hex image.
Hex image
Global threshold Adaptive threshold
Region gorw thick
Region grow thin
Level set
PSNR
49.81
60.6946
64.01
63.33
16.17
PSNR_N
1.68
12.563
15.88
15.202
-31.95
MSE
0.6792
0.055
0.0258
0.0302
1.57E+03
Table 6. Results of PSNR and MSE applied on segmentation methods using Two cell image.
[image:5.595.56.558.270.591.2]Cell image
Global threshold Adaptive threshold
Region gorw thick
Region grow thin
Level set
PSNR
57.9
53.11
58.9
60.12
27.7401
PSNR_N
9.77
4.98
10.77
11.98
-20.39
MSE
0.105
0.3172
0.083
0.063
109.41
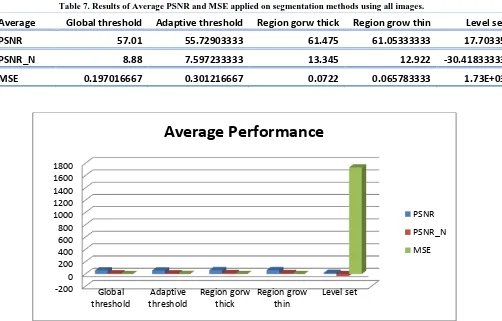
Table 7. Results of Average PSNR and MSE applied on segmentation methods using all images.
Average
Global threshold Adaptive threshold
Region gorw thick
Region grow thin
Level set
PSNR
57.01
55.72903333
61.475
61.05333333
17.70335
PSNR_N
8.88
7.597233333
13.345
12.922 -30.41833333
MSE
0.197016667
0.301216667
0.0722
0.065783333
1.73E+03
Fig 8. Graphical representation of performance of segmentation methods
.
4.
CONCLUSION
The image segmentation is a relevant technique in image processing. Numerous and varied methods exist for many applications. Now that we have described the algorithms, we can compare the outputs and check which type of segmentation technique is better for a particular format. It is believed that there are two key factors which allow for the use of a segmentation algorithm in a larger object detection system: correctness and stability. On an average parameter set of the edge detection techniques, Region grow thick technique performed better than all other techniques for all the formats of images, sample of which can be found in results by
analytically comparing the values on PSNR region grow thick have highest average PSNR. The same is reflected by lower value of MSE after segmentation. Care should be taken in case of region growing segmentation technique that proper seed point is selected and range of threshold is properly defined. This method performs well even when noise is high. Histogram based methods are found to be very efficient in terms of computation complexity when compared to other image segmentation methods. If significant peaks and valleys are identified properly and proper thresholding is fixed, this technique yields good result. Global thresholging have good high vales of PSNR and low values of MSE which indicate its good efficiency over wide range of images. The adaptive -200
0 200 400 600 800 1000 1200 1400 1600 1800
Global threshold
Adaptive threshold
Region gorw thick
Region grow thin
Level set
Average Performance
PSNR
PSNR_N
Thresholding had performed reasonably well on wide range of images its performance is slightly lower than global thresholding we can clearly see this in average table 7. The level set algorithm is guaranteed to converge but it may not return optimal solution for details of images, level set gives unbroken edges of objects that it segments. For hybrid segmentation top two efficient methods are region growing and global thresholding but our primary task is to make hybrid segmentation method with can perform segmentation with minimal user interaction as we know global thresholding need maximum user interaction because threshold is given manually. As the adaptive thresholding perform early close to global thresholding and adaptive thresholding is an automatic procedure of segmentation it is a better choice for hybrid segmentation. Region grow and Adaptive thresholding will be used for creating an hybrid segmentation method.
5.
ACKNOWDEGEMENT
The author is thankful to all the staff members of the School of ECE, lovely professional university for their valuable support
.
6.
REFERENCES
[1] P. K. Sahoo, S. Soltani and A. K. C. Wong, “A Survey of Thresholding Techniques”, Computer Vision, Graphics, and Image Processing, vol. 41, 133-260 (1988).
[2] J. S. Weszka, R. N. Nagel, and A. Rosenfeld, “A threshold selection technique”, IEEE Trans. Comput., vol. C-23, pp. 1322-1326, 1974
[3] N. Otsu, “A Threshold Selection Method from Gray-Level Histograms”, IEEE Trans.Syst., Man, cybern., vol. SMC-9 (1), pp. 62-66, Jan. 1979 Ding, W. and Marchionini, G. 1997 A Study on Video Browsing Strategies. Technical Report. University of Maryland at College Park.
[4] N. R. Pal and S. K. Pal, “A Review on Image Segmentation Techniques”, PatternRecognition, vol. 26, No. 9, pp. 1277-1294, 1993.
[5] C.M. Li, C.Y. Xu, C.F. Gui, M.D. Fox, Level set evolution without re-initialization: a new variational
formulation, in: IEEE Conference on Computer Vision and Pattern Recognition, San Diego, 2005, pp. 430–436. [6] Caselles, R. Kimmel, G. Sapiro, Geodesic active
contours, in: Processing of IEEE International Conference on Computer Vision’95, Boston, MA, 1995, pp. 694–699.
[7] Farzaneh Keyvanfard” Feature selection and classification of breast MRI image “Artificial Intelligence and Signal Processing AISP 2011 International Symposium on (2011) pp. 54 – 58
[8] N. Lee et al., “Fatty and fibroglandular tissue volumes in the breastsof women 20-83 years old: Comparison of X-ray mammography andcomputer-assisted MR imaging,” Amer. J. Roentgenol., vol. 168, pp.501–506, 1997. [9] L. Ludemann, P. Wust, and J. Gellermann, “Perfusion
measurement using DCE-MRI: Implications for hyperthermia,” Int. J. Hyperthermia,vol. 24, no. 1, pp. 91–96, 2008.
[10] N. Senthilkumaran et al,” Edge Detection Techniques for Image segmentation – A Survey of Soft Computing Approaches” nternational Journal of Recent Trends in Engineering, Vol. 1, No. 2, May 2009
[11] A. Korpel, " Acousto-Optics," in Applied Solid State Science, R. Wolfe, ed.,vol.3, Academic, New York (1972).
[12] Shudong Wu, Feng Cheng and Francis T.S.YU, “Pattern recognition by OTF method”, J.Optics (paris), vol.20, 5, pp 201-204, 1989.
[13] Joseph Rosen, “Three-dimensional optical Fourier transform and correlation”, Vol.22, No. 13, Optics Letters, 964-966, July 1, 1997