Axes Re-ordering in Parallel Coordinate for
Pattern Optimization
ABSTRACT
Visualization of multidimensional dataset is a challenging task due to non-uniformity of the data. It requires new ways to display data for better analysis and interpretation. Parallel coordinate is one of the popular techniques for visualization of multi dimensional dataset. Parallel coordinate technique emphasis various types of patterns present in the dataset. Here, pattern is shown by a poly-line. Slope of poly-line indicates the difference between data values. Variation in slope creates the different types of pattern. Based on slope, pattern can be classified and this kind of classification helps to explore distinct pattern available in dataset. Ordering of the axis affects pattern available in any dataset. Specific arrangement of axis may provide maximum patterns and another arrangement may provide minimum patterns. Ordering of axis in different order to find maximum or minimum pattern requires exponential time. Here, we propose a novel clustering technique using heuristic based branch & bound based axis reordering mechanism to solve this problem in polynomial time.
Keywords
: Visualization, Parallel Coordinates,Cluttering, Clustering, Outlier, pattren ;
1.
INTRODUCTION
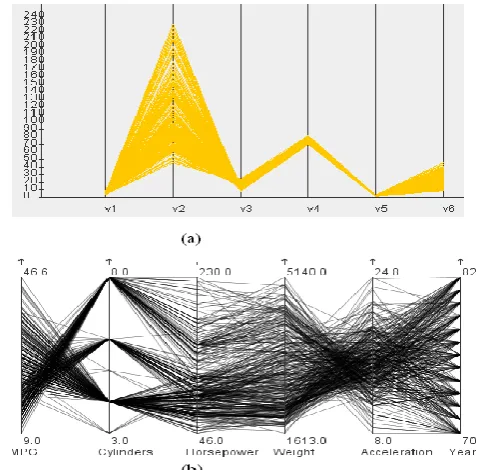
[image:1.595.328.556.244.403.2]Interpretation of complex pattern and information gathering become difficult when data sets become large and complex. We require new ways/techniques to display, analyze, filter and interpret the information contained in it. As data sets become huge and complex, new problems comes. Cluttering (too much data at once tends to confuse viewers) is most fundamental problem of visualization techniques. Cluttering becomes more prominent problem in case of parallel coordinates (See Fig.1). Since clutter hides important data/pattern. It is necessary to reduce the clutters. Hence it can unhide the new trends and patterns from same data sets. Clutter is the state in which excess items, or their representation lead to a degradation of performance of some task. According to Ruth Rosenholtz as data size increases visual clutter increases rapidly (as shown in Fig.1). Taxonomy of clutter reduction techniques has been proposed by Geoffrey Ellis and Alan Dix [1].
Fig. 1: A car dataset visualization using parallel coordinates. Rectangles are used to illustrate the visual cluttering [2].
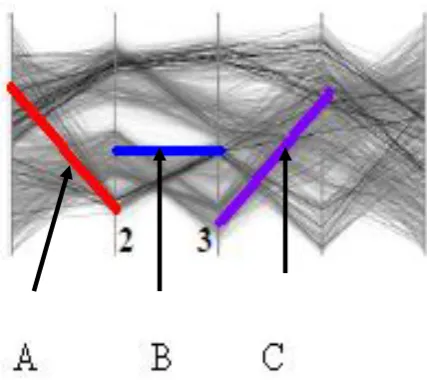
They Analyses a large number of clutter reduction methods, classifying them both in terms of how they deal with clutter reduction and more importantly, in terms of the benefits and losses Sampling, Clustering, dimensional reordering are the popular clutter reduction techniques. In parallel coordinate visualization clutter appears due to outlier and crossing of edges. Grouping of similar object reduces the crossing of edges hence clustering reduces both problem associated with parallel coordinates up to some extend. Patterns can classify based on slope and such pattern based clustering can significantly reduces the crossing of edges and handle the outlier problem effectively (shown in Fig. 2). These patterns are depend on size and scale of axes (shown in Fig. 8) and more greatly depend upon the ordering of axis. Rearrangement of axis produces different sets (number of pattern also changes in each set) of patterns for same dataset. For same dataset some order of axis provides maximum number of patterns. Similarly some another order of axis provides minimum number of patterns. This may lead to find the maximum available patterns in any dataset. It can extend to find specific pattern in dataset. This type of clustering technique may provide a mechanism to reduce clutter as well as outlier problem.
2.
RELATED WORK
Basic purpose of clustering is to group the similar data element in one cluster [3, 4]. Geoffrey Ellis and Alan Dix also proposed a metrics for clutter measurement [5]. Proposed techniques used with random sampling and compute cluttering in specified circular area (Lens area). Since cluttering may be spread in
Hemant Makwana
Reader
Department of Information Technology
Institute of Engineering & Technology Devi Ahilya University
Indore, India
Sanjay Tanwani
Professor
School of Computer Sciences & Information Technology
Devi Ahilya University Indore, India
Suresh Jain
Professor, Computer Science &
Engineering KCB Technical Academy
whole area. So for exactly computation of clutters, it requires calculation in whole area. Clusters may be overlapping or hierarchical structure in nature.
Fig. 2: Slope category A, B and C of data sets in Parallel coordinates.
Displaying properties and structure of subset in parallel coordinates is done by Andrienko and Andrienko using striped envelopes and ellipse plots methods [6]. Both of these methods are based on dividing the value range of each axis into equal frequency intervals. Since striped envelops and ellipse plots methods convey information about each variable independently of each other. It is difficult to find the relationship between two adjacent dimensions. Similar kind of approach is presented by Novotny [7]. Novotny has represented each cluster as envelop or polygon. In his work, he uses different striped textures to represent the clusters. This kind of approach provides the detail structure of clusters but does not provide the relevant aspect of the structure within the cluster. All the above mentioned methods are also suffers from visual cluttering. Miller and Wegman suggested line density plots to overcome the problem [8]. Where Wegman and Luo proposed density plots [9]. It provides a visual search in parallel coordinate using rendering of each line with a user defined transparency value. Rodriques et al. analyses the cluttered parallel coordinates using frequency plots and highlighted highly populated region [10]. Feature animation technique makes it possible to visually represent statistical information about clusters and thus guides the user, making the analysis process more efficient. A comprehensive review of data clustering algorithms is given by A.K. Jain and F. Murtagh focusing on massive dataset [11, 12]. These do not deal directly with display clutter but they provide a means of preprocessing the data into a more manageable set. Hong Zhou presents a framework to reduce edge clutter, consequently improving the effectiveness of visual clustering [13]. Previous work on reducing clutter in parallel coordinates has applied methods such as sampling, reordering, clustering, attribute combination and transparency. Dimensional reordering is used by Peng et al [14] to minimize the impact from outliers. They define outlier in terms of closeness of line. They also define clutter in terms of outlier. Hierarchical clustering [15, 16] is another clutter reduction techniques
tree of nested clusters of poly-lines. User can interact with system by assigning appropriate use of transparency, this helps to differentiate between clusters; in addition, proximity-based coloring aids the separation. As with all aggregate functions, this technique tends to remove the detail, but one can see trends in an otherwise saturated display. Same Visual clutter reduction through clustering is done by Arteor et at [17]. In their algorithm uses frequency data, this is based on counting coincident lines and then smoothes the data to produce a „density map‟. Which has the effect of grouping lines that are fairly close to each other as well as those that are coincident? Artero et al did not attempt to measure the occlusion of the lines. VisCluster [18] used different approach to reduce the clutters. In their works they reduced clutter by combining adjacent dimensions for high dimensional dataset. Ruth Rosenholtz, Yuanzhen Li, Jonathan Mansfield, and Zhenlan Jin [19] mentioned the ways to measure the clutter.
3.
PROPOSED METHOD
3.1
Pattern based Clustering:
Clustering algorithm groups‟ objects or dataset based on similarity between pairs of objects [3].
Let E be a set of K N-dimensional dataset, i.e.
E = {e1, e2, e3,…………,ek }, Where ek is an N- vector data
element. ei= {xi1, xi2, xi3,…,xiN} for i ≤ k;
E is divided into m subsets {P1, P2, P3,…………,PM} Satisfying
the following two criteria:
Pi ∩ Pj = Ø for all 1 ≤ i, j ≤ m, i≠j;
E Pi
m
i
1
(1)
(
|
|
)
1
/ 1
N
i
i f
p
D
q
q
p
(2)
Here, D denotes the distance between qi and qf, where qi and qf
denote initial and final data points respectively. For Euclidean distance value of p is 2.
Classify the dataset based on slope of poli-line as shown in Fig. 2. Slope is divided into three categories (g=3) according to the following simple rule:
a) If slope is negative then the category is A b) If slope is 0 then the category is B c) If slope is positive then the category is C
Initially, slope is divided in to three basic categories. Further, it can be sub-divided into more categories. Based on the above mentioned criterion data can be classified and patterns can be prepared as shown in Fig. 3. Data sets which have same pattern will belong to the same cluster. Hence
S = P and
Fig. 3: Polylines representing various patterns.
3.2 Pattern maximization:
Numbers of patterns depend upon order of axis. Changing the order of axis create different set of patterns. So what could be the best arrangement of axis that provides the maximum or minimum no. of patterns? Empirical study shows that if distribution of slope (a, b or c) in a column is almost equal (as shown in example) then it leads to sequence that having minimum no. of patterns and if distribution is odd then this sequence leads to maximum no. of patterns. Hence axis ordering according to slope distribution provides higher no. of patterns.
3.3 Approach:
[image:3.595.328.548.211.371.2]First generate a table (called difference table) that will store n*(n-1)/2 column (as shown in example) and frequency of each slope (a, b or c). Using above criteria arrange the axis from most equal distribution to least equal distribution. This kind of arrangement will give min. no. of pattern to max. no. of pattern available in any dataset. Using branch-and-bound algorithm finds the optimal order of axes (Approach is illustrated through Fig. 4).
Fig. 4: illustration of approach.
4.
EXPERIMENTS AND RESULTS
In this section, demonstrates the effectiveness of our approach through the experiments on several dataset.
4.1 Synthetic Dataset:
First we examined the effectiveness of our proposed method on some synthesized dataset with simple patterns. Synthesized database consists of four dimensions and ten data values. Data values are chosen so that, for specific arrangement of axes (D1, D2, D3, D4 having one pattern) it provides minimum no. of patterns and for another arrangement of axes ((D1, D3, D4, D2 having eight patterns) it provides maximum no. of patterns. After performing the exercise it is verified that both the sequences of axes. Also find some additional sequence order of axes, which have eight numbers of patterns (dataset illustrated in Fig. 5).
Fig. 5: Illustrating the dataset. (a) Synthetic data sets. (b) Difference table. (c) Frequency table.
[image:3.595.94.315.446.691.2]Above experiment demonstrate clearly that approach identifies the maximum or minimum distinct patterns available in database. One advantage of minimum patterns is that it demonstrate minimum clutter (illustrating in Fig. 6) while second picture demonstrate distinct patterns. This kind of clustering scheme can effectively reduce visual clutter and enhance patterns. To verify this approach it requires testing on various dataset. Hence this approach is tested with more sophisticated multivariate dataset.
Fig 6: Illustrate the Patterns available in synthetic dataset. (a) Illustrate the minimum pattern. (b) Illustrate maximum
available patterns.
4.2
Dataset Selection criteria:
[image:3.595.322.543.510.626.2]Fig 7: Illustrating the patterns available in out5D dataset. (a) Illustrate the minimum patterns. (b) Illustrate maximum patterns (based on re -ordering of
axes).
4.3
Out5D Dataset
The out5d consist of 16384 values and five attributes (spot, magnetics, and three radiometrics channels - potassium, thorium, and uranium) of remote sensed data. Parallel Coordinate‟s matrix view that shows all available patterns of specific combinations of axes left top of the display with both axes pointing in the same direction (Fig. 7). List of available patterns are shown in list box available at right side of display. In our prototype implementation, theuser can construct the parallel coordinates display by selecting any axis order from its choice. User can select dataset interface produces difference table, frequency table and generate sequences of axes that provide the maximum and minimum patterns as shown in the Fig. 7.
In our experiment tested this approach with synthetic dataset and then with standard and small size dataset (Iris) and finally experiment with dataset having higher dimensions (Wine) and have large range of values (Out5D). Comparative study is shown in table 1.
Fig 8: Demonstrate the appearance same data sets (Car dataset) on different scale of axis. (a) Representing the data
with same scale and (b) Representing on different scale.
5.
CONCLUSION & FUTURE
ENHANCEMENTS
Patterns are greatly depends upon presentation of data, like data range are equally distributed over axes or not.Display of data values on same scale highlight fewer patterns then display of data values on unequal scale (As shown in Fig. 8). Patterns are depends upon the sequence of axis. There are some sequences of axes that provide maximum or minimum number of patterns available in dataset. Sequence that produce maximum patterns indicates level of variations among data. It is useful when user is interested in finding a specific pattern that is available or not. That could be an interaction technique. In future enhancement, this method may be extends as interaction method for parallel coordinates technique. Also this method may lead to explore the hidden patterns in dataset hence it could be useful for data mining. This method may be extend as interaction method for other visualization techniques. The sequence that produces minimum patterns indicates similarity between data. It visualizes data with less clutters hence it enhances the readability and understandability. Finally it provide enhancement for better understanding of data for analysis. In future enhancements it could be useful for clustering and finding level of similarity among data. It may be extend as clutter reduction for parallel coordinate as well as other visualization techniques.
Table 1: Results of experiments with various datasets (details of dataset mentioned in annexure A).
Da ta Set s No . o f Dimen sio n Da ta s ize M in imu m n um ber o f a v a ila ble pa tt er ns Sequ ence o f a x es f o r m ini mu m pa tt er ns M a x imu m no . o f a v a ila ble pa tt er ns Sequ ence o f a x es f o r ma x imum pa tt er ns
Synthetic data 4 10 1 v1,v2,v3,v4 8 v1,v3,v4,v2
Iris 4 150
1
v2,v1,v4,v3 4 v3,v1,v4,v2Wine 12 178 14 v7,v2,v3,v4,v5,v8,v9,
v10,v6,v11,v12,v13
41 v13,v11,v2,v9,v3,v5, v8,v4,v6,v7,v10,v12
[image:4.595.91.317.71.237.2]6.
REFERENCES
[1] Ellis G., Dix A., “A taxonomy of clutter reduction for information visualization.” IEEE Trans. on Vis. And Comp. Graph. 13, 6, 1216–1223, (2007).
[2] H. Zhou, X. Yuan, H. Qu, W. Cui, and B. Chen. “Visual clustering in parallel coordinates”, Computer Graphics Forum, 27(3): 1047-1054, 2008.
[3] D. Hand, H. Mannila, and P. Smyth. “Principles of Data Mining.” MIT Press, 2001.
[4] G. Ellis and A. Dix. “Enabling automatic clutter reduction in parallel coordinate plots.” IEEE Transactions on Visualization and Computer Graphics, 12(5), 717–724, 2006.
[5] T. Hastie, R. Tibshirani, and J. Friedman. “The Elements of Statistical Learning.” Springer-Verlag, 2001.
[6] G. Andrienko and N. Andrienko. “Parallel coordinates for exploring properties of subsets.” In 2nd IEEE International Conference on Coordinated and Multiple Views in Exploratory Visualization, pages 93–104, 2004.
[7] M. Novotny. “Visually effective information visualization of large data.” In 8th Central European Seminar on Computer Graphics (CESCG 2004), pages 41–48, 2004.
[8] J. J. Miller and E. J. Wegman. “Construction of line densities for parallel coordinate plots.” Computing and Graphics in Statistics, pages 107– 123, 1992.
[9] E. J. Wegman and Q. Luo. “High dimensional clustering using Parallel coordinates and the grand tour.” Technical Report 124, Fairfax, Virginia 22030, U.S.A., 1996.
[10] J. F. Rodriques Jr., A. J. Traina, and C. Traina Jr. “Frequency plot and relevance plot to enhance visual data exploration.” In XVI Brazilian
Symposium on Computer Graphics and Image Processing, pages 117– 124, 2003.
[11] A.K. Jain, M.N. Murty and P.J. Flynn, “Data Clustering: A Review.” ACM Computing Surveys, 31(3), pages 264-323, Sept 1999.
[12] F. Murtagh, "Clustering in Massive Data Sets", Chemical Data Analysis in the Large, Proc. Beilstein-Institut Workshop, May, 2000,
[13] ZHOU H., YUAN X., QU H., CUI W., and CHEN B. “Visual clustering in parallel coordinates.” Computer Graphics Forum 27, 3, 1047–1054, 2008.
[14] Wei Peng, Matthew O. Ward and Elke A. Rundensteiner, "Clutter Reduction in Multi-Dimensional Data Visualization Using Dimension Reordering." IEEE Symposium on Information Visualization 2004 (InfoVis 2004), pp 89 - 96, October 2004.
[15] Y. H. Fua, M. O.Ward, and E. A. Rundensteiner. “Hierarchical parallel coordinates for exploration of large datasets.” In Proc. Visualization‟99, pages 43–50, 1999.
[16] J. Yang, M.O. Ward, E.A. Rundensteiner and S. Huang. “Interactive hierarchical displays: a general framework for visualization and exploration of large multivariate data sets.” Computers and Graphics, 27(2), pp. 265-283, Apr 2003.
[17] A.O. Artero, M.C. Ferreira de Oliveira and H. Levkowitz.Uncovering, “Clusters in Crowded Parallel Coordinates Visualizations.” Infovis, pp. 131-136, 2004
[18] L. Zhang, C. Tang, Y. Shi, Y. Song, A. Zhang and M.Ramanathan, “VizCluster and Its Application on Clustering Gene Expression Data.” Distributed and Parallel Databases, 13(1) , pp. 73-97, 2003,
[19] Ruth Rosenholtz, Yuanzhen Li, Jonathan Mansfield, and Zhenlan Jin, “Feature congestion: a measure of display clutter.” Proceedings of the SIGCHI Conference on Human Factors in Computing Systems, page761, 2005.
Annexure A: Details of Data set.
Data Sets No. of Dimension
Data size
Attribute name Reference name used in paper
Out5D 5 16384 Spot V1
Mag V2
Potas V3
Thor V4
Uran V5
Iris 4 150 Petal_Width V1
Petal_Length V2
Sepal_Width V3
Sepal_Length V4
Wine 12 178 Malic acid V1
Ash V2
Alcalinity of ash V3
Magnesium V4
Total phenols V5
Flavanoids V6
Nonflavanoid phenols V7
Proanthocyanins V8
Color Intensity V9
Hue V10
OD280/OD315 of diluted wines V11
![Fig. 1: A car dataset visualization using parallel coordinates. Rectangles are used to illustrate the visual cluttering [2]](https://thumb-us.123doks.com/thumbv2/123dok_us/8123994.794987/1.595.328.556.244.403/dataset-visualization-parallel-coordinates-rectangles-illustrate-visual-cluttering.webp)