Munich Personal RePEc Archive
Investment Basics XLIV: Review of
African stock markets
Mlambo, Chipo and Biekpe, Nicholas
University of Stellenbosch Business School
October 2001
Online at
https://mpra.ub.uni-muenchen.de/24973/
Number 54 - Part 5
C Mlambo and N Biekpe*
Investment Basics XLIV
Review of African stock markets
* Graduat e School of Business, Universit y of St ellenbosch, PO Box 610, Bellville 7535, Republic of Sout h Africa. Em ail: nbiekpe@usb.sun.ac.za
1 . I n t r odu ct ion
The em ergence of African st ock m arket s was m ost ly driven by t he desire t o privat ise st at e- owned ent erprises. This em ergence is concent rat ed bet ween t he lat e 1980s and early 1990s, a period t hat wit nessed a num ber of financial liberalisat ion program s in Africa ( Bekaert and Harvey, 2001) . Privat isat ion raised t he prospect s of fully int egrat ing Africa int o t he global econom y ( Mat e, 2000) . Wit h t he shift of int erest from foreign direct invest m ent ( FDI ) t o foreign port folio invest m ent ( FPI ) ( Mat e, 2000) , t he st ock m arket is an im port ant t ool for t he flow of FPI int o Africa. Africa’s low levels of econom ic growt h ( average of 2,2% from 1978 t o 1985, and 2% from 1986 t o 1993) and high debt levels ( 15% of developing world t ot al debt ) have not been associat ed wit h t hriving equit y m arket s ( Erb, Harvey and Viskant a, 1996) .
2 . Ge n e r a l ove r vie w
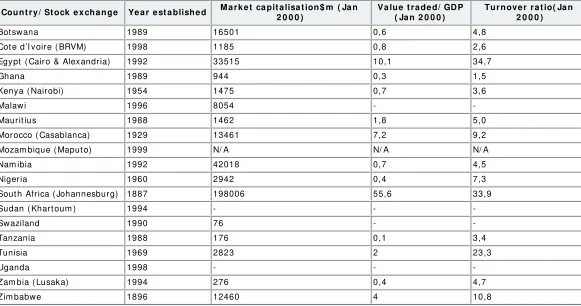
There were only 7 st ock m arket s in Africa before 1988 and t hese increased t o 20 in 2000. Table 1 below shows t he years of est ablishm ent and t he levels of developm ent in t erm s of size and liquidit y of African St ock Market s.
Egypt ’s Alexandra and Cairo St ock Exchanges were est ablished in 1888 and 1903 respect ively but had t heir operat ions suspended bet ween 1961 and 1992. The Lusaka St ock Exchange was est ablished wit h assist ance from t he I nt ernat ional Finance Corporat ion ( I FC) and World Bank in 1993. However, t rading on t his exchange only st art ed in 1994.
The Bot swana share m arket officially becam e t he Bot swana St ock Exchange in 1995. On t his exchange, privat e com panies account for less t han 10% of t ot al m arket capit alisat ion ( Tyandela and Biekpe, 2001) .
Africa also boast s of having t he first regional st ock exchange, t he Bourse Regionale des Valeurs Mobilieres ( BRVM) in Cot e d’I voire. This exchange serves t he 8 French- speaking ( francophone) m em ber count ries of t he West African Econom ic and Monet ary Union ( UMOEA) , nam ely Benin, Burkina Faso, Cot e d’I voire, Guinea Bissau, Mali, Niger, Senegal and Togo. The BRVM st art ed wit h a list ing of 35 com panies and a t ot al m arket capit alisat ion of 2904 billion CFA francs.
Ot her regional exchanges are under considerat ion wit h one planned for East Africa t o serve count ries such as Kenya, Tanzania and Uganda. These count ries already have st ock m arket s wit h Kenya’s Nairobi St ock Exchange t he m ost est ablished am ong t he t hree. An
http://www.fin24.co.za/register/help/mmx_school/displayarticlewide.asp?ArticleID=274559 (1 of 6)2006/09/22 03:23:22 PM
int egrat ed real t im e net work for SADC st ock exchanges is expect ed t o be up and running by t he year 2006 ( Tyandela and Biekpe, 2001) . A SADC Com m it t ee of St ock Exchanges was form ed in January 1997 for t his purpose. St ock exchanges in t he SADC are adopt ing t he list ing requirem ent s of t he Johannesburg St ock Exchange ( JSE) in preparat ion for t his int egrat ed net work. The JSE is fully com put erised and has offered t o give t echnical assist ance t o ot her exchanges in t he SADC. The JSE has t he m aj orit y ( 70% ) of list ed st ocks in t he SADC followed by t he Zim babwe St ock Exchange ( ZSE) ( Tyandela and Biekpe, 2001) . However, t he Nam ibian and Bot swana st ock exchanges are larger t han t he ZSE in t erm s of m arket capit alisat ion.
I n all, t here are m ore t han 2077 list ed firm s on African st ock exchanges ( Tyandela and Biekpe, 2001) . Even t hough Egypt has t he m aj orit y of list ed st ocks in Africa, only about 90 of t he 1100 st ocks are act ively t raded ( Tyandela and Biekpe, 2001) . Egypt has a m uch lower m arket capit alisat ion t han t he Johannesburg and Nam ibian st ock exchanges, which are com parat ively sm aller in t erm s of list ed st ocks ( 660 and 42 respect ively) .
3 . I n ve st m e n t r e gu la t ion s a n d r e for m s
The m acroeconom ic and polit ical environm ent s, legal, regulat ory, account ing, t ax and supervisory syst em s influence st ock m arket liquidit y. St ock m arket liquidit y is an im port ant fact or in at t ract ing foreign port folio invest m ent . Most African st ock m arket s st ill have rest rict ive capit al flow regulat ions on t he rem it t ance of capit al, capit al gains, dividends, int erest paym ent s, ret urns and ot her relat ed earnings t hereby const raining foreign invest m ent . Liberalising t hese rest rict ions would m ake t he m arket s m ore at t ract ive t o foreign invest ors and t his can accelerat e econom ic growt h by enhancing st ock m arket liquidit y. For inst ance, Chile’s liberalisat ion of equit y m arket s t o foreign invest m ent in 1992, cont ribut ed t o t he econom y’s growt h of 6,3% per year ( Bekaert and Harvey, 2001) .
Liberalisat ion increases invest m ent as foreign invest ors diversify t heir port folios driving up local equit y prices and reducing t he cost of capit al ( Bekaert and Harvey, 2001) . For count ries undert aking st ruct ural reform s, t ot al m arket capit alizat ion would largely increase as big ut ilit ies are being privat ised. Wide- ranging reform s, from legislat ive t o econom ic, are t aking place on Africa’s equit y m arket s as part of t he liberalisat ion process.
Ta ble 1 : Su m m a r y st a t ist ics of Afr ica n st ock m a r k e t s
Cou n t r y/ St ock e x ch a n ge Ye a r e st a blish e d M a r k e t ca pit a lisa t ion $ m ( Ja n 2 0 0 0 )
Va lu e t r a de d/ GD P ( Ja n 2 0 0 0 )
Tu r n ove r r a t io( Ja n 2 0 0 0 )
Bot swana 1989 16501 0,6 4,8
Cot e d’I voire ( BRVM) 1998 1185 0,8 2,6 Egypt ( Cairo & Alexandria) 1992 33515 10,1 34,7
Ghana 1989 944 0,3 1,5
Kenya ( Nairobi) 1954 1475 0,7 3,6
Malawi 1996 8054 -
-Maurit ius 1988 1462 1,8 5,0
Morocco ( Casablanca) 1929 13461 7,2 9,2
Mozam bique ( Maput o) 1999 N/ A N/ A N/ A
Nam ibia 1992 42018 0,7 4,5
Nigeria 1960 2942 0,4 7,3
Sout h Africa ( Johannesburg) 1887 198006 55,6 33,9
Sudan ( Khart oum ) 1994 - -
-Swaziland 1990 76 -
-Tanzania 1988 176 0,1 3,4
Tunisia 1969 2823 2 23,3
Uganda 1998 - -
-Zam bia ( Lusaka) 1994 276 0,4 4,7
Zim babwe 1896 12460 4 10,8
Source: Africa Cent re for I nvest m ent Analysis
Bekaert and Harvey ( 2001) st ressed t he im port ance of financial liberalisat ion on econom ic growt h. They showed t hat t he effect of financial liberalisat ion on econom ic growt h cont inues t o be significant even when inflat ion, st ock m arket developm ent , change in dividend yields and credit rat ings are considered. They also point ed out t hat t he enforcem ent of insider t rading laws would not dim inish t he im pact of financial liberalisat ion on econom ic growt h.
[image:3.612.13.594.322.628.2]African St ock Market s ( excluding JSE) are very illiquid. However, liquidit y is an im port ant fact or in t he role of st ock m arket s in prom ot ing econom ic growt h. The int egrat ion of African st ock m arket s and t he int roduct ion of regional st ock exchanges will prom ot e cross- border list ings and t hus st im ulat e increased liquidit y across m arket s.
Levine ( 1996) point ed out t hat liquid equit y m arket s m ake invest m ent less risky and m ore at t ract ive. Liquid m arket s facilit at e longer- t erm , m ore profit able invest m ent s and t hus im prove t he allocat ion of capit al. This enhances t he prospect s for long- t erm econom ic growt h. The ot her m easures of st ock m arket developm ent such as size and volat ilit y have not proved t o be good predict ors of econom ic growt h or perform ance ( Levine, 1996) . St ock m arket liquidit y im plies m ore invest m ent . I n developing count ries liquidit y is linked t o an increase in capit al flow t hrough bonds and bank loans and as a result corporat e debt - equit y rat ios rise wit h m arket liquidit y.
African st ock m arket s are also, in general, known t o be inefficient . However, t here are reform s underway in an effort t o m ake t hem m ore liquid and m ore efficient . These reform s include, am ong ot her t hings, t he shift from t he open- out cry syst em t o t he use of elect ronic t rading syst em s and st ringent regulat ory condit ions t hat prohibit insider t rading.
5 . I n t e gr a t ion w it h globa l e qu it y m a r k e t s
The general percept ion is t hat em erging m arket s are segm ent ed result ing in higher cost of capit al, which is relat ed t o local volat ilit y. Globally int egrat ed m arket s are larger, m ore liquid and volat ile and are associat ed wit h lower cost of capit al, im proved credit rat ings, real exchange rat e appreciat ion and t hus increased econom ic growt h.
The segm ent at ion of African st ock m arket s is part ly due t o rest rict ions on foreign invest m ent s. As a result of t his segm ent at ion, African m arket s lack cont agion wit h global em erging m arket s t hereby m aking t hem a bet t er way of diversifying one’s port folio. For inst ance, African m arket s were not cont agiously affect ed by t he Asian crisis due t o t heir lack of int erdependence wit h ot her global em erging m arket s ( Collins and Biekpe, 2001) . The JSE is t he only m arket in Africa t hat has a st rong relat ionship wit h global em erging m arket s ( Collins and Biekpe, 2001) . St ock prices in m any developing count ries, however, t end t o be closely correlat ed t o count ry fact ors such as currencies and int erest rat es ( Pension Fund I ndicat ors, 2001) .
6 . Risk a n d e x pe ct e d r e t u r n s
Foreign port folio invest m ent s on African st ock m arket s are rest rict ed by fact ors such as foreign exchange risk, polit ical risk, low liquidit y and ot her inform at ional and inst it ut ional barriers.
Erb, Harvey and Viskant a ( 1996) used risk rat ings from count ry risk and credit rat ings providers t o est im at e pooled t im e- series cross-sect ional regression m odels of ret urns, volat ilit ies and correlat ions using a sam ple of 49 equit y m arket s for t he period April 1984 t o March 1996. From t he regression result s, t hey t hen est im at ed t he expect ed ret urns, volat ilit ies and correlat ions for 34 African count ries including t hose wit hout equit y m arket s. These est im at es and t he risk rat ings used are shown in Table 2 where t he count ries wit h equit y m arket s in 1995 are in bold and it alics.
Ta ble 2 : Afr ica n cou n t r ie s’ e con om ic gr ow t h , r isk r a t in gs, e x pe ct e d r e t u r n s, vola t ilit y a n d cor r e la t ion w it h w or ld
Cou n t r y
Re a l GD P ch a n ge
1 9 9 5 ( % )
I n fla t ion ch a n ge 1 9 9 5 ( % )
Risk Ra t in gs* Ex pe ct e d Ex ce ss Re t u r n ( % )
Ex pe ct e d An n u a l Vola t ilit y
( % )
Ex pe ct e d Cor r e la t ion
W it h w or ld I CRGC I CRGP I CRGF I CRGE EM CRR I I CCR
Algeria 3,9 16,3 56 50 38 25 37 22 18,7 36,6 0,00 Angola 9,2 43,0 52 50 23 32 20 13 20,0 39,4 - 0,05
Bot sw a n a 4 ,4 9 ,1 7 7 7 2 4 0 4 2 5 8 5 0 1 3 ,3 2 4 ,4 0 ,3 2
Burkina Faso 4,5 7,8 58 54 28 35 41 16 18,1 35,2 0,03 Cam eroon 3,1 26,9 57 51 29 34 34 19 18,4 35,9 0,02 Congo 0,9 8,9 57 57 29 27 23 14 18,6 36,3 0,01
Cot e d’I voir e 6 ,5 1 4 ,2 6 0 5 9 2 9 3 2 4 1 1 7 1 7 ,6 3 3 ,9 0 ,0 6
Egypt 3 ,2 9 ,4 6 9 5 9 4 0 3 9 4 9 3 4 1 5 ,2 2 8 ,6 0 ,1 9
Et hiopia 5,5 11,4 61 59 26 37 31 15 17,3 33,3 0,07 Gabon 2,8 10,9 66 59 35 38 39 25 15,9 30,3 0,15 Gam bia - 4,0 5,0 59 56 24 38 34 17,8 34,6 0,05
Gh a n a 4 ,5 5 8 ,1 6 6 6 5 3 3 3 4 5 0 2 9 1 5 ,9 3 0 ,3 0 ,1 5
Ke n ya 5 ,0 1 ,7 6 7 6 7 3 4 3 3 4 4 2 7 1 5 ,7 2 9 ,7 0 ,1 6
[image:4.612.13.604.460.736.2]Mali 6,0 12,4 56 58 19 36 34 17 18,7 36,6 0,00
M a u r it iu s 4 ,1 6 ,1 5 5 5 0 1 8 ,5 3 0 ,1 0 ,1 6
M or occo - 6 ,0 6 ,6 6 8 6 5 3 8 3 3 5 4 3 9 1 5 ,4 2 9 ,1 0 ,1 7
Mozam bique 4,3 44,3 50 56 25 19 25 13 20,6 40,9 - 0,07
N a m ibia 1 ,7 9 ,3 7 6 8 0 3 1 4 1 2 8 1 3 ,6 2 4 ,9 0 ,3 0
Niger 3,0 10,5 49 47 26 24 33 21,1 42,1 - 0,09
N ige r ia 2 ,9 7 3 ,5 5 3 5 4 2 3 2 9 3 2 1 5 1 9 ,7 3 8 ,7 - 0 ,0 3
Senegal 4,5 8,0 61 59 29 33 39 22 17,4 33,6 0,07 Sierra Leone - 10,0 29,1 43 39 16 31 8 23,2 46,7 - 0,16 Som alia 5,4 16,3 29 28 10 20 18 29,8 61,9 - 0,33
S. Afr ica 3 ,4 8 ,9 7 6 7 4 4 0 3 8 6 5 4 6 1 3 ,6 2 4 ,9 0 ,3 0
Su da n 4 ,2 8 5 ,0 3 2 2 9 1 4 2 1 2 4 7 2 8 ,2 5 8 ,1 - 0 ,2 9
Ta n z a n ia 4 ,5 2 2 ,0 6 4 6 4 3 3 3 1 3 2 1 8 1 6 ,5 3 1 ,5 0 ,1 2
Togo 8,3 14,7 55 51 28 30 30 17 19,2 37,6 - 0,02
Tu n isia 3 ,5 6 ,2 7 0 7 0 3 6 3 1 6 5 4 5 1 5 ,0 2 8 ,0 0 ,2 1
Uganda 6,5 6,5 55 52 25 32 42 15 19,2 37,6 - 0,02 Zaire - 0,7 533,3 40 34 14 31 18 7 24,6 50,0 - 0,20
Za m bia 3 0 ,0 6 2 6 5 2 9 3 1 3 5 1 6 1 7 ,0 3 2 ,7 0 ,0 9
Zim ba bw e - 1 ,1 2 3 ,0 6 1 6 2 2 8 3 2 5 0 3 2 1 7 ,3 3 3 ,3 0 ,0 7
Average 3,2 36,9 58 57 28 32 38 22 18,4 35,6 0,05 Median 4,1 13,3 60 59 29 32 35 17
Sources: World Econom ic Out look, I nt ernat ional Monet ary Fund May 1996
Erb, Harvey and Viskant a ( 1996)
* On t he risk rat ings, a scale of 0 – 100 is used. A higher score indicat es lesser risk and a score of 100 represent s m axim um credit wort hiness.
Ke y t o Ta ble
I CRGC I nt ernat ional Count ry Risk Guide Com posit e Rat ing ( 5/ 96) I CRGP I nt ernat ional Count ry Risk Guide Polit ical Rat ing ( 5/ 96) I CRGF I nt ernat ional Count ry Risk Guide Financial Rat ing ( 5/ 96) I CRGE I nt ernat ional Count ry Risk Guide Econom ic Rat ing ( 5/ 96) EMCRR Eurom oney Count ry Risk Rat ings ( 3/ 96)
I I CCR I nst it ut ional I nvest or Count ry Risk Rat ings ( 3/ 96)
Erb, Harvey and Viskant a ( 1996) concluded from t heir analysis t hat higher expect ed ret urns for individual count ries com e t oget her wit h higher expect ed volat ilit ies. Table 2 shows t hat , in 1995, t he average expect ed ret urn and volat ilit y for Africa were quit e high, 18,4% and 35,6% respect ively and t he average correlat ion was very low ( 0,05% ) . The high ret urns and low correlat ions wit h world m arket s m ake Africa at t ract ive t o invest ors. The low correlat ions also m ake African St ock m arket s good port folio diversifiers.
7 . Pe r for m a n ce
One of Africa’s great est achievem ent s is t o have som e of it s st ock exchanges ranked as t op perform ers am ong em erging m arket s. The Egypt ian St ock Exchange ranked fift h in t he world in t he 1940s whilst Ghana was ranked t he sixt h best perform ing em erging st ock m arket in 1993. The Zim babwe and Lusaka St ock Exchanges were crowned st ar perform ers in 1996 and 1997 respect ively.
The m ost act ive st ock m arket s in sub- Saharan Africa include Zim babwe, Maurit ius, Nigeria, Ghana, Kenya and Bot swana. Table 3 below shows t hat t he ret urns of t hese m arket s in April 2001 rose by 6,3% ; 1,4% ; 7,1% ; 1,3% ; 3,1% and 4,5% respect ively in US$ t erm s. The parallel m arket exchange rat e was used in convert ing Zim babwean ret urns int o US dollars. Nigeria had t he highest m arket capit alisat ion of US$3,8 billion in April 2001 whilst t he Bot swana m arket , which is growing in prom inence, had a capit alisat ion of US$1,1 billion.
Ta ble 3 : Size , divide n ds a n d r e t u r n s for se le ct e d st ock m a r k e t s
[image:5.612.15.598.23.325.2]US$ m % H ist or ic For w a r d Yie ld Cove r 2 0 0 1 ( YTD ) Apr 2 0 0 1 2 0 0 0 S. Africa
I ndust rials - 21,1% 12,9% - 28,6%
Gold 23,6% 18,8% 25,8%
All Share - 8,6% 11,5% 50,2%
Zim babwe 2525 22,4% 17,8 12,0 2,0% 2,97 5,98 21,8% 6,3% - 19,9% Maurit ius 1309 11,7% 8,6 7,5 6,5% 2,37 1,09 0,4% 1,4% - 18,2% Kenya 1193 10,6% 9,3 7,5 9,4% 1,41 1,31 - 0,7% - 3,1% - 22,5% Bot swana* 1106 9,8% 12,4 10,0 5,9% 1,59 5,75 18,8% 4,5% 10,3% Nam ibia* 228 2,0% 7,4 8,5 5,4% 2,34 2,21 - 16,8% 1,3% 52,3% Malawi 177 1,6% 3,2 2,5 7,1% 2,35 1,26 2,8% 1,0% 37,8% Zam bia 141 1,3% 12,4 8,0 6,9% 1,55 5,35 28,8% - 3,7% 4,9% Tanzania 219 1,9% 3,5 3,0 10,2% 1,06 1,48 - 4,7% - 3,5% 0,1% Nigeria 3835 34,2% 18,7 12,0 3,9% 2,01 4,97 8,6% 7,1% 41,7% Ghana 504 4,5% 5,1 3,5 8,5% 2,43 2,43 1,2% - 1,3% - 43,9% Re gion e x SA 1 1 2 2 6 1 0 0 % 1 4 ,3 1 0 ,0 5 ,0 % 2 ,1 6 4 ,1 4 9 ,0 % 4 ,0 % 1 ,5 %
Source: Business in Africa, June 2001
* Exclude com panies wit h dual list ing on t he JSE
8 . Gr ow t h pot e n t ia l
Global capit al flows int o em erging m arket s are at t ract ed by t he higher growt h pot ent ial of t hese m arket s ( Pension Fund I ndicat ors, 2001) . The abilit y of em erging ( including African) m arket s t o at t ract invest ors, despit e t he ext ra risks, rest s upon t he relat ively high ret urns on invest m ent s in t hese m arket s. These ret urns arise from t he fact t hat m any business opport unit ies in t hese m arket s st ill rem ain
unexploit ed. This is due t o rest rict ed access t o m arket s, poor t echnological endowm ent , policy m ist akes, or polit ical inst abilit y ( Pension Fund I ndicat ors, 2001) . The at t ract iveness of em erging m arket s is enhanced by t he effort s being m ade t o redress t hese legacies.
African st ock m arket s are relat ively sm all in t erm s of num ber of list ed com panies and m arket capit alisat ion in com parison wit h ot her global em erging m arket s. The m arket s are st ill in t he em bryonic st ages of developm ent wit h pot ent ial for significant growt h. The only except ion is Sout h Africa, whose m arket capit alisat ion is t en t im es t he com bined capit alisat ion of t he rest of African st ock m arket s, and over 100 t im es t heir average ( Senbet , 2000) . Taken individually, African st ock m arket s are lim it ed in resource m obilisat ion, whilst t aken collect ively t hey have som e pot ent ial for significant fut ure growt h.
Con clu sion
African st ock m arket s have rapidly increased in num ber since 1989. This rapid increase cam e wit h t he effort s t o privat ise st at e- owned ent erprises. African m arket s are st ill young and segm ent ed and lack cont agion wit h global em erging m arket s. Expect ed ret urns are quit e high on African st ock m arket s m aking t hem at t ract ive t o int ernat ional invest ors. However, African m arket s are also charact erised by poor liquidit y and m arket inefficiency. This, coupled wit h unfavourable laws and regulat ions, polit ical inst abilit y, foreign exchange and
convert ibilit y risk, t axat ion, lim it ed share acquisit ions and rest rict ions on foreign port folio invest m ent have const rained t he growt h of t hese m arket s. Relaxing or elim inat ing invest m ent rest rict ions will prom ot e foreign port folio invest m ent s result ing in im proved liquidit y and efficiency. This will give African st ock m arket s increased growt h pot ent ial and enhance t heir role in econom ic growt h.
Re fe r e n ce s
Bekaert G. and Harvey CR. 2001. Research sum m aries: econom ic growt h and financial liberalisat ion in t he NBER Report er Spring 2001: 8-11.
Business in Africa; I nt ernat ional Magazine, June 2001.
Collins D. and Biekpe N. 2001. African financial m arket s: int erdependence wit h and cont agion from global em erging m arket s, Paper present ed at t heDevelopm ent St udies Associat ion Annual Conference, I nst it ut e for Developm ent Policy and Managem ent , Universit y of Manchest er, UK.
Erb CB, Harvey CR. and Viskant a TE. 1996. The risk and expect ed ret urns of African equit y invest m ent Chapt er 5 in Collier P. and Pat t illo C’s ‘I nvest m ent and Risk in Africa’, Macm illan 2000 Ed. P122- 145.
Fish T. 2001. The const ruct ion of African regional and All- African St ock Market I ndices’, MBA Dissert at ion, Universit y of St ellenbosch, Sout h Africa.
Kwakye- Agyekum A. 1999. St ock exchanges of Sub- Saharan Africa. St andard Equit ies Securit ies Research July 1999. Levine R. 1996. St ock m arket s: a spur t o econom ic growt h, Finance and Developm ent, March 1996: 7- 10.
FIN24 : Empowering Financial Decisions
Pension Fund I ndicat ors 2001; Chapt er 5 p 38- 43.
Senbet LW. 2000. Discussion on ‘The Risks and Expect ed Ret urns of African Equit y I nvest m ent ’ by Erb, Harvey and Viskant a, in Collier P. and Pat t illo C’s ‘I nvest m ent and Risk in Africa’, Macm illan 2000 Ed. P146- 150
Tyandela L and Biekpe N. 2001. Const ruct ion of All SADC St ock Market s I ndices. The African Finance Journal, 3( 1) , 2001, Sout h Africa.