Layered Model to Estimate Effort, Performance and Cost
of the Software Projects
M.Pauline
,
Asst.Professor,Dept. of CSE, M.V.J. College of Engineering,
Bangalore
P.Aruna
Professor, Dept. of CSE, Annamalai University,
Annamalainagar, Chidambaram Tamil Nadu, South India
B.Shadaksharappa
Professor and Head, Dept. of CSE, Shirdi Sai College of
Engineering, Bangalore,Karnataka
ABSTRACT
This paper presents a layered model which determines the software metrics in the lower layer it consists of three primitive primary software engineering metrics; they are person-months (PM), function-points (FP), and lines of code (LOC). The middle layer consists of the proposed function point which is obtained by grouping the adjustment factors. The proposed method uses fuzzy logic for quantifying the quality of requirements and is added as another adjustment factor, thus a fuzzy based approach for the Enhanced General System Characteristics to Estimate Effort of the Software Projects is obtained in the middle layer. The top layer takes the calculated function point from the proposed method as input, and gives to the static single variable model (Intermediate COCOMO and COCOMO II) for cost estimation whose cost factors are tailored in intermediate COCOMO and both, cost and scale factors are tailored in COCOMO II to suite to the individual development environment, which is very important for the accuracy of the cost estimates. The software performances are measured with their indicators for the software projects. A comparative study for effort, performance measurement and cost estimation of the software project is done between the existing model and the proposed model.
General Terms
The Software metrics, Primary metrics, General Purpose metrics, Special purpose metrics. Effort Estimation, Cost Estimation and performance measurement of the software projects using our proposed model.
Keywords
General System Characteristics (GSC), Function Point (FP), Total effort multiplier (TEM), Scale Factors, Cost Drivers.
1.
INTRODUCTION
This paper presents a model that presents the fundamental of software metrics. In the lower layer, LOC is presented as primarily a measurement technique for quantifying the size of a software product. Function points as an indirect measure of software size based on external and internal application characteristics. Once determined, function points can be input into empirical statistical parametric software cost estimation equations and models in order to estimate software costs. Person month metric are used to express the effort a personnel
devotes to a specific project. Software size estimates are converted to software effort estimations to arrive at effort, and then the total cost of the whole software project is calculated. Estimating size and effort are the most important topics in the area of software project management.
In the middle layer while discussing a proposed model for effort estimation, a number of enhancements to adjustment factors is introduced. One of the enhancements proposed in this model is grouping the available 14 GSCs into three groups. They are “System complexity”, “I/O complexity” and “Application complexity”. Another important enhancement in this proposed Effort Estimation model is the consideration of the quality of requirements as an adjustment factor and this “Quality complexity” is added as the fourth group to the adjustment factor. There are several approaches for estimating such efforts, this work proposes a fuzzy logic based approach using Mat lab for quality selection.
The obtained function point is given as input to the top layer, the top layer consist of Intermediate COCOMO and COCOMO II model, former computes effort as a function of program size and analysis has been done to define rating for the cost drivers and by adding the new rating the developmental effort is obtained while for the latter, it gets function point as input and computes effort as a function of program size, set of cost drivers, scale factors, Baseline Effort Constants and Baseline Schedule Constants. Cost estimation must be done more diligently throughout the project life cycle so that there are fewer surprises and delays in the release of a product.
Performance of the software projects are also measured in the top layer. By adding the new rating the developmental effort obtained is very much nearer to the planned effort and also a comparative study is done between the existing and our proposed method.
2. RELATED WORK
count to arrive at an unadjusted function point. Second, Function point counting passes through an adjustment phase. This phase consists of scoring a group of general systems characteristics (GSC) that rate the general functionality of the application being counted, from the GSC, the value adjustment factor (VAF) is determined, The last step is to calculate the final adjusted function point count by multiplying the VAF times the unadjusted function point [2]. One of the enhancements proposed in the model is grouping the 14 GSCs into groups. The grouping not only simplifies the counting process, but also reduces the probability of errors while counting [3][4][5][6]. The count total is the summation of all the Information domain value and weighing factor. The fourteen GSC is based on responses to the following involving a scale from 0 to 5. The scores for these characteristics are then summed based on the following formula to arrive at the value adjustment factor (VAF) [3][4][5]. Incomplete requirements and changing requirements rank as the second and third main causes of project failures [6].
This paper presents a Mamdani fuzzy modeling scheme where rules are derived from multiple knowledge sources [7]. A keen mapping between input and output spaces may be developed with the help of fuzzy logic [8][9]. Fuzzy logic models can be easily constructed without any data [10]. Estimation using expert judgements is better than models [11]. This model is serving as a framework for an extensive current data collection and analysis effort to further refine and calibrate the model’s estimation capabilities [12].To determine the nominal person months for the Early Design model, the unadjusted function points have to be converted to source lines of code in the implementation language [13]. A study accomplished by, presents the conclusion that the most critical input to the COCOMO II model is size, so a good size estimate is very important for any good model estimation [14]. Estimation using expert judgements is better than modeling techniques [15]. Existence of a consistently applied process is an important and a prerequisite for a successful measurement program in case of different environments [16]. In traditional software cost models, costs are derived from effort. [17][18] The Intermediate COCOMO model computes effort as a function of program size and a set of cost drivers [19][20][21]. Software organizations, whether they are just starting a measurement program or have a well-developed program, want a way to gauge the performance of their software projects against other organizations in their industry. Organizations that are more experienced in measurement want to compare their performance with competitors in their industry [22]. Performance measurement might be referred to as performance monitoring or performance auditing [23]. An effective set of performance measures will provide actionable information, on a focused set of metrics, to provide a balanced view of project performance to improve the project management process [24]. Organization will be interested in monitoring and comparing the projects and project performances. [25][26][27].
3. SYSTEM OVERVIEW
The proposed method presents a set of primary metrics and the mode to calculate the Lines of code, Function point and Person month are also discussed in the first layer. In the middle layer a fuzzy based proposed model for effort estimation is discussed, the enhancements proposed is grouping the fourteen GSCs into groups, first group is “System complexity” which consist of Data communication Complexity, Distributed Data Processing Complexity, Performance Complexity and Heavily used configuration Complexity, the average of the four weighted scores together gives the System complexity. Second group is “I/O complexity” which consist of Transaction rate Complexity, Online data entry Complexity, End user efficiency Complexity and Online update Complexity , and the third group is “Application complexity” which consist of Complex processing Complexity , Reusability Complexity , Installation Ease Complexity, Operational Ease Complexity, Multiple Sites Complexity, Facilitate Change Complexity . The grouping of the 14 GSC into groups simplifies the counting process and reduces the probability of errors while counting; this enhanced system focuses on minimizing the effort by enhancing the adjustments made to the functional sizing techniques. In the existing systems, the effort and cost estimation are more concentrated on the development of software systems and not much on the quality coverage. Hence the quality assurance for the effort estimation is proposed in this paper.
and performance of the software projects is measured for the software developed, also a comparative study is done between the existing and proposed model taking HR application as case studies.
4. MODELING PROCEDURE
The proposed modeling procedure clearly describes the steps to build the estimation models. The layers in this procedure determine effort using function point and person month. From the function point obtained, LOC is calculated taking the Function point and the multiplication Language factor. Having Loc as one of the input and considering the other factors and introducing the concept of trimming to the cost drivers and scale factors Cost Estimation is obtained. Once the Effort and Cost are estimated, the Software is developed and the performance of the software projects is analyzed using the performance indicators.
5. Lower layer
The first layer consists of primitive software engineering metrics called as primary metrics; they are person-months (PM), function-points (FP), and lines of code (LOC). The three metrics, PM, LOC, and FP represent measures of personnel effort, programmer productivity, and software functionality.
5.1 LINES OF CODES
LOC is presented as a measurement technique for quantifying the size of a software product.
The steps for calculating Lines of codes are:
i. Each Statement is counted as one line. ii. Comments are excluded from the count. iii. Each delimiter corresponds to one statement.
5.2 FUNCTION POINT
The function point metric (FP) can be used to Estimate the cost or effort required to design, code and test the software.
The steps for Calculating Function point metric are:
Count total is calculated using Information domain and the weighting factor.
The Value added factor is based on the responses to the following 14 characteristics, each involving a scale from 0 to 5 and the empirical constants
Function point is the product of Count total and the Value added factor.
Thus Function points (FP) provide a measure of the functionality of a software product and is obtained using the following equation:
FP = count-total X [0.65 + 0.01 X Σ Fi]
Where the count-total is a summation of weighted input/output characteristics, and Fi is the summation of fourteen ranked factors.
5.3 PERSON MONTHS
One PM is normally defined as the output of one person in one month, working 40 hours/week, with one month defined as four weeks.
The steps for calculating person months are:
For Basic COCOMO model are static single variable with format:
PM = f (LOC)
Hence person months for organic, semidetached and embedded are
PM = 2.4 KLOC 1.05 (organic)
PM = 3.0 KLOC 1.12 (semidetached)
PM = 3.6 KLOC 1.20 (embedded)
For intermediate COCOMO, the cost driver multiplier, F are shown as :
PM = 3.2 F * KLOC 1.05 (organic)
PM = 3.0 F * KLOC 1.12 (semidetached)
PM = 2.8 F * KLOC 1.20 (embedded)
6. MIDDLE LAYER
In the middle layer our model proposes a fuzzy based model for effort estimation, the enhancements proposedin ourmodel is grouping the fourteen GSCs into groups and adding quality as one more.
6.1 PROPOSED FUNCTION POINT
In function point sizing, external aspects of software that is counted consist of five items; they are outputs, inquiries, inputs, files, and interfaces. Each of the functions that are assigned one of the five items is further classified as complex, average, or simple. The complexity weights are applied to the initial function point count in the same way as Albrecht’s function point metric to arrive at an unadjusted function point. In this proposed model the Enhancements to adjustment factors of functional size measurements is introduced. The enhancements proposed in this model are grouping the 14 GSCs into three groups which simplify the counting process and reduce the probability of errors while counting.
6.2 QUALITY OF EFFORT
The quality of requirements is rated and this Quality complexity is added as the fourth group among the adjustment factors in our proposed model. The standard identifies six key quality attributes.
namely maturity, fault tolerance, and recoverability.Usability is the degree to which the software is easy to use as indicated by the following sub-attributes namely understandability, learnability, and operability.Efficiency is the degree to which the software makes optimal use of system resources as indicated by the following sub-attributes namely time behavior and resource behavior. Maintainability is the ease with which repair may be made to software as indicated by the following sub-attributes namely analyzability, changeability, stability, and testability. Portability is the ease with which the software can be moved from one environment to another as indicted by the following sub-attributes namely adaptability, installability, conformance and replaceability.
The above six key quality attributes are taken to quantify the quality of requirements using fuzzy logic and is added as the fourth group to the enhancement of the adjustment factor The scores (ranging from 0 to 5) for these characteristics in each group are then summed based on the following formula to arrive at the Enhanced value adjustment factor.
Thus Proposed VAF = 0.65 + 0.01 ∑ proposed four groups, Where 0.65 and 0.01 are empirically derived constants.
6.3 FUZZIFICATION OF INPUTS
Our proposed model considers all the six key quality attributes (for Quality Complexity), they are Functionality,
Reliability, Usability, Efficiency, Maintainability and Portability as inputs and provides a crisp value of Quality efforts using the Rule Base. All the six quality attributes, which is taken as inputs can be classified into fuzzy sets viz. Low, Medium and High. The output Quality Efforts is classified as Very High, High, Medium, and Low. In our proposed model to fuzzify the inputs, the triangular membership functions are chosen namely Low, Medium and High. Also the quality effort which is the output variable in our model has four membership functions they are very high, high, medium and low. All the inputs and outputs are fuzzified and all possible combination of inputs were considered in our model which leads to 34 i.e. 81sets. Quality Effort in case of all 81 combinations is classified as Very High, High, Medium, and Low by expert opinion in our proposed model
7. UPPER LAYER
The Intermediate COCOMO model computes effort as a function of program size and a set of cost drivers, COCOMO II has some special features, which distinguish it from other ones.
7.1 INTERMEDIATE COCOMO
The Intermediate COCOMO equation is given by E = aKLOC^ b * EAF. Where ‘a’ and ‘b’ are the domain constants of the intermediate cocomo model. These formulae link the size of the system, domain constants and Effort Multipliers (EM) to find the effort to develop a software system. The effort adjustment factor/ Total adjustment factor has been calculated using 15 cost drivers. Cost drivers are grouped into four categories; they are Product, Computer,
Personnel and Project. Each cost driver has been rated on a six-point ordinal scale ranging from low to high importance. Based on the rating, an effort multiplier is determined, Product of all effort multipliers leads to EAF. Cost drives have a rating level; these rating can range from Extra Low to Extra High. For the purpose of quantitative analysis, each rating level of each cost driver has a weight associated with it. The weight is called Effort Multiplier.
The steps involved in the proposed model for calculating proposed Effort are:
Count Total is calculated using Information domain and the weighting factor. The complexity weights are applied to the initial function point count to arrive at an unadjusted point total.
The Value adjustment factor is based on the responses to the following 14 general system characteristics, each involving a scale from 0 to 5 and the empirical constants. Grouping the fourteen general system characteristics into three groups are used .
The fourth group is the quality factor, which is the set off quality characteristics, they are Functionality, Reliability, Usability, Efficiency Maintainability and Portability.
Total degree of influence = Σ system Complexity + Σ I/O Complexity + Σ Application Complexity + Σ quality
Complexity
Proposed Value adjustment factor is [(TDI * 0.01) + 0.65], where TDI is the total degree of influence and, 0.01 and 0.65 are the empirical constants.
Total adjustment function point is the product of unadjusted function point and the proposed Value adjustment factor.
From the Function point, the lines of code is calculated, which is the product of function point and the multiplication language factor.
Intermediate COCOMO model computes effort as a function of program size and a set of cost drivers.
The cost drivers are assigned new ratings in such a way that the existing characteristic behavior of the intermediate model is not altered.
Total Effort multiplier is the product of the ratings of the assigned cost drivers
From the obtained TEM, the developmental person month is calculated, which is very much nearer to the planned effort (Table 3).
7.2 COCOMO II
PM = A x size E x
n
i
EM
1
Where E = B + 0.01 x
5
1
j
j SF
The application size is exponent, is aggregated of five scale factors that describe relative economies or diseconomies of scale that are encountered for software projects of dissimilar magnitude. They are Precedentedness (PREC), Development Flexibility (FLEX), Architecture / Risk Resolution (RESL), Team Cohesion (TEAM) and Process Maturity (PMAT)
These are the 17 effort multipliers/ cost drivers used in COCOMO II Post-Architecture model to adjust the nominal effort, Person Months, to reflect the software product under development. They are grouped into four categories: product (Required Software Reliability, Data Base Size, Developed for Reusability, Product Complexity and Documentation Match to Life-Cycle Needs), platform (Execution Time Constraint, Main Storage Constraint, Platform Volatility), personnel (Analyst Capability, Programmer Capability, Personnel Continuity, Application Experience, Platform Experience, Language and tool experience), and project(Use of Software Tools, Multisite Development and Required Development Schedule). The EM values are selected appropriately and tailored and used to estimate the development projects. The Driver symbol are grouped into four category, they are Product drivers (consist of RELY,DATA,CPLX,RUSE and DOCU),Platform drivers (consist of TIME,STOR,PVOL), Personnel(consistofACAP,PCAP,PCON,APEX,PLEX,LTEX) and Project drivers (consist of TOOL,SITE and SCED).
7.3 PERFORMANCE MEASURES
Performance measurement is a process of assessing the results of a company, organization, project, or individual. In this document a set of software project performance measures are defined which can be used by software development projects to make valid comparisons of performance.
7.3.1 PROJECT DURATION
Project duration is a measure of the length of a project in work days, excluding times when the project is not active due to work stoppages. Project duration does not include non-work days such as weekend days and holidays. Project start is the date when user requirements have been baselined. Project end is the date of the first installation of the software application.
Project Duration = (number of _days - stoppage_ days)
7.3.2 SCHEDULE PREDICTABILITY
Schedule predictability is a measure of how much the original project duration estimate differs from the actual project duration that was achieved.
(Project Duration) - (Estimated Project Duration)
SP = ---*100
Estimated Project Duration
Schedule predictability is a positive value when there is a schedule overrun and a negative value when there is a schedule underrun.
7.3.3 REQUIREMENTS COMPLETION
RATIO
The requirements completion ratio measures the extent to which planned functional requirements were satisfied in the final product implementation.The requirements completion ratio (RCR) is expressed as a percentage as
Satisfied requirements
RCR = ---* 100 %
Planned requirements
7.3.4 POST RELEASE DEFECT DENSITY
Post-release defect density is the number of unique defects per unit size discovered during the first six months after initial deployment of the software.
Σ D
PRDD = ---
Size
8. EXPERIMENTAL RESULTS
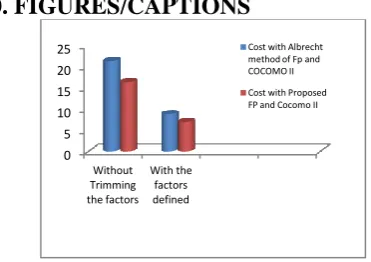
The Experimental results and tables are presented at the end. Figure 1shows the Comparison of cost Estimation using Albrecht’s fp and authors proposed fp in cocomo II (with and without trimmed factors), and Table 1 shows the Effort Estimation using existing cocomo II and the proposed model
9. CONCLUSION & FUTURE SCOPE
[image:5.595.90.199.76.147.2]paper ,By tailoring the value of the cost drivers, the total effort multiplier is obtained. From the enhanced adjustment factor, the altered rating of the cost driver, Scale Factors, Effort and Schedule Constants, the effort of the software project in person month is obtained. It is found that the obtained person month is very much nearer to the planned effort.
[image:6.595.65.251.161.292.2]10. FIGURES/CAPTIONS
Figure 1 shows the Comparison of cost Estimation using Albrecht’s fp and authors proposed fp in cocomo II (with
and without trimmed factors)
Table 1 Effort Estimation using existing cocomo II and the proposed model
Results obtained Using Albrecht’s Method
Results obtained Using Proposed Method
FP 480 366.1
KLOC 43.68 33.31
Scale Factor 6.32 6.32
PM 8.8 6.9
TDEV 10.9 10.1
11. REFERENCES
[1] Agarwal.R, Kumar.M, Malick.S, Bharadwaj.R.M, and Anantwar.D, “Estimating Software projects”, ACM SIGSOFT, Vol 26, 2001.
[2] Azath.H, Wahidabanu.R.S.D, “Function Point: A Quality Loom for the Effort Assessment of Software Systems”, International Journal of Computer Science and Network Security, IJCSNS Vol.8 No12, Dec 2008.
[3] Kiumi Akingbehin and Bruce Maxim, “ A Three-Layer Model for Software Engineering Metrics”, Proceedings of the Seventh ACIS International Conference on Software Engineering Artificial Intelligence, Networking, and Parallel/Distributed Computing (SNPD’06).
[4] Galal H. Galal-Edeen, Amr Kamel, and Hanan Moussa, “Lessons Learned from Building an Effort Estimation Model for Software Projects”, Int.J. Of Software Engineering, IJSE Vol.3 No.2 July 2010.
[5] Function Point Counting Practices Manual (Release 4.1), International Function Point User’s Group (IFPUG), May 1999.
[6] Longstreet .D, “Function Points Step by Step”, Longstreet Consulting, Inc., January 1999.
[7] Pauline.M, Aruna.P, Shadaksharappa.B, “A Layered Model For Software Metrics”, International Conference on Intelligent Design and Analysis of Engineering products, system and computation, IDAPSC10, pp.63-65.
[8] Pauline.M, Aruna .P, Shadaksharappa. B, “A Cost Model for Estimation of the Software Developed”, International Conference on Communication, Computation, Control and Nanotechnology, ICN-2010, pp. 762-764.
[9] Zhendong Lun, “Software Cost Estimation”, Department of Computer Science, Southern Illinois University Edwardsville.
[10] Standish Group, “CHAOS Report”, Standish Group, 1994.
[11] Keshwani ET AL., “Rule-based Mamdani-type fuzzy modeling of skin permeability”, Applied Soft Computing, pp.285-294; doi: 10.1016/j.asoc.2007.01.007 Copyright © 2007 Elsevier B.V.
[12] Kirti Seth, Arun Sharma and Ashish Seth, “Component Selection Efforts Estimation – a Fuzzy Logic Based Approach”, International Journal of Computer Science and Security, (IJCSS) Vol.3 No 3.
[13] Roger Jang and Ned Gulley, “Fuzzy Logic Toolbox for MATLAB”, User’s Guide. The Math Works Inc, USA, 1995.
[14] Stephen G. MacDonell, Andrew R. Gray, and James M. Calvert, “FULSOME: Fuzzy Logic for Software Metric Practitioners and Researchers”, IEEE, 0-7803-5871-6/99.
[15] SaleemBasha and Dhavachelvan.P, “Analysis of Empirical Software Effort Estimation Models”, (IJCSIS) International Journal of Computer Science and Information Security, Vol. 7, No.3, 2010.
[16] Sharma.T.N, “Analysis of Software Cost Estimation Using COCOMO II”, International Journal of Scientific & Engineering Research Volume 2, Issue 6, June-2011, ISSN 2229-5518.
[17] JongmoonBaik, “COCOMO II Model Definition Manual”.
[18] Majed Al YahyaRodina Ahmad, and Sai Lee, “Impact of CMMI Based Software Process Maturity on COCOMO II’s Effort Estimation”, The International Arab Journal of Information Technology, Vol.7, No. 2, April 2010.
[19] Magne Jorgensen, “Practical Guidelines for Expert-Judgment-Based Software Effort Estimation”, IEEE Software, Published by the IEEE Computer Society, 2005
[20] Frank Niessink and Hans van Vliet, “ Two Case Studies in Measuring Software Maintenance Effort”, Published in the proceedings of the International Conference on Software Maintenance, Bethesda, Maryland,USA, November-16-20, 1998,pp.76-85.
[21] Pressman, R.S. (1997). Software Engineering A Practitioner’s Approach. McGraw-Hill.
[22] Boehm, B., Horowitz, E., Madachy, R., Reifer, D., Clark, B., Steece, B., Brown,A.W., Chulani, S. and Abts, C, “Software Cost Estimation with COCOMO II”. Prentice Hall, 502 p., 2000.
0 5 10 15 20 25
Without Trimming the factors
With the factors defined
[image:6.595.48.288.378.481.2][23] Boehm, B. and Papaccio, P. 1988. “Understanding and controlling software costs”.IEEE Transactions on Software Engineering 14 (10), 1462-1477,1988.
[24] Basavaraj M.J and Shet K.C, “Empirical Validation of Software development effort multipliers of Intermediate COCOMO Model” Journal of software, vol 3, No.5, May 2008.
[25] Samuel Lee, Lance Titchkosky and Seth Bowen, “ Software Cost Estimation” Department of Computer Science, University of Calgary.
[26] Mark Kasunic “A Data Specification for Software Project performance Measures: Results of a Collaboration on Performance Measurement”, CMU/SEI-2008-TR-012, July 2008.
[27] Patricia Lichiello, “ Guidebook for Performance Measurement”, University of Washington Health Policy Analysis Program.
[28] “Basic Performance Measures For Information Technology Project Guidance white paper”, DOE Software Quality and Systems Engineering, pp.2-8; doi: 15 January 2002, PE-WI-V3-011502.doc.
[29] Manjul Sahay and Susheer R S, “Objective Based Performance Measurement”, © 2001- 2004 Transversal e Networks Pvt Ltd.
[30] Pauline.M, Aruna.P, Shadaksharappa.B, “Fuzzy-Based Approach Using Enhanced Function Point to Evaluate the Performance of Software Project”, The IUP Journal of Computer Sciences, Vol. VI, No. 2, 2012.