Matrix Based Fuzzy Clustering for Categorization of Web
Users and Web Pages
G. Sudhamathy,
Department of Computer Applications, Velammal College Of Engineering and Technology,
Madurai 625 009, India
C. Jothi Venkateswaran,
Department of Computer Science, Presidency College (Autonomous),
Chennai 600 005, India
ABSTRACT
Categorization of Web Users and Web Pages are the fundamental tasks of Web Personalization. In this paper it is proposed a Matrix Based Fuzzy Clustering Approach MBFCA and experimentally evaluated the approach for the effective discovery of web user clusters and web page clusters. The use of MBFCA enables the generation of clusters that can capture the Web user’s navigation behavior based on their interest. In web usage analysis, many a times there are no sharp boundary between clusters. Hence fuzzy clustering is better suited for Web Usage Mining. Experimental results presented, the clusters generated by applying MBFCA, are intended to be used to make recommendations by suggesting interesting links to the user.
General Terms
Pattern Recognition, Algorithm.
Keywords
Web Usage Mining, Web Logs Clustering, Web Personalization, Fuzzy Logic, Matrix Based Fuzzy Clustering.
1.
INTRODUCTION
Web usage mining is a very important part of web mining, and it tries to discover interesting web user access patterns or knowledge from the web log records [1]. Web log files contain a huge amount of data about user access patterns. Hence, if properly exploited, they can reveal useful information about the browsing behavior of users in a site. Analyzing and exploring regularities in web log records can identify customers for e-commerce, enhance quality of IIS and improve web server system performance [7].
Web usage mining approach applies Data Mining algorithms on Web usage data and among them clustering is an effective way to group users with common browsing behavior [8]. In the choice of the clustering method for Web usage mining, one important constraint to be considered is the possibility to obtain overlapping clusters, so that a user can belong to more than one group [9]. To deal with the ambiguity and the uncertainty underlying Web interaction data, as well as to derive overlapping clustering, fuzzy clustering appears to be an effective tool. Web mining has obvious fuzzy characteristic, so fuzzy clustering is better suited for the web mining [2]. So the concept of Matrix Based Fuzzy Clustering Approach MBFCA is put forward for Web usage mining.
2.
PROPOSED APPROACH
The input data object of the Matrix Based Fuzzy Clustering is the web source matrix which represents the data objects and its attributes of the given web data set. But the processing data
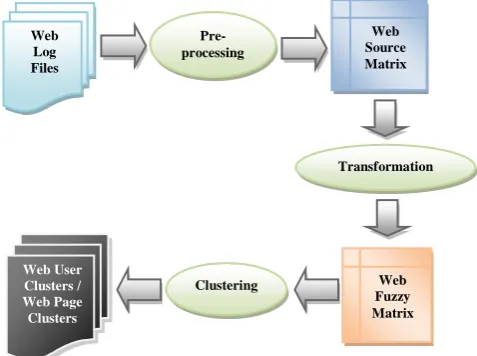
[image:1.595.316.555.325.503.2]object of MBFCA is web fuzzy similarity matrix using which the web users and web pages clustering is done. So it is required to abstract web source data firstly and then transform it into web fuzzy matrix which is suitable for fuzzy clustering [3]. In the end, fuzzy clustering method is applied on web fuzzy matrix to obtain the clustering results. The Matrix Based Fuzzy Clustering Approach (MBFCA) is shown in Figure 1.
Fig 1: Matrix Based Fuzzy Clustering Approach
3.
PRE-PROCESSING
Web log files from the web server are extracted and parsed. That is the delimited fields in the web log text files are separated and we are interested in the fields date, time, Client IP address, URL Visited and User Agent. After this the resultant data is cleaned by removing the unwanted requests and by removing all requests that have .JPEG, .GIF and .CSS files in the URL Visited field.
The next step in pre-processing is user identification [10]. The log entries in the web log files are chronologically ordered based on the different user’s requests from their client machine to the web server. Hence the data records for each month (or any specific period range) are split.
From each month data identify different users[11]. One user is the request from a single Client IP address and User Agent field where the duration between two consecutive requests from the same Client IP address and User Agent does not exceed the idle time of 30 minutes. Based on this assumption, the records for each month is processed and the records with aggregated fields, From_Date, To_Date, User_Id, Page_Id,
Web Log Files
Pre-processing
Web Source Matrix
Transformation
Web Fuzzy Matrix Clustering
Visit_Frequency are obtained. The visit_frequency field has the count of the number of times the particular user visits the particular page. This is done and obtained for all months (periods), for all users and for all pages. Note, the period specification is optional to the user. That is the user can decide whether it is a Month or a Week, or Quarter or Semester or Year.
There is another type of data that is required out of this pre-processing step is that the number of common pages accessed by any set of users and the number of common users accessing any set of pages. This is also obtained by analyzing and aggregating the base data that is got after parsing and cleaning the web log files.
So, as a result of the pre-processing step, there are four types of web source matrix as listed below [4]. Let n be the total number of users and m be the total number of pages in a period.
1. Web source matrix for representing the visit frequency of each web user on each web page. This matrix is of the form upij where (i = 1, 2, ... n ; j = 1, 2, ... m)
2. Web source matrix for representing the visit frequency of each web page by each web user. This matrix is of the form puij where (i = 1, 2, ... m ; j = 1, 2, ... n).
3. Web source matrix for representing the common number of pages visited by each pair of web site users. This matrix is of the form uuij where (i = 1, 2, ... n ; j = 1, 2, ... n).
4. Web source matrix for representing the common number of users visiting every pair of web sites. This matrix is of the form ppij where (i = 1, 2, ... m ; j = 1, 2, ... m).
4.
TRANSFORMATION
A web source matrix of the form R = ( rij ) n x m can be
converted into a web fuzzy matrix R’ = ( rij ) n x n where
every rij ∈ [0,1]. This conversion is done by applying the
transformation step. That is by applying the below formula on the web source matrix the web fuzzy matrix is obtained.
rij = 1 − 𝑐 xik− xjk (1) 𝑚
𝑘=1
The c in the formula is the factor that is selected to make the rij in the range of [0,1] and it can be adjusted according to the
practical situation.
5.
CLUSTERING
The next step is performing the clustering of the web users and web pages. Under Web User Clustering there is Clustering based on the Relative Active Degree of the Web Users and Clustering based on the Correlative Degree of the Web Users. Similarly, under Web Page Clustering, there is Clustering based on the Relative Interestingness Degree of the Web Pages and there is Clustering based on the Correlative Degree of the Web Pages [5].
The Clusters under the category Relative Active Degree of the Web Users are named as Most Active Users, More Active Users, Active Users and Inactive Users. The Clusters under the category Correlative Degree of the Web Users are named as Most Firm Relation Users, More Firm Relation Users, Firm
The Clusters under the category Relative Interestingness Degree of the Web Pages are named as Most Interesting Pages, More Interesting Pages, Interesting Pages and Uninteresting Pages. The Clusters under the category Correlative Degree of the Web Pages are named as Most Firm Relation Pages, More Firm Relation Pages, Firm Relation Pages and In Firm Relation Pages.
For this clustering, sort the elements rij (i = 1,…,n; j = 1,…,m)
that are different from each other in the web fuzzy matrix R’ in the descending order of values and form a number list of the form L (1 = C1 > C2 >…> Cm) and let the factor C search
the number list L.
Of these elements of the number list L ignore the highest value C1 = 1. When evaluating C2, put xi and xj into one
cluster if rij = C2. When evaluating C3, put xi and xj into one
cluster if rij = C3. Combine this cluster with the existing
clusters formed by the previous steps if there is any common element in both these clusters. This step is repeated until all the web objects are in one cluster [6].
6.
APPLICATION AND RESULTS
Web access log data from a website of a university is taken to verify the results. Some web pages are selected from the result of the pre-processing step and made an abstract of the web page set and web users set as P = {p1, p2, p3, p4, p5, p6, p7, p8,
p9} & U = {u1, u2, u3, u4, u5}.
6.1. Web User Clustering
6.1.1 Relative Active Degree of Web Users
From the pre-processed data the total number of times each web user accessing each web page; upij where (i = 1,…,5; j =1,…,9) is obtained.
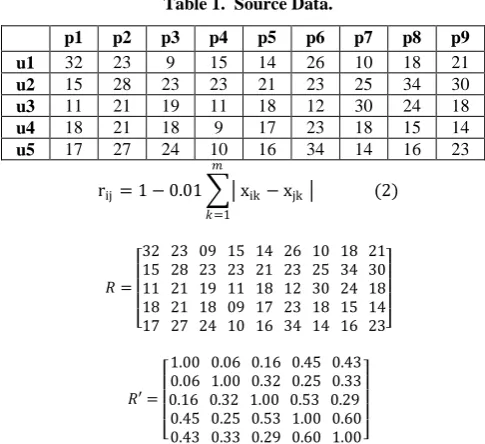
[image:2.595.304.547.507.729.2]From Table 1. the original web source matrix R is got. Web fuzzy matrix R’ is obtained after applying the transformation on the web source matrix using the above mentioned formula. In the formula the factor c is assumed to be 0.01.
Table 1. Source Data.
p1 p2 p3 p4 p5 p6 p7 p8 p9
u1 32 23 9 15 14 26 10 18 21
u2 15 28 23 23 21 23 25 34 30
u3 11 21 19 11 18 12 30 24 18
u4 18 21 18 9 17 23 18 15 14
u5 17 27 24 10 16 34 14 16 23
rij = 1 − 0.01 xik− xjk (2) 𝑚
𝑘=1
𝑅 =
32 23 09 15 14 26 10 18 21 15 28 23 23 21 23 25 34 30 11 21 19 11 18 12 30 24 18 18 21 18 09 17 23 18 15 14 17 27 24 10 16 34 14 16 23
𝑅′ =
1.00 0.06 0.16 0.45 0.43 0.06 1.00 0.32 0.25 0.33 0.16 0.32 1.00 0.53 0.29 0.45 0.25 0.53 1.00 0.60 0.43 0.33 0.29 0.60 1.00
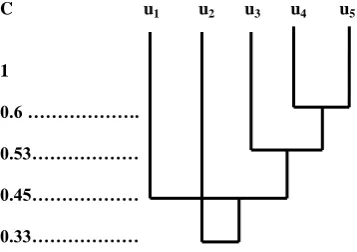
Form the descending degree of the values in the web fuzzy matrix. The values are: 1 > 0.6 > 0.53 > 0.45 > 0.43 > 0.33. When the value is 1 the web users set U is clustered into five clusters: {{u1}, {u2}, {u3}, {u4}, {u5}}. The result has no
distinct meaning here.
When the value is 0.6, it corresponds to the users u4 and u5.
Hence cluster u4 and u5 together. Now the user clusters are:
{{u1}, {u2}, {u3}, {u4, u5}}. The result shows that web users’
u4 and u5 are the most active users and their related active
degree is 0.6.
When the value is 0.53, it corresponds to the users u3 and u4.
Hence cluster u3 and u4 together. Since u4 is already in a
cluster with u5, cluster u3, u4 and u5 together. Now the user
clusters are: {{u1}, {u2}, {u3, u4, u5}}. The result shows that
web user u3 is the more active user and the related active
degree of u3, u4 and u5 is 0.53.
When the value is 0.45, it corresponds to the users u1 and u4.
Hence cluster u1 and u4 together. Since u4 is already in a
cluster with u5 and u3, cluster u1, u3, u4 and u5 together. Now
the user clusters are: {{u1, u3, u4, u5}, {u2}}. The result shows
that web user u1 is the active user and the related active degree
of u1, u3, u4 and u5 is 0.45.
When the value is 0.43, there will be no significant change in the clusters as it corresponds to the users u1 and u5 which are
already included in the above cluster.
When the value is 0.33, it corresponds to the users u2 and u5.
Hence cluster u2 and u5 together. Since u5 is already in a
cluster with u1, u3 and u4, cluster u1, u2, u3, u4 and u5 together.
Now the single user cluster is: {{u1, u2, u3, u4, u5}}. The result
shows that web user u2 is the inactive user and the related
active degree of all the users is 0.33.
Now stop clustering as all the users are in a single cluster.
C u1 u2 u3 u4 u5
1
0.6 ……….
0.53………
0.45………
[image:3.595.354.502.109.249.2]0.33………
Fig 2: Resultant Graph1 of the user clusters
6.1.2 Correlative Degree of Web Users
From the pre-processed data the total number of common pages accessed by a set of web users; uuij where (i = 1,…,5; j
= 1,…5) is obtained.
Table 2. Source Data
u1 u2 u3 u4 u5
u1 5 3 6 1 4
u2 1 8 3 2 0
u3 2 7 9 4 3
u4 8 2 8 7 7
u5 1 5 4 3 2
From Table 2, R and R’ are got and the factor c in the transformation step is set to 0.02.
rij = 1 − 0.02 xik− xjk (3) 𝑚
𝑘=1
𝑅 =
5 3 6 1 4 1 8 3 2 0 2 7 9 4 3 8 2 8 7 7 1 5 4 3 2
𝑅′ =
1.00 0.66 0.72 0.70 0.76 0.66 1.00 0.74 0.40 0.88 0.72 0.74 1.00 0.62 0.80 0.70 0.40 0.62 1.00 0.54 0.76 0.88 0.80 0.54 1.00
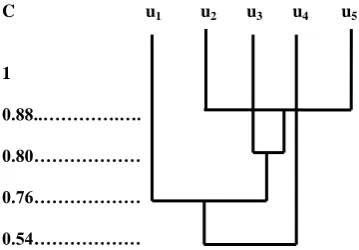
After this apply clustering step to get the web user clusters based on the correlative degree of the web users. Form the descending degree of the values in the web fuzzy matrix. The values are: 1 > 0.88 > 0.80 > 0.76 > 0.74 > 0.66 > 0.62 > 0.54. When the value 1 the web users set U is clustered into five clusters: {{u1}, {u2}, {u3}, {u4}, {u5}}. The result has no
distinct meaning here.
When the value is 0.88, it corresponds to the users’ u2 and u5.
Hence cluster u2 and u5 together. Now the user clusters are:
{{u1}, {u3}, {u4}, {u2, u5}}. The result shows that web users’
u2 and u5 are the most firm relation users and their correlative
degree is 0.88.
When the value is 0.80, it corresponds to the users’ u3 and u5.
Hence cluster u3 and u5 together. Since u5 is already in a
cluster with u2, cluster u2, u3 and u5 together. Now the user
clusters are: {{u1}, {u4}, {u2, u3, u5}}. The result shows that
web user u3 is the more firm relation user and the related
correlative degree of u2, u3 and u5 is 0.80.
When the value is 0.76, it corresponds to the users’ u1 and u5.
Hence cluster u1 and u5 together. Since u5 is already in a
cluster with u2 and u3, cluster u1, u2, u3 and u5 together. Now
the user clusters are: {{u4}, {u1, u2, u3, u5}}. The result shows
that web user u1 is the firm relation user and the related
correlative degree of u1, u2, u3 and u5 is 0.76.
When the values are 0.74, 0.66 and 0.62 there will be no significant change in the clusters as it corresponds to the users’ u1, u2 and u3 which are already included in the above
cluster.
When the value is 0.54, it corresponds to the users’ u4 and u5.
Hence cluster u4 and u5 together. Since u5 is already in a
cluster with u1, u2 and u3, cluster u1, u2, u3, u4 and u5 together.
Now the single user cluster is: {{u1, u2, u3, u4, u5}}. The result
shows that web user u4 is the infirm relation user and the
[image:3.595.54.233.458.584.2]C u1 u2 u3 u4 u5
1
0.88..………….….
0.80………
0.76………
0.54………
Fig 3: Resultant Graph2 of the user clusters
6.2. Web Page Clustering
6.2.1 Relative Interestingness Degree of Web
Pages
From the pre-processed data the total number of times each web page accessed by each user; puij where (i = 1,…,9; j =
1,…,5) is got. From Table 3, R and R’ are obtained and the factor c in the demarcation step is set to 0.01.
rij = 1 − 0.01 xik− xjk (2) 𝑚
[image:4.595.53.233.72.197.2]𝑘=1
Table 3. Source Data
u1 u2 u3 u4 u5
p1 32 15 11 18 17
p2 23 28 21 21 27
p3 9 23 19 18 24
p4 15 23 11 9 10
p5 14 21 18 17 16
p6 26 23 12 23 34
p7 10 25 30 18 14
p8 18 34 24 15 16
p9 21 30 18 14 23
𝑅 =
32 15 11 18 17 23 28 21 21 27 09 23 19 18 24 15 23 19 18 24 14 21 18 17 16 26 23 12 23 34 10 25 30 18 14 18 34 24 15 16 21 30 18 14 23
𝑅′ =
1.00 0.55 0.54 0.59 0.67 0.63 0.46 0.50 0.57 0.55 1.00 0.73 0.48 0.66 0.74 0.59 0.69 0.82 0.54 0.73 1.00 0.63 0.83 0.61 0.76 0.64 0.75 0.59 0.48 0.63 1.00 0.76 0.50 0.61 0.61 0.62 0.67 0.66 0.83 0.76 1.00 0.56 0.77 0.75 0.74 0.63 0.74 0.61 0.50 0.56 1.00 0.39 0.43 0.62 0.46 0.59 0.76 0.61 0.77 0.39 1.00 0.72 0.59 0.50 0.69 0.64 0.61 0.75 0.43 0.72 1.00 0.79 0.57 0.82 0.75 0.62 0.74 0.62 0.59 0.79 1.00
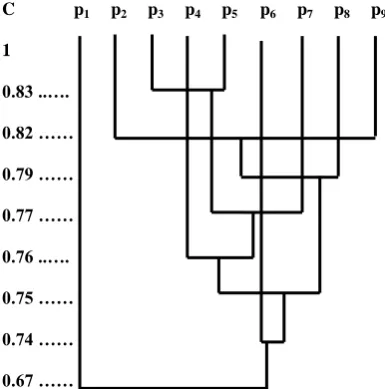
After this apply clustering step to get the web page clusters based on the relative interesting degree of the web pages. Form the descending degree of the values in the web fuzzy matrix. The values are: 1 > 0.83 > 0.82 > 0.79 > 0.77 > 0.76 > 0.75 > 0.74 > 0.73 > 0.72 > 0.69 > 0.67.
When the value is 1 the web pages set P is clustered into nine clusters: {{p1}, {p2}, {p3}, {p4}, {p5}, {p6}, {p7}, {p8}, {p9}}.
The result has no distinct meaning here.
When the value is 0.83, it corresponds to the pages p3 and p5.
Hence cluster p3 and p5 together. Now the page clusters are:
{{p1}, {p2}, {p3, p5}, {p4}, {p6}, {p7}, {p8}, {p9}}. The result
shows that web pages’ p3 and p5 are the most interesting pages
and their related active degree is 0.83.
When the value is 0.82, it corresponds to the pages p2 and p9.
Hence cluster p2 and p9 together. Now the page clusters are:
{{p1}, {p2, p9}, {p3, p5}, {p4}, {p6}, {p7}, {p8}}. The result
shows that web pages’ p2 and p9 are the most interesting pages
and their related active degree is 0.82.
When the value is 0.79, it corresponds to the pages p8 and p9.
Hence cluster p8 and p9 together. Since p9 is already in a
cluster with p2, cluster p2, p8 and p9 together. Now the page
clusters are: {{p1}, {p2, p8, p9}, {p3, p5}, {p4}, {p6}, {p7}}.
The result shows that web page p8 is the more interesting page
and the related active degree of p2, p8 and p9 is 0.79.
When the value is 0.77, it corresponds to the pages p5 and p7.
Hence cluster p5 and p7 together. Since p5 is already in a
cluster with p3, cluster p3, p5 and p7 together. Now the page
clusters are: {{p1}, {p2, p8, p9}, {p3, p5, p7}, {p4}, {p6}}. The
result shows that web page p7 is the more interesting page and
the related active degree of p3, p5 and p7 is 0.77.
When the value is 0.76, it corresponds to the pages p4 and p5.
Hence cluster p4 and p5 together. Since p5 is already in a
cluster with p3 and p7 cluster p3, p4, p5 and p7 together. Now
the page clusters are: {{p1}, {p2, p8, p9}, {p3, p4, p5, p7},
{p6}}. The result shows that web page p4 is the interesting
page and the related active degree of p3, p4, p5 and p7 is 0.76.
When the value is 0.75, it corresponds to the pages p3 and p9.
Hence cluster p3 and p9 together. Since p3 is already in a
cluster with p4, p5 and p7, and p9 is already in cluster with p2
and p8, cluster p2, p3, p4, p5, p7, p8 and p9 together. Now the
page clusters are: {{p1}, {p2, p3, p4, p5, p7, p8, p9}, {p6}}. The
result shows that web pages p3 and p9 are the interesting pages
and the related active degree of p2, p3, p4, p5, p7, p8 and p9 is
0.75.
When the value is 0.74, it corresponds to the pages p2 and p6.
Hence cluster p2 and p6 together. Since p2 is already in a
cluster with p3, p4, p5, p7, p8 and p9, cluster p2, p3, p4, p5, p6, p7,
p8 and p9 together. Now the page clusters are: {{p1}, {p2, p3,
p4, p5, p6, p7, p8, p9}}. The result shows that web page p6 is the
uninteresting page and the related active degree of p2, p3, p4,
p5, p6, p7, p8 and p9 is 0.74.
When the values are 0.73, 0.72 and 0.69 there will be no significant change in the clusters as it corresponds to the pages p2, p3, p7 and p8 which are already included in the above
cluster.
When the value is 0.67, it corresponds to the pages p1 and p5.
Hence cluster p1 and p5 together. Since p5 is already in a
cluster with p2, p3, p4, p6, p7, p8 and p9, cluster p1, p2, p3, p4, p5,
p6, p7, p8 and p9 together. Now the single page cluster is: {{p1,
p2, p3, p4, p5, p6, p7, p8, p9}}. The result shows that web page
p1 is the uninteresting page and the related active degree of p1,
p2, p3, p4, p5, p6, p7, p8 and p9 is 0.67.
C p1 p2 p3 p4 p5 p6 p7 p8 p9
1
0.83 ..….
0.82 ……
0.79 ……
0.77 ……
0.76 ..….
0.75 ……
0.74 ……
[image:5.595.53.246.73.268.2]0.67 ……
Fig 4: Resultant Graph1 of the page clusters
6.2.2 Correlative Degree of Web Pages
This step can be deduced by analogy as in the previous steps.
7.
CONCLUSION
In this paper, the concept and processing model of Matrix Based Fuzzy Clustering Approach MBFCA is put forward and discussed. The experimental results are shown to prove that this approach can be used for effective web user clustering and web page clustering. This is a simple to implement approach. This approach will produce efficient clusters of web users and web pages with less run time and with reduced memory usage. The resultant web page and web user clusters are found to match the existing web page and web user clusters in the given sample data. One future work on this could be to create matrices that reflect the time each user spends on each page and come up with a different set of web user and web page clusters based on this data. Another future scope for this approach is that this can be automated using any programming language and can be used to measure the efficiency of this approach for many web sites.
8.
REFERENCES
[1] Jiawei Han and Micheline Kamber, Data Mining Concepts and Techniques, 2nd ed., China Machine Press, Beijing, China, 2007.
[2] Han, Q., Gao, X., Wu, W.: Study on Web Mining Algorithm Based on Usage Mining. In: 9th International Conference on Computer-Aided Industrial Design and Conceptual Design, CAID/CD November 2008. [3] Ying-Gui Li and Gui-Ji LI, Web Log Mining Based On
Fuzzy Clustering, Computer Science, China, 2004, 31(12):97-100.
[4] Jing-Gong Li and Xiang-Gong WangS. Zhang, Fuzzy Set Theory And Application, Chain Science Press, Beijing, China, 2004.
[5] M. J. Martin-Bautista, D. H. Kraft, M. A. Vila, J. Chen and J. Cruz, “User profiles and fuzzy logic for Web retrieval issues,” in Soft Computing Journal, 2004, vol. 6, number 5, pp. 365-372.
[6] D. Arotaritei and S. Mitra, “Web Mining: a survey in the fuzzy framework,” in Fuzzy Sets and System, 2000, vol. 148, pp. 5-19.
[7] Facca, F. M., & Lanzi, P. L. (2005). Mining Interesting Knowledge from Weblogs: A Survey, 53, 225–241. [8] RENATA IVANCSY and FERENC KOVACS,
“Clustering Techniques Utilized in Web Usage Mining,” in Proceedings of the 5th WSEAS Int. Conf. on Artificial Inlelligence, Knowledge Engineering and Data Bases, Madrid, Spain, February 15-17, 2006, pp. 237-242. [9] S. Araya, M. Silva and R. Weber, “A methodology for
web usage mining and its application to target group identification,” in Fuzzy Sets and Systems, 2004, vol. 148, pp. 139-152.
[10]Sudhamathy, G. 2010. Mining web logs: an automated approach. In Proceedings of the 1st Amrita ACM-W Celebration on Women in Computing in india (Coimbatore, India, September 16 - 17, 2010). A2CWiC '10. ACM, New York, NY, 1-4. DOI= http://doi.acm.org/10.1145/1858378.1858435
[11]Mobasher, B., Cooley, R., Srivastava, J.: Automatic Personalization Based on Web Usage Mining (2000), http://maya.cs.depaul.edu/~mobasher/personalization/ [12]J. Srivastava, R. Cooley, M. Deshpande and P. N. Tan,
“Web usage mining: discovery and applications of usage patterns from web data,” SIGKDD Explorations, 2000, vol. 1, number 2, pp. 12-23.
[13]A. Vakali, J. Pokorný and T. Dalamagas, “An Overview of Web Data Clustering Practices,” EDBT Workshops, 2004, pp. 597-606.
[14]Xinlin Zhang, Xiangdong Yin “Design of an Information Intelligent System based on Web Data Mining”, IEEE International Conference on Computer Science and Information Technology, 2008, p. 88-91.
[15]Chu-Hui Lee, Yu-Hsiang Fu “Web Usage Mining Based on Clustering of Browsing Features”, IEEE Eighth International Conference on Intelligent Systems Design and Applications, 2008, p. 281-286.