Protein Data Representation: A Survey
Ahmed S. Fadel
Faculty of ICS, The British University in Egypt, Cairo,
Egypt
Mohamed Belal
Department of Computer Science, Helwan University,
Cairo, Egypt
Mostafa-Sami M. Mostafa
Department of Computer Science, Helwan University,
Cairo, Egypt
ABSTRACT
One of the critical issues in bioinformatics is the data structure used for representing the protein data; this representation is a base for the operations applied such as sequence alignment, structure alignment and motif finding.
In this paper, a survey of different representations and well-known data structures used for protein data is presented from a computer science perspective. This work presents a survey and summarizes the efforts done for protein data representation and approximation. Hence, it could be a basic reference for research that is aiming to develop applications in the field of bioinformatics.
General Terms
Protein, Data structureKeywords
Protein representation; Protein structure; Data structure; Data reduction; Protein structure approximation.
1.
INTRODUCTION
Proteins are important components of life. A cell of a living organism consists of water (70%) and proteins (15%-20). The sequence of amino acids in a protein determines its structure, which in turn determines its function. In 2005, Science Journal considered the protein folding problem one of the 125 biggest unsolved problems in science (Science Editorial, 2005).
Protein data representation is a very critical issue. Good choice of data representation and a suitable data structure is believed to boost up the simplicity and performance of the algorithm used significantly. However data structures are given less focus in surveys and reviews in bioinformatics research in spite of their central position in any operation like sequence alignment and motif finding.
A much related problem is the data reduction in bioinformatics. Data reduction is a wide area of research and can serve in many areas especially that deal with multimedia contents. It aims to reduce and remove redundant data. This reduction can optimize the operations used in many operations in applications like visualization, reporting, decision making, and predictions. Protein 3D structure can be treated as a geometric shape. Therefore, research done in the fields of computer graphics and computer vision in data reduction of geometric shapes can serve in protein research.
There are some efforts that were done in order to generate a reduced representation for protein data. Some of these efforts were done for the aim of visualization [1] and others were done to simplify the process of finding similarity between proteins [2] and [3]. Marsolo [4] reduced the protein data using 2D Haar wavelet transform.
There are some good surveys about algorithms for bioinformatics [5], fold recognition [6], protein surfaces [7]
sequence alignment and classification [8] [9], protein prediction [10] [11] [12] [13] [14] , protein interaction [15] and protein geometry [16]. But, to the best of our knowledge, there is no research work that summarizes the work done in data structure and reduction in protein data representation. Therefore, the purpose of this paper is to highlight the popular data structures used in protein research and to introduce the idea of broadening the use of data reduction techniques in protein research.
The paper is organized as follows; Section 2 reviews the common representations for protein data in each level of its hierarchy. Section 3 surveys the well known file formats and the popular data structures used in protein research and how they were used for representing the protein structure data for many applications. Section 4 surveys the approaches used for reducing and approximating protein data. Finally concluding remarks are enclosed in order to summarize and comment on the work introduced by this paper.
2.
PROTEINS STRUCTURE
HIERARCHY AND REPRESENTATION
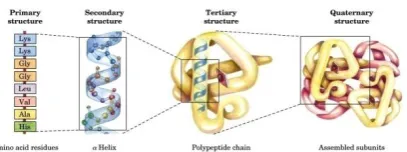
Before going into the details of the different approaches used in data representation of protein structure as presented in section 3, this section gives a background on the nature of protein structure in biology from a computer science perspective.Proteins structure hierarchy consists of four levels, as shown in figure 1. The primary structure consists of a sequence of amino acid residues assembled together in a polypeptide chain. Amino acids are the building units of proteins; each amino acid is coded by three of the four nucleotide bases (A, C, T and G).There are twenty amino acids that build protein [17].
Primary structure leads to the secondary structure. The secondary structure is characterized by the local conformation of the polypeptide chain or the spatial arrangements of amino acid residues. There are 3 basic units of secondary structure: Helices, sheets and coils.
Tertiary structure represents the overall three-dimensional structure, or the fold, of the polypeptide chain. The Tertiary structure is very important since it determines the function of the protein.
[image:1.595.328.532.667.743.2]Quaternary structure explains the existence of more than one polypeptide chain found in many proteins.
Proteins are responsible for performing many functions in the body. Their functions are determined by their tertiary structure. For example, collagen has a super-coiled helical shape. It is long, stringy, strong, and similar to a rope. So it provides great support. Hemoglobin is a globular protein. It is folded and compact. Its spherical shape facilitates maneuvering through blood vessels [18].
The primary structure is represented as a sequence of letters in which each letter represents one of the 20 amino acids. For example it may be represented as follows:
VGPKTGEENENLEVVGDITSSINLVGEEEA
This representation facilitates the sequence alignment and extracting features like Amino acid composition (AAC) which is a feature of protein in defined by a feature vector that is 20-dimensional. The feature vector consists of the frequency of occurrence of the 20 amino acids.
The secondary structure can be represented as a sequence of Secondary structure elements (SSE). Dictionary of Protein Secondary structures (DSSP) [19] uses the following notation H=α-helix, G=310-helix, I=Π-helix, E=β-strand, B=β-isolated, T=turn, S=bend and – (other).
The tertiary structure is represented as a sequence of 3-D coordinates of the atoms of the amino acids with focus on the Cα atoms, in which it can be represented as a geometric shape.
To conclude, Working with primary structure depends mainly on manipulating strings of letters representing the amino acids. The most important operation is aligning two or more strings, which is not a simple task. This may require also some calculations like the frequency of each letter and may use scoring matrices like PAM or BLOSUM to evaluate the alignment. Secondary structure elements can be viewed as geometric shapes. A lot of computer science techniques are employed to recognize them and represent them by letters like in the primary structure representation. This approach reduces the problem of structure alignment to sequence alignment. On the other hand, working with tertiary structures is very challenging. Proteins have a huge number of different complex conformations in 3D space which makes it very difficult to manipulate them. Working on tertiary structure requires studying state of art techniques of computer vision and computer graphics.
3.
PROTEIN DATA REPRESENTATION
In bioinformatics, there are well known file formats for storing protein data. Some formats are used for storing the sequence information for unaligned sequences i.e. FASTA, Genbank, EMBL, or SWISS-PROT while others are used for storing the sequence information for the aligned sequences i.e. ClustalW, GCG MSF, and SELEX format. There are also file formats used for storing the protein structure data i.e. Protein Data Base (PDB) and Protein Structure File (PSF). These file formats are used by researchers in molecular biologists and many websites and software for bioinformatics.FASTA is the name of a popular sequence alignment and database scanning program. It starts with a definition line followed by DNA or protein sequences. It doesn’t contain information about the protein structure [17].
The PDB is large database for the protein 3D structures. Today there are more than 80,000 structures in the PDB and growing weekly. The PDB is maintained by RCSB, which organizes the PDB structures. The PDB website provides
structural information in various formats such as the PDB. The PDB also provides information about the sequence, sequence similarity, and biological and chemical properties of the protein along with links to various visualization tools. [20].
A lot of efforts were done in the area of protein research. Each research focused on one or more levels of protein structure. Some used geometric models and others used statistical models and many other models. These models require a suitable data structure to efficiently represent the protein data to optimize the performance of the algorithm used.
For example, Xu, Li & Gu [21] represented protein tertiary structure by three kinds of geometric models, which are polyline curves, triangulated surfaces and volumetric solids. It employed moment invariants to describe the shapes of the three kinds of protein models and compute a multidimensional feature vector for each one. They were then applied in protein shape retrieval and classification. Xu, Li & Gu [22] also used a geometric model and calculated the Voronoi diagram using Delaunay triangulation. It applied Voronoi diagram and area calculation in measuring protein packing which is an important feature of protein structure.
Wang et al. [23] presented an approach for protein classification using artificial neural networks based on convex hull representation. Protein tertiary structure can be represented as a sequence of coordinates of Cα atoms. The protein surface can be approximated by a set of faces of the protein’s convex hull. The convex hull representation can be used to extract features like the number of the amino acids, the vertices number, supporting plane number, diameter, area and volume of the convex hull. This representation can be used for protein classification.
Many protein researchers adopted data structures to represent the protein data; the primary, secondary or tertiary. The most commonly used data structures are text strings, graphs, suffix trees and distance matrices. Each one has its own advantages over the others as it will be explained in the next sub-sections.
3.1
Using text strings for protein structure
representation
A text string is a sequence of letters of an alphabet. It is stored as an array of characters. It is simple and easy to manipulate. It can be used to represent the DNA sequence which is composed of the 4 letters alphabet (A, C, T and G) which denotes the 4 nucleotide bases. Also it can be used to represent the primary structure of a protein which is composed of the 20 letters alphabet, where each letter denotes an amino acid.
This representation is used to align these sequences by the famous algorithms Needleman and Wunsch [24] for global alignment and Smith and Waterman [25] for local alignment. Other methods used text strings to represent the secondary structure elements of the protein [26]. These representations can be used by string matching (exact or inexact) and can be used with dynamic programming, suffix trees and hashing.
3.2
Using suffix tree for protein structure
representation
alphabet, such as amino acids. Therefore it is effective in indexing sequences to speed up database queries [27].
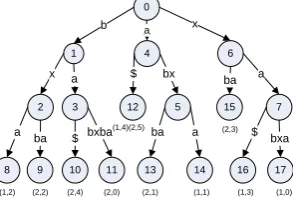
Gao & Zaki [27] presented a method for indexing protein called Protein Structure Indexing using Suffix Trees (PSIST). The idea behind this method is to transform the local structural information of a protein into a string of letters. A suffix tree is then constructed for fast matching. A sliding window technique is used to extract local structural feature vectors along the backbone. For each pair of residues, the distance between the Cα atoms and the angle between the planes formed by the Cα, N and C atoms of each residue are calculated. The feature vectors for a given window contain all the distances and angles between the first residue and the other residues within the window. They also contain the translational and rotational information. After feature vectors normalization, the protein structure is converted to SF (structure-feature)-sequence of discretized symbols. Then suffix trees can be used to find the maximal matches between SF sequences and to measure the similarity between structures. Figure 2 shows a general suffix tree for sequences S1 = xabxa and S2 = babxba.
0
b
(1,4)(2,5)
1
a
4 x
6
x
2 a
3 $
12 bx
5 ba
15 a
7
(2,3)
a
8 ba
9 $
10 bxba
11 ba
13 a
14
(1,3)
$
16 bxa
17
(1,0) (1,1)
[image:3.595.323.536.271.346.2](2,1) (2,0) (2,4) (2,2) (1,2)
Figure 2 General suffix tree for sequences S1 = xabxa and S2 = babxba
RMSD (Root Mean Square Deviation) and URMSD (Unit-Vector Root Mean Square Deviation) are widely used in evaluating the accuracy of similarity but, it is difficult to use them to index proteins strictly [28].
Shibuya & Tetsuo [28] proposed the geometric suffix tree , a new data structure that can be used in indexing searching of all the substructures in a database of protein structures having RMSD or URMSD less than a threshold. The geometric suffix tree is analogous to the well-known suffix tree. The substrings of texts in the ordinary suffix tree are represented by edges, while in the geometric suffix tree the 3-D substructures of protein 3-D structures are the data represented by the edges. The geometric suffix tree has space complexity O(N) where N is the sum of the protein lengths in the database. The proposed algorithm constructs the tree in O(N2) [28].
3.3
Using graphs for protein structure
representation
Different biological networks can be represented by different types of graphs. For example, protein-protein interaction networks can be represented by undirected graphs where nodes represent proteins and an edge between two nodes represents an interaction between these two proteins. Gene-regulatory networks can be represented by directed graphs where nodes represent genes encoding transcription factors (or other types of proteins) and links represent transcriptional regulation. Metabolic networks can be represented by bipartite graphs where nodes are divided into two sets (enzymes and substrates) [29].
Phung, Phuc & Kim [30] presented a system for clustering graphs for protein structures. Graph is represented by graph spectra which are a set of eigenvalues of the normalized Laplacian matrix representing the graphs. The graph database is clustered by the self-organizing map(SOM) neural network and eigenvalues. The system has the features of visualizing and similarity search in the graph database of the protein structures.
In the system, Phung, Phuc & Kim [30] proposed a graph clustering system using the SOM neural network and graph spectra. It selected the position of Cα atom to represent amino acid in the graph. An edge connects two vertices if the Cα atoms of the two amino acids are close to each other by distance within a range. The feature vector is extracted after sorting the eigenvalues in descendant order. Using graph spectra speeds up the SOM network training compared to direct calculation on graphs. Figure 3 shows a protein and a graph representing its structure.
VAL45
ASP2
ASN4
GLY9
TYR3
GLN15
SER49
ILE211
MET222
Figure 3 A protein and a graph representing its structure
Shin, Tsuda & Scholkopf [31] presented a framework for integrating multiple graphs representing different descriptions such as protein-protein interactions, genetic interactions, or co-participation in a protein complex. Integrating the graphs gives comprehensive information. The method alternates between minimizing the objective function with respect to network output and with respect to combining weight like the expectation-maximization algorithm. The performance of the proposed method was better than applying the same algorithm on a single graph.
Graphs were used in pattern recognition and machine vision to represent object models aiming to reduce the object recognition problem to graph matching problem. Graph matching is either exact or inexact. In exact matching a model graph is matched with an input graph or a part of it. This problem can be solved using sub-graph isomorphism or graph monomorphism. In Inexact or error-correcting matching, it is required to find the bijection between two subgraphs from the model and input graph that minimizes some error function. This error is typically the cost of deforming the original graphs to their subgraphs and the error of matching the attributes of corresponding elements in the two subgraphs. The most popular approach for error-correcting graph matching is the A* algorithm [32].
[image:3.595.92.239.305.406.2]3.3.1
Using contact maps protein structure
representation
Contact map is a special kind of graph data structure. It is a graph which has no weights. It is used to show the contact between amino acids in a protein without a distance measure. A contact map is a representation of a protein’s tertiary structure. It represents it with a binary matrix. A cell in the matrix has the value “1” if the two amino acids of the row and the column of the cell are in “contact” (the Euclidean distance between them is less than a threshold). Graphically, this means that an edge is added between two residues in contact with each others. An alignment between two contact maps is an assignment of residues in one to those of the equivalent other. The similarity between proteins is indicated by the number of equivalent contacts, which determines the overlap of the contact maps [5].
Protein Structure Selection problem (PSS), tries to select the closest 3D structures (called decoys) to an input structure out of a large search space according to a distance measure. Many heuristics have been developed for solving PSS which depend on the so called energy functions. As energy of a decoy decreases the closer it is to the 3D structure of the input protein[33].
Vassura et al. [33] presented an approach to solve PSS by analyzing some selected graph properties of decoys graphs using contact maps. This approach produces a ranking of the decoys according to seven graph properties, average degree, contact order, normalized complexity, network flow, connectivity, and a weighted version of network flow and connectivity. This approach performs well and maybe better than approaches based on energy functions.
Tsatsaias, Daras & Strintzis [34] segmented the 3D structure of the protein from PDB files to create a proteinic graph. The descriptors for a segment were calculated using the spherical harmonics coefficients and then used as the graph nodes’ attributes. Each segment is represented by a vertex in the graph. An edge is added between connected segments. Successive Projection Graph Matching Algorithm (SPGM) is used in matching the undirected attributed graphs. If two graphs are partially matched, then a transformation matrix P that transforms the first graph to the second is computed. The best possible estimation of P is computed using the SPGM algorithm. Therefore, the problem of attributed graph matching is reduced to an optimization problem. Then the extracted geometric and topological information were merged with biochemical data.
Strickland, Barnes & Sokol [35] used the maximum Contact Map Overlap (CMO) model in protein structural alignment. It showed that the problem of determining the maximum number of overlaps that occur between two proteins can be reduced to the problem of solving a maximum clique problem with a specific representation of graph GP= (NP, EP). Suppose
that CA and CB are the set of contacts in two proteins A and B. a two-dimensional grid NP = CA×CB has a row of vertices for
each contact in CA and a column of vertices for each contact in CB. Each vertex represents an overlap between contact (iA,
jA) in protein A and a contact (iB, jB) in protein B. it also
represents an alignment of amino acid iA with amino acid iB
and an alignment of amino acid jA with amino acid jB. Figure
4 shows a contact map for a hypothetical protein A with eight amino acids & five contacts.
[image:4.595.318.541.78.138.2]A1 A2 A3 A4 A5 A6 A7 A8
Figure 4 Contact map for a hypothetical protein A
Graph representation gives the advantage of using the large number algorithms related to graphs i.e. graph isomorphism since the work of Euler in 1736 and his famous Konigsberg bridge problem. It is good in searching for known substructures and motifs but not very useful in discovering unspecified common substructures (sub graphs) [36].
3.4
Using distance matrices for protein
structure representation
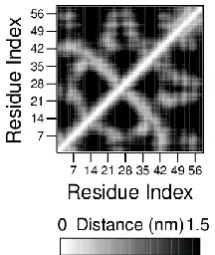
A distance matrix is a 2D matrix used to represent the 3D structure of protein. The cells of the matrix contain the distance between every pair of Cα atoms in the same protein. The protein structure can be transformed into a distance matrix D with dimensions n*n, where n is the number of amino acids in the protein. Each cell of the matrix, D[i,j] contains the distance between Cαi and Cαj where i,j ={1,.,.,n}.
The actual 3D coordinates can be recalculated using distance geometry methods. A distance matrix is an important intermediary structure that can be used later in comparing protein 3D structures. They can also represent specific protein structural topologies, and similar proteins will generate similar matrices [37]. Figure 5 shows a distance matrix for 8 amino acid residues with distance up to 1.5nm.The darker gray represents longer distance.
Figure 5 Distance matrix for 8 residues
Chi [37] presented an efficient system for protein structure retrieval based on computer vision algorithms to extract features from distance matrices and used entropy balanced statistical (EBS) k-d tree, for indexing protein 3D structures in the multi-dimensional feature space.
[image:4.595.377.485.426.554.2]Sacan, Toroslu & Ferhatosmanoglu [38] proposed a method for protein structure retrieval called Residue-Contacts Index (RCIndex) based on identifying similar residue contacts from a protein structures database identified using the distance-based indexing. High scoring Segment Pairs (HSPs) was calculated based on a contact string using dynamic programming. RCIndex is effective in identifying similar proteins and can produce structural alignments that are comparable to or better than those produced by popular pairwise alignment methods. This method can perform the protein structure retrieval and the structural alignment tasks simultaneously.
4.
PROTEIN STRUCTURE REDUCTION
AND APPROXIMATION
There are some efforts that were done in order to generate a reduced representation for protein data. Some of these efforts were done for the aim of visualization[1] while others were done to simplify the process of finding similarity between proteins[2] and [3].
Schwarzer & Lotan [2] presented an approach for approximating protein structure for fast similarity. This approach resulted in reduced storage, running time and good accuracy. In applications which require high accuracy the it can be used as a filtering step to filter a small subset of pairs that are within some threshold regarding similarity. It presented two applications; the first is finding k nearest neighbors in large sets of conformations of the same protein. The second application is STRUCTAL proteins classification algorithm. For the first application, the resulting error of was low and the correlation to the true similarity measure was very high while for the second application, the resulting error was very high and the correlation to the true similarity measure was significantly lower [2].
Peto et al. [3] presented a compact representation for protein conformations with simple geometries on the two-dimensional 2D triangular and 3D face centered cubic lattice. These compact conformations are analogous to Hamiltonian paths and Hamiltonian circuits and are frequently used as simple models of proteins. This technique simplified the complexity of the geometrical problem to a simple algebraic problem of matrix multiplication. It also used reduced representation for the amino acid alphabet which consists of 20 letters with the simpler binary Hydrophobic/Polar (H/P) representation.
Sheth & Vrunda[1] presented the Double Centroid Reduced Representation or the (DCRR) model which depends on biological information for the aim of visualization. DCRR tries to compromise between All Atom Representation which displays too much chemical information which results in unclear display, and the ribbon model which excludes too much chemical information, which results in unclear display of side chains residues. The first step was to separate the backbone atoms from the side-chain atoms and then compute the 'geometric' or 'positional centroid' of the backbone and the side-chain atoms. The centroid is the average of the x, y and z coordinates of the backbone and the side chain atoms of each amino acid. The second step was to determine the neighborhoods of the atoms. Two atoms are considered neighbors if the distance between is within a threshold.
5.
CONCLUDING REMARKS
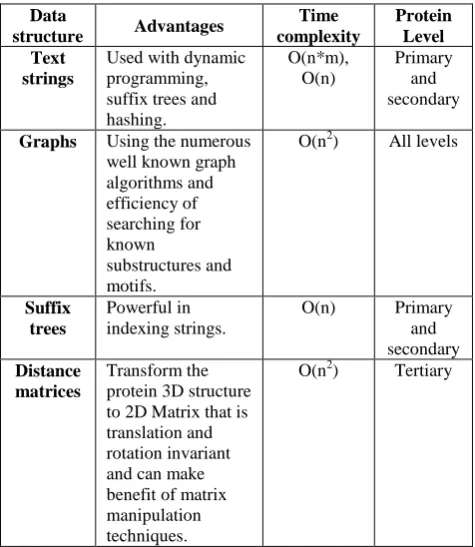
This paper presented a survey on protein data representation and reduction. It showed different representations for protein structure data using several data structures like text strings, graphs, suffix trees and distance matrices. Each data structure
[image:5.595.310.548.134.408.2]has advantages over the others. Table 1 summarizes the advantages of each data structure, its time complexity for the main operation and the level of the protein hierarchy at which it operates.
Table 1. Comparison between surveyed data structures
Data
structure Advantages
Time complexity
Protein Level Text
strings
Used with dynamic programming, suffix trees and hashing.
O(n*m), O(n)
Primary and secondary
Graphs Using the numerous well known graph algorithms and efficiency of searching for known
substructures and motifs.
O(n2) All levels
Suffix trees
Powerful in indexing strings.
O(n) Primary and secondary
Distance matrices
Transform the protein 3D structure to 2D Matrix that is translation and rotation invariant and can make benefit of matrix manipulation techniques.
O(n2) Tertiary
This paper can be used as a base for the researchers who want to find better or advanced techniques in this domain. Additionally, it can be used for a beginner researcher who wants to survey the different approaches used in protein data structures and reduction approaches.
It was apparent that techniques of protein structure reduction and approximation vary in their scope in order to reduce and approximate the data without losing much detail. This reduction for data will significantly speed up operations like matching and classification.
However, from our point of view, more efforts in this field should be done in order to efficiently use data structures for protein data representation, reduction and approximation and achieve benefit of the well known algorithms which employed these data structures.
6.
REFERENCES
[1] V Sheth, "Visualization of protein 3D structures in reduced representation with simultaneous display of intra and inter-molecular interactions," phdthesis 2009. [2] Fabian Schwarzer and Itay Lotan, "Approximation of
Protein Structure for Fast Similarity measures," in
Proceedings of the seventh annual international conference on Research in computational molecular biology RECOMB '03, 2003.
[3] M. Peto, T.Z. Sen, R.L. Jernigan, and A. Kloczkowski, "Generation and enumeration of compact conformations on the two-dimensional triangular and three-dimensional fcc lattices," The Journal of chemical physics, vol. 127, p. 044101, 2007.
Information Systems, vol. 14, no. 1, pp. 59-80, 2008. [5] Hayashi, Sushmita Mitra, and Yoichi, "Bioinformatics
With Soft Computing," IEEE TRANSACTIONS ON SYSTEMS, MAN, AND CYBERNETICS, vol. 36, no. 5, 2006.
[6] M S Abual-Rub and R Abdullah, "A Survey of Protein Fold Recognition Algorithms," Journal of Computer Science, vol. 4, pp. 768--776, 2008.
[7] A Via, F Ferre, B Brannetti, and M Helmer-Citterich*, "Protein surface similarities: a survey of methods to describe and compare protein surfaces," Cellular and Molecular Life Sciences, vol. 57, pp. 1970--1977, 2000. [8] C Notredame, "Recent progress in multiple sequence alignment: a survey," Pharmacogenomics, vol. 3, pp. 131--144, 2002.
[9] Z Xing, J Pei, and E Keogh, "A brief survey on sequence classification," ACM SIGKDD Explorations Newsletter, vol. 12, pp. 40--48, 2010.
[10] Z Xiu-fen, P Zi-shu, K Li-shan, and Z Chu-yu, "The evolutionary computation techniques for protein structure prediction: A survey," Wuhan University Journal of Natural Sciences, vol. 8, pp. 297--302, 2003. [11] CA Floudas, HK Fung, SR McAllister, M Monnigmann, and R Rajgaria, "Advances in protein structure prediction and de novo protein design: A review," Chemical Engineering Science, vol. 61, pp. 966--988, 2006.
[12] G Pandey, V Kumar, and M Steinbach, "Computational approaches for protein function prediction: A survey," techreport 2006.
[13] CA Floudas, "Computational methods in protein structure prediction," Biotechnology and bioengineering, vol. 97, pp. 207--213, 2007.
[14] V Arjunan, S Nanda, S Deris, and M Illias, "Literature survey of protein secondary structure prediction,"
Jurnal Teknologi C, pp. 63--72, 2001.
[15] J Yu and F Fotouhi, "Computational approaches for predicting protein--protein interactions: a survey,"
Journal of Medical Systems, vol. 30, pp. 39--44, 2006. [16] J Liang, "Computation of protein geometry and its
applications: Packing and function prediction,"
Computational Methods for Protein Structure Prediction and Modeling, pp. 181--206, 2007.
[17] Jean-Michel Claverie and Cedric Notredame,
Bioinformatics for Dummies, 2nd edition.: wiley publishing, 2007.
[18] Regina Bailey. (2011) Protein Function. [Online]. http://biology.about.com/od/molecularbiology/a/aa1019 04a.htm
[19] Wolfgang Kabsch and Christian Sander, "Dictionary of protein secondary structure: Pattern recognition of hydrogen-bonded and geometrical features,"
Biopolymers, vol. 22, pp. 2577--2637, 1983.
[20] (2012) RCSB PDB. [Online]. http://www.rcsb.org/pdb/home/home.do
[21] Dong Xu, Hua Li, and Tongjun Gu, "Shape Representation and Invariant Description of Protein Tertiary Structure," Advances in Geometric Modeling and Processing, vol. 2, no. 5, pp. 556-562, 2008. [22] Dong Xu, and Jie Liang Ying Xu, "Computational
methods for protein structure prediction," Biotechnology and bioengineering, vol. 97, pp. 207-213, 2007. [23] Yong Wang, Ling-Yun Wu, Xiang-Sun Zhang, and
Luonan Chen, "Automatic Classification of Protein Structures Based on Convex Hull Representation," in
Theory and Applications of Models of Computation. Berlin : Springer, 2006, pp. 505-514.
[24] Saul B Needleman and Christian D Wunsch, "A general method applicable to the search for similarities in the amino acid sequence of two proteins," Journal of Molecular Biology, vol. 48, pp. 443 - 453, 1970. [25] TF Smith and MS Waterman, "Identification of
common molecular subsequences," Journal of Molecular Biology, vol. 147, pp. 195 - 197, 1981. [26] J Razmara, S Deris, and S Parvizpour, "TS-AMIR: A
Topology String Alignment Method for Intensive Rapid Protein Structure Comparison," Algorithms for Molecular Biology, vol. 7, p. 4, 2012.
[27] Feng Gao and Mohammed J. Zaki, "PSIST:A scalable approach to indexing protein structures using suffix trees," Journal of Parallel and Distributed Computing, vol. 68, pp. 54--63, 2008.
[28] T Shibuya, "Geometric suffix tree: Indexing protein 3-D structures," Journal of the ACM (JACM), vol. 57, p. 15, 2010.
[29] A. Ma’ayan, "Network integration and graph analysis in mammalian molecular systems biology," Systems Biology, IET, vol. 2, pp. 206-221, 2008.
[30] Phung, Do Phuc, and Nguyen Thi Kim, "Visualization of the Similar Protein Structures Using SOM Neural Network and Graph Spectra," Intelligent Information and Database Systems, pp. 258-267, 2010.
[31] Hyunjung Shin, Koji Tsuda, and Bernhard Scholkopf, "Protein functional class prediction with a combined graph," Expert Systems with Applications, vol. 36, pp. 3284--3292, 2009.
[32] S.S. Abeysinghe, T. Ju, W. Chiu, and M. Baker, "Shape modeling and matching in identifying protein structure from low-resolution images," Proceedings of the 2007 ACM symposium on Solid and physical modeling, pp. 223--232, 2007.
[33] M. Vassura, L. Margara, P. Fariselli, and R. Casadio, "A graph theoretic approach to protein structure selection," in Applications of Fuzzy Sets Theory. Berlin / Heidelberg: Springer, 2007, pp. 497-504.
[34] V. Tsatsaias, P. Daras, and M.G. Strintzis, "3D protein classification using topological, geometrical and biological information," in IEEE International Conference on Image Processing, 2007.
[35] D.M. Strickland, E. Barnes, and J.S. Sokol, "Optimal Protein Structure Alignment Using Maximum Cliques,"
Operations research, vol. 53, pp. 389-402, 2005. [36] William Taylor and Andras Aszodi, Protein
geomtry,classification,topology and symmetry.: Institute of physics publishing, 2005.
[37] P.H. and Scott, G. and Shyu, C.R. Chi, "A fast protein structure retrieval system using image-based distance matrices and multidimensional index," in Fourth IEEE Symposium on Bioinformatics and Bioengineering, 2004. BIBE 2004. Proceedings., vol. 15, 2005, pp. 522-529.
[38] A. Sacan, I.H. Toroslu, and H. Ferhatosmanoglu, "Distance-based Indexing of Residue Contacts for Protein Structure Retrieval and Alignment," in 8th IEEE International Conference on BioInformatics and BioEngineering, 2008, pp. 1-7.