© 2017, IRJET | Impact Factor value: 5.181 | ISO 9001:2008 Certified Journal
| Page 2801
PERFORMANCE ANALYSIS OF
5 MWp GRID-CONNECTED SOLAR PV POWER PLANT USING IEC 61724
Brijesh Kumar Gautam
1, Farhan Ali Khan
2, Ajeet Singh
31, 2
PG Student [CSE], Dept. of EIE, HCST, Farah, Mathura, Uttar Pradesh, India
3Assistant professor, Dept. of ECE, HCST, Farah, Mathura, Uttar Pradesh, India
---***---Abstract –
Now a days observing the performance of alarge number of solar PV power plants commissioned is necessity to match the demand of a country. In past decade all over the world has gained information on variation in predicted outputs over different operating conditions. Real operating conditions shows a difference in output from expected values due to the dependence of field variables. A 5 MW Solar PV power plant is studied here and the operational experience during the year 2016 is evaluated. The field data such as solar irradiance, wind, ambient temperature, module temperature, dc and ac power output are recorded at a regular interval using SCADA software. All the performance parameters mentioned in IEC 61724 is calculated using the recorded data. Additionally, various losses, efficiencies and capacity utilization factor are obtained. Final yield of the plant showed a variation from 3.30 h/d to 5.05 h/d with an annual value of 3.72 h/d. Annual Performance ratio for the year 2016 is 73.02 %. Plants variation in output with respect to PV syst simulated results is compared and showed a variation in Performance ratio of 6.95 %. Transformer failure is found to be the reason for the reduction in Performance ratio. Response of plant to different climatic condition is studied by considering daily operation in different seasons. Plant’s performance is also compared with different power plants around the world. This study shows that the plant is operating satisfactorily and could be improved further by improving the proper maintenance of its components.
Key Words: PV Syst, PR (Performance Ratio),SCADA, IEC
61724, CUF (Capacity Utilization Factor), Yf (Final Yield) etc .
1. INTRODUCTION
The National Solar Mission was launched on the 11th January, 2010 by the Prime Minister. The Mission has set the ambitious target of deploying 20,000 MW of grid connected solar power by 2022 is aimed at reducing the cost of solar power generation in the country through (i) long term policy; (ii) large scale deployment goals; (iii) aggressive R&D; and (iv) domestic production of critical raw materials, components and products, as a result to achieve grid tariff parity by 2022. Mission will create an enabling policy framework to achieve this objective and make India a global leader in solar energy.
Further, Government has revised the target of Grid Connected Solar Power Projects from 20,000 MW by the year 2021-22 to 100,000 MW by the year 2021-22 under the National Solar Mission and it was approved by Cabinet on 17th June 2015.
Worldwide energy consumption has been speedily growing since the initiation of industrial revolution and is expected to rise at a further high rate in the coming years. The lack of fossil fuels and its ecological effects has led to the exploration of renewable energy to meet future energy demand. Among renewable energies, solar energy is the most favorable source which is abundant and eco-friendly. In recent years solar energy technology has been developed enough to become a trustworthy source of large scale power production. This technology advancement leads to the installation of MW to GW power plants all over the world. Since the solar PV power production and reliability are sensitive to the field conditions performance analysis of PV power plants are essential to promise optimal performance.
1.1 Solar Photo Voltaic Power Plant
A solar power plant is based on the conversion of sunlight into electricity, either directly using photovoltaics (PV), or indirectly using concentrated solar power (CSP). Photovoltaics converts light into electric current using the photoelectric effect. In 2016, the largest photovoltaic power station in the world was the 850MW Longyangxia Dam Solar Park, in Gonghe County, Qinghai, China. As of April 2017, India may have the largest solar plant with 900 MW of the 1,000 MW already commissioned at the Kurnool Ultra Mega Solar Park.
2. PARAMETERS REQUIRED FOR DESIGNING & THE
PROCESS OF EXTRACTION THROUGH VARIOUS
SOURCES & SYSTEMS
© 2017, IRJET | Impact Factor value: 5.181 | ISO 9001:2008 Certified Journal
| Page 2802
1. Assessment of the solar radiation data for the locationfrom various institutions such as the (NASA)American Space Agency , Solar Radiation Resource Assessment - NIWE , IREDA, National Solar Radiation Database (NSRDB). Good simulation software’s also have inherent solar radiation data which can be used for this similar purpose.
2. Take a land map by using map of the location showing the various sites that can be used for the project. 3. Check the various locations on the land use map and modernize where necessary.
4. Identify grid access and requirement for grid Connection.
5 Find the dimensions of the lands to be used. 6. Valuation of lands and the effect of shading on the lands through nearby buildings, mountains and trees. 7. Finalization of suitable lands and estimate the total area available PV system design.
8. Get solar PV information from various solar suppliers both locally and internationally. This information should include all the parameters like type, cost, size, weight, etc. 9. Prepare the layout of the system for each of the
Module mounted on the lands.
3. Energy output and efficiency variations
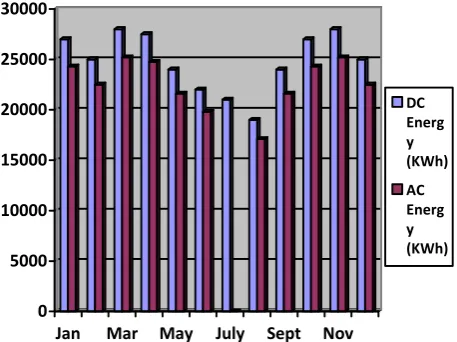
This is the simplest way of analyzing a power plant. The daily energy output of plant is calculated by integrating the power output reading over 24 hours of each day. Average of all days in a month is used for the monthly energy comparison. Energy output of array (dc energy) and energy fed to the 66 kV feeder line (ac energy) is calculated separately. The variation of average daily energy output of each month is plotted in Figure 1. Transformer failure has caused a drop in ac energy in the month of July. Interpolating the graph will show an average loss of around 17000 units per day for the entire month.
0 5000 10000 15000 20000 25000 30000
Jan Mar May July Sept Nov
[image:2.595.296.560.280.445.2]DC Energ y (KWh) AC Energ y (KWh)
Figure -1: Monthly average daily energy output variations
3. 1 Performance Analysis
[image:2.595.49.278.562.733.2]Performance analysis done using IEC 61724 is compared with the modeled values simulated using PV syst software. For the comparison study, the plant is designed in PV syst software in the same way as it is done in actual conditions. The expected performance parameters obtained from the PV syst software are compared with the calculated values obtained from data. Table1 shows the comparison of Final yield for various months. Most of the months have shown a percentage deviation of less than 9 %. A highest deviation of 21 % is observed in August.
Table-1: PV Syst Generated Simulink Result
Annual Performance ratio obtained from simulation result is 78.10 while actual value calculated from data for the year 2016 is 73.02 .The low value of Performance ratio is due to the zero performance in July. Annual final yield is obtained as 4.73 h/d in software simulated result and the calculated annual final yield is 3.725 h/d.
3.2 Performance comparison with PV syt
simulation results
Performance analysis done using IEC 61724 is compared with the modeled values simulated using PV syst software. For theComparison study, the plant is designed in PV syst software in the same way as it is done in actual conditions. Simulation result is shown in Figure-2. Y
f
Jan FebMar AprMa y
JuneJul Aug Sep t
OctNovDe c Calcu lated 4.6 7 4.4 5
5.05 4.4 3
4.00 3.83 0.0 8 3.3 0 4.0 7 4.5 8 3.3 3 3.5 1 PV Syst 4.5 9 5.2 4
5.41 5.2 0
© 2017, IRJET | Impact Factor value: 5.181 | ISO 9001:2008 Certified Journal
| Page 2803
Figure-2: PV Syst Generated Simulink Result
© 2017, IRJET | Impact Factor value: 5.181 | ISO 9001:2008 Certified Journal
| Page 2804
Figure-4: PV Syst Generated Simulink Result(Loss Diagram)
Figure-3 shows the total Energy Produced during the year data of the plant at certain conditions & Figure -4
illustrates the losses over the whole year using PVsyst by which the output will be effected
3.3 Results & Future Scope
The following parameter shown below shows the difference observed on analysis of a plant:
• Performance Ratio (Calculated) = 73.02
• Performance Ratio (PvSyst) = 78.10
• Annual Average Final Yield (Calculated) = 3.72 KWh/(KWp-day)
• Annual Average Final Yield (PvSyst) = 4.73 KWh/(KWp-day)
• Variation in Performance Ratio = 6.95 %
• Variation in Final yield = 21.35 %
To improve the performance ratio by optimizing the certain conditions:
How to minimize the Conversion losses. By improving the storage conditions.
How to get maximum radiation on modules at perpendicular inclination at cheaper cost.
By doing PVsyst analysis of solar power plant and monitoring we have found actual location of issues and number of issues in the solar power plan. i.e. the losses due to solar panel faults. Previous methods used were not able to optimize the performance of the jajru plant. So many a times problems remains unnoticed in the system which cause power loss to the PV plant. This method clearly distinguishes between issues and reasons of power losses. So it is very efficient and time saving approach for monitoring the solar plants. It gives me a relatively quick result and gives with reliability. I have used PVsyst as software and IEC-61724 as a standard for evaluation. PVsyst Software I have used for analyzing the plant by making similar conditions as actual power plant.. So it saves time and reliable compare to other conventional method of analysis of solar power plant. It will definitely help in future to examine the solar panel in less time with lots of cost saving and with reliability
4. CONCLUSIONS
© 2017, IRJET | Impact Factor value: 5.181 | ISO 9001:2008 Certified Journal
| Page 2805
Comparison with other power plants of different operatingconditions has shown a better performance in this 5 MWp Solar PV power plant. However the losses incurred due to the outages were the reason for not attaining a maximum performance.
REFERENCES
[1] K. Padmavathi, S. Arul Daniel. “Performance analysis of
a 3 MWp grid connected solar photovoltaic power plant in India “, Energy for Sustainable Development 17 (2013) 615–625
[2] Bryson Rupnik and Owen Westbrook, “Ambient
Temperature Correction of Photovoltaic System Performance Data “ , Juwi solar Inc., Boulder, CO, 80301, USA
[3] Decker B, Jahn U. “ Performance of 170 grid connected
PV plants in Northern Germany—analysis of yields and optimization potentials “. Solar Energy Vol. 59, Nos. 4-6, pp. 127-133, 1997.
[4] IEC. Photovoltaic system performance monitoring—
guidelines for measurement, data exchange and analysis. IEC standard 61724. Geneva, Switzerland; 1998.
[5] IEA (International Energy Agency), “Analysis of
Long-Term Performance of PV Systems-Different Data Resolution for Different Purposes”, International Energy Agency Photovoltaic Power Systems Programme, Report IEA-PVPS T13-05:2014.
[6] IEA (International Energy Agency), “Energy from the
Desert: Very Large Scale PV Power Plants for Shifting to Renewable Energy Future “. IEA PVPS Task8,External Final Report IEA-PVPS, February 2015.
[7] H. Mitavachan, Anandhi Gokhale, B. R. Nagaraju, A. V. V.
Reddy, D. C. Krishnamurthy and J. Srinivasan “Performance of a megawatt-scale grid-connected solar photovoltaic power plant in Kolar District in Karnataka, Report IISC-DCCC 11 RE 1 August 2011.
[8]